Effect of TongFengNing Decoction on UricAcid Levels and Xanthine Oxidase Activity in Hyperuricemia Rats
Jian-hui Wang,Jie-mei Guo,Bao-lin Li,Fang-zhou Teng,Ya-ju Zhu,Jian-ping Lin,Yan Xiao,Xiao Mao,Lu-lu Huang,You-xin Su,*
1Fujian University of Traditional Chinese Medicine,Fujian,China.2Fujian Health College,Fujian,China.3The Affiliated Rehabilitation Hospital of Fujian University of Traditional Chinese Medicine,Fujian,China.
Background
Hyperuricemia(HUA)is a purine metabolic disease caused by overproduction,inadequate excretion of serum uricacid (SUA),orboth,which isthe principal biochemical basis for the onset of gout and is closely related to chronic nephrosis and heart cerebrovascular disease[1].Western medicine currently uses drugs such as allopurinol, febuxostat, benzbromarone, and probenecid to treat HUA and gout[2].However,these drugs have a high price and several adverse reactions;long-term use can damage the stomach,liver,and kidneys.As summarized by our research team,TongFengNing Decoction(TD)is a recipe shown to be effective in treating gout following years of clinical practice under the guidance of the concept of“Bi syndrome caused by internal dampness”[3].Previous clinical studies have confirmed that TD can reduce the level of SUA in patients with gout[4,5].Animal studies have shown that TD can reduce SUA levels in rabbits,chickens,and HUA model mice with acute gouty arthritis[6-8],but the specific mechanism by which uric acid is lowered is still unclear.Modern medical research has confirmed that xanthine oxidase(XOD)is akey enzyme in the production of uric acid.Numerous drugs reduce uric acid mainly by interfering with the XOD expression pathway,by competitive inhibition of XOD activity,or both[9].In this study,we assessed the effect of TD on the levels of SUA,urine uric acid(UUA),and intestinal uric acid(IUA),as well as on XOD activity and mRNA expression in the liver and small intestine of HUA rats.By studying the possible mechanism of TD-mediated reduction of uric acid,we hope to lay a foundation that will popularize the clinical application of this decoction.
Materials
Animals
Healthy male SD rats(90 total,weighing 200± 20 g,SPF grade,and 3 months old)were provided by Shanghai Slack Laboratory Animals Co.,Ltd.(Shanghai,China,license No:SCXK(Shanghai)2012-0002).These rats were purchased and raised at the Experimental Animal Center of Fujian University of Traditional Chinese Medicine,(Fuzhou,China,Certificate No:SYXK(Min)2014-0001).These rats were maintained in a room under the following conditions:A temperature of 22 ± 2°C,humidity of 60±10%,and a 12-h light/dark cycle.
Drugs
Test drug:PThe TD test drug consisted of Tufuling(Smilacis glabrae rhizoma), Bixie (Dioscoreae spongiosae rhizome),Zexie(Alismatis rhizome),Cangzhu(Atractylodis rhizoma),Jinqiancao(Lysimachiae herba),Danshen (Salviae miltiorrhizae radix etrhizoma),Chuanniuxi(Cyathulae radix),Qinjiao (Gentianae macrophyllae radix),Zhongjiefeng(Sarcandrae herba),Huangbo(Phellodendri chinensis cortex).They were purchased from the National Medical Hall of Fujian University of Traditional Chinese Medicine,concentrated to a drug solution containing 2 g/mL of crude drug according to the established process.
Positive drug:Allopurinol(100 mg/tablet)was purchased from Chongqing Qingyang Pharmaceutical Co.,Ltd.(batch number:141208).
Reagents
Reagentsutilized in thisstudy include:Potassium oxonate (OAPS), hypoxanthine (HX), sodium carboxymethylcellulose(CMC-Na)(Aladdin Industrial Corporation);uric acid assay kit,XOD kit(Nanjing Institute of Bioengineering);RNA Isolater,HiScript®II RT SuperMix,PCR Mix(Vazyme);analytical grade of isopropanol,analytical grade of chloroform(National Pharmaceutical Group Chemical Reagent Co.,Ltd.);agarose(OXOID),DNA marker,and nucleic acid dye solution(Vazyme).
Preparation of experimental reagents
The experimental reagents utilized in these experiments were prepared as follows:
(1)0.5%CMC-Na solution:CMC-Na powder(5 g)was added to 995 mL physiological saline and stirred to dissolve completely to prepare a 0.5%CMC-Na solution.
(2)OAPS solution:OAPS powder was added to 0.5%CMC-Na solution to prepare the OAPS solution with a concentration of 50 g/L.
(3)HX solution:CMC-Na solution was added(0.5%)to HX powder to prepare a solution with a concentration of 25 g/L HX.
(4)Allopurinol suspension:An allopurinol pill was ground into a powder and dissolved in 0.5%CMC-Na solution to prepare a 2 g/L allopurinol suspension.
Instrument
The instrumentsutilized in thisstudy included a low-temperature high-speed centrifuge (Germany Eppendorf 5417R),a spectrophotometer(US Thermo NanoDrop2000),aPCR instrument(USApplied Biosystems 9700 PCR System),a gel imager(US Biorad GelDoc XR),a horizontal electrophoresis system(US BIO,USA-RAD),and a multi-function microplate reader(Austria TECAN Infinite M200).
Methods
Animal grouping
Three-month-old SPF healthy male SD rats(90 total)were randomly divided into 6 groups with 15 rats in each group,namely:the Blank group,the model group,the low-,moderate-,and high-dose TD groups,and the allopurinol group.
Animal model establishment and identification
Ratsin allgroupsexcepttheblank group were administered 500 mg/kg HX(1 mL/kg)once a day by gavage and intraperitoneally injected with 100 mg/kg OAPS(0.5 mL/kg)to establish HUA rat model.SUA levels were measured in blood from the canthus in rat eyes on the 21st day for model identification.
Drug intervention
The 22nd day of modeling was the 1st day of drug intervention by gavage with doses according to the equivalent dose conversion of human and animal body surface area[10].After the model was successfully identified,rats in the low-,moderate-,and high-dose TD groups were administered 7.65 g/kg/d,15.3 g/kg/d,and 30.6 g/kg/d of TD,respectively,by gavage twice daily for 21 days.Rats in the allopurinol group were administered 20.8 mg/kg/d of allopurinol suspension,while those in the blank group and the model group were administered the same amount of normal saline.In order to maintain a stable high level of SUA status,rats in all groups except the blank group were administered 500 mg/kg HX by gavage every morning and intraperitoneally injected with 100 mg/kg OAPS.
Specimen Collection
On the 7th,14th,and 21st days after drug intervention,24-h urine samples were collected from 5 rats,which were randomly selected from each group by the metabolic cage.Rats were anesthetized with 3 mL/kg 10%chloral hydrate intraperitoneally,blood samples were collected from the abdominal aorta and centrifuged(3,000 rpm,20 min),then the serum was packed separately and stored at-20°C.Intestinal cannula irrigation with saline,beginning at the duodenum,was collected as the rinse solution at the end of the colon[10],centrifuged(3,000 rpm,5 min),and the supernatant collected as the extract,The liver tissue was placed on ice,rinsed with normal saline,frozen with liquid nitrogen,and transferred to the-80°C freezer.
Index detection
Detection of SUA,UUA,and IUA SUA,UUA,and IUA levels were detected at different time points by enzyme colorimetry according to the instructions of the uric acid assay kit.
Detection of XOD activity XOD activity in the liver and small intestine was measured according to the instructions in the kit.OD levels were measured by spectrophotometer and used to calculate XOD activity levels.
Detection of the expression of XOD mRNA in the liver and small intestine 1.Extraction of RNA:1)100 mg of liver and small intestine tissues were fully ground in liquid nitrogen and put into 2 EP tubes.RNA isolater(1 mL)was added to both tubes and left at room temperature for 15 min after mixing.2)Each tube was treated with 1 mL Trizol and 200µL of chloroform,subjected to 15 s of sharp whirlpool oscillates,placed at room temperature for 10 min,and centrifuged(12,000 rpm,15 min).3)The supernatants(500µL)were transferred into 2 new EP tubes and an equal volume of isopropyl alcohol was added.The tubes were placed at-20°C for 30 min,then centrifuged(13,000 rpm,10 min).4)The supernatant was discarded and the sediment was retained.Pre-cooled 75%ethanol(1 mL)was added to each tube to oscillate and wash the RNA precipitation,then centrifuged(7,500 rpm,5 min).5)The supernatant was discarded and the RNA pellet dissolved in solution. After the UV spectrophotometer was adjusted to zero,the RNA sample(1µL)was added to the test bench,the OD 260 nm and OD 280 nm values were recorded,and the RNA concentrations were calculated.6)The RNA solution was centrifuged(7,500 rpm,1 min),the residual liquid was absorbed,and the RNA pellet was let stand at room temperature for 3 min to dry.The RNA samples were then stored at-80°C until use.
2.Reverse transcription:HiScript®II RT SuperMix was used to carry out reverse transcription in preparation for PCR as follows:1)The DNA was prepared by placing the removal solution on ice,adding 4×gDNA wiper Mix(6µL),total RNA(according to the sample concentration)and ddH2O(total volume to 24µL).The mixture was shaken to disperse the constituents evenly,centrifuged for several seconds,put into the PCR instrument,and set at 42℃for 2 min to remove the DNA reaction.2)The RT reaction liquid was prepared on ice,5×RT SuperMix II(6µL)and added to generate the first reaction liquid(26µL),mixed by shaking,then centrifuged for several seconds,placed in the instrument,reverse transcribed at 50°C for 15 min,then inactivated at 85°C for 2 min;3)The cDNA was stored at-20°C or used immediately to perform a PCR reaction.
3.Design and synthesis of primers:Primer design and synthesis were commissioned by Kingsry Biotechnology Co.;LTD.GAPDH was used as an internal reference(Table 1).
4.Polymerase chain reaction (PCR):1)The reactants were added into the PCR reaction system as follows:2×rTaq PCR Mix(10µL),10µmol/L upstream primer(0.4µL),10µmol/L downstream primers(0.4µL),cDNA template(4 µL)and 20 µL ddH2O.2)PCR amplification was performed as follows:Pre-degeneration:94°C for 5 min,Degeneration:94°C for 30 s,Annealing:58°C for 30 s,Extension:72°C for 20 s,2→4(30 cycles),Extension:72°C for 7 min.PCR amplification products(4µL)were obtained after the reaction was complete and a 10%agarose gel was prepared for electrophoresis and product detection.
5.Agarose gel electrophoresis identification:1)TAE(50×,20 mL)was diluted to 1000 mL and 0.8 g agarose was dissolved in 80 mL of this solution.Gelred nucleic acid dye(10µL)was added after boiling,and 750 mL of TAE was poured into the electrophoresis chamber.2)When the agarose solution was cooled,it was poured into the assembled electrophoresisplate.Afterthe gel solidified,the comb was pulled out and the TAE electrophoresis solution was added.3)DNA marker(4µL)and PCR sample(4µL)were added in sequence.4)Electrophoresis was performed at 120 V for 30 min and the gel strips were imaged using a Gel imager.
Statistical analysis
This experiment used SPSS 20.0 software for statistical analysis.All measurement data are expressed as mean±SD.Group statistical comparisons were assessed by one-way analysis of variance(ANOVA).The LSD method was used when the variance is homogeneous.Otherwise the Tamhane's T2(M)method was applied.Differences were considered significant when the P value was less than 0.05.

Table 1.Primer sequences
Results
Effects of TD on the levels of SUA,UUA,and IUA in each group of rats over time
As shown in Table 2,Table 3,and Table 4,the SUA and IUA of the model groups were increased significantly on the 7th,14th and 21st days of the intervention(P<0.05),but there was no significant difference in UUA(P>0.05)compared to the blank group.Compared with the model group,SUA and IUA decreased and UUA increased in each dose of the TD group on the 14th and 21st days of the intervention(P<0.05),while SUA and IUA in the allopurinol group decreased at all time points(P<0.05)and there was no significant difference in UUA(P>0.05).Compared with the moderate-dose TD group,SUA of the allopurinol group decreased on the 7th day of the intervention(P<0.05),then the SUA and IUA were increased and UUA was decreased on the 14th and 21st days of the low-and high-dose TD groups and the allopurinol group(P<0.05).Over time,SUA and IUA continued to decrease in TD groups at each dose(P<0.05).The UUA on the 14th day of intervention was higher than that on the 7th day of intervention(P<0.05)and there was no significant difference between the 21st day and the 14th day of intervention(P>0.05).
Effects of TD on XOD activity in the liver and small intestine of each group of rats over time
As shown in Table 5,XOD activity in the liver and small intestine increased in the model group on the 14th and 21st days of intervention(P<0.05).Compared with the model group,XOD activity in the liver and small intestine decreased at each dose within the TD group and the allopurinol group on the 14th and 21st days of intervention (P < 0.05). Compared with the moderate-dose TD group,XOD activity in the liver and small intestine increased in the low-and high-dose TD group and the allopurinol group(P<0.05).Over time,the activity of XOD in the liver and small intestine at each dose within the TD group and allopurinol group decreased(P<0.05).
Effects of TD on XOD mRNA in the liver and small intestine of each group rats over time
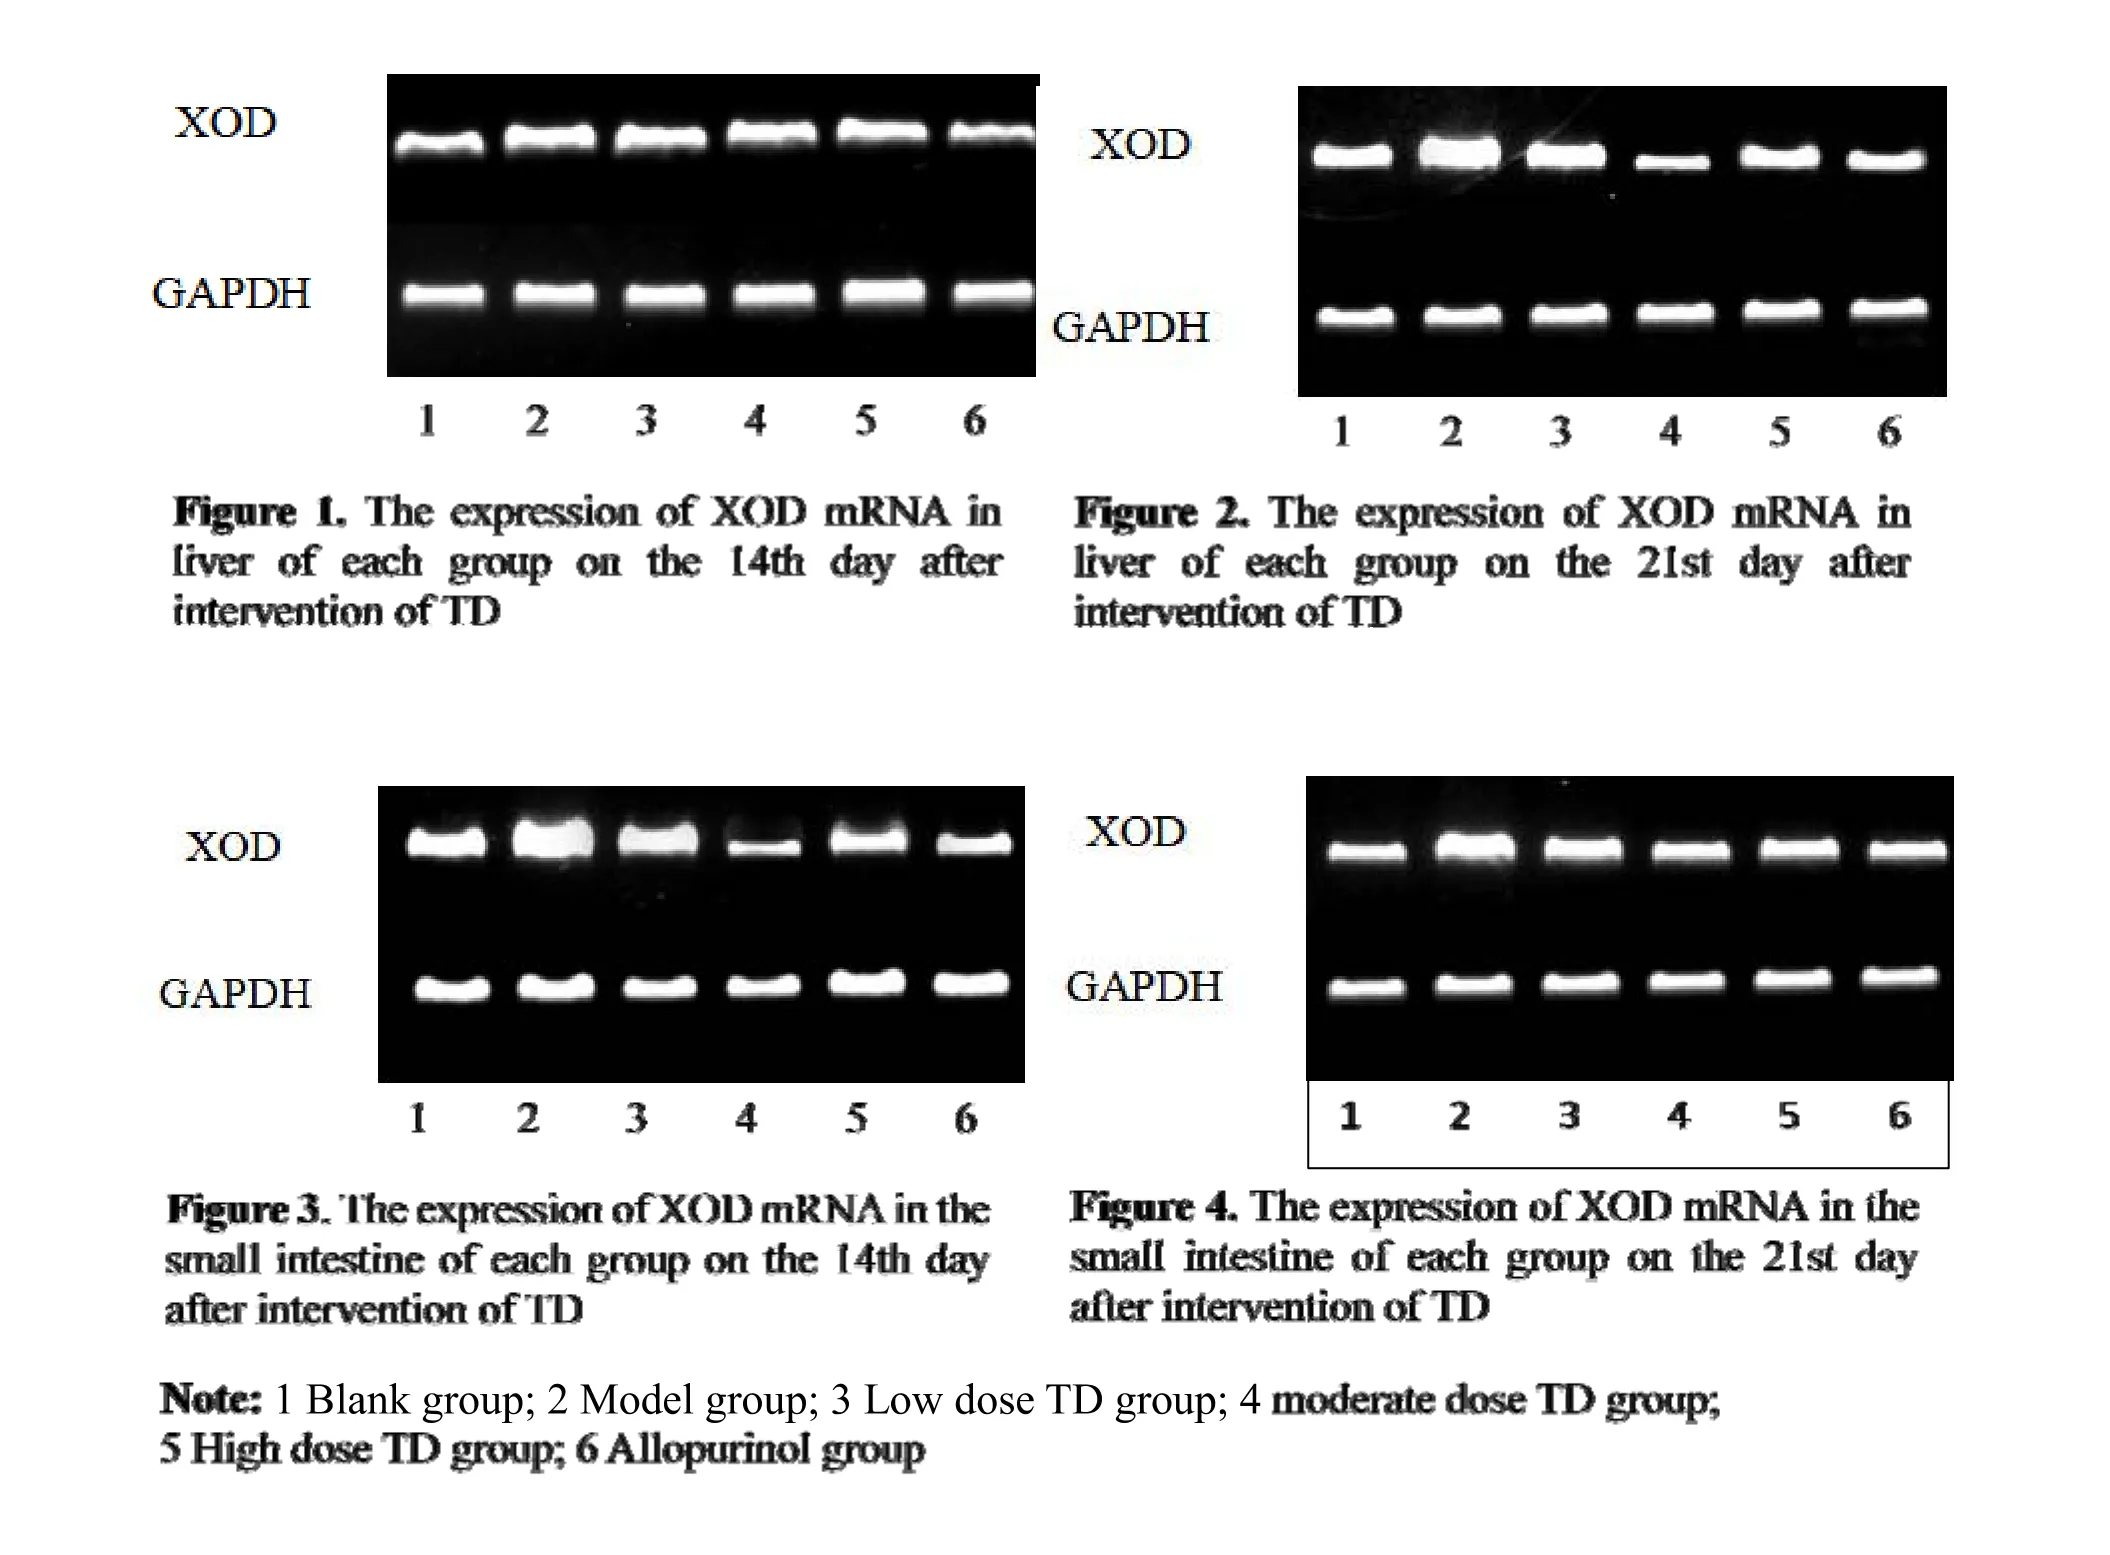
As shown in Table 6,the expression of XOD mRNA in the liver and small intestine increased in the model group on the 14th and 21st days of intervention(P<0.05).Compared with the model group,the expression of XOD mRNA in the liver and small intestine decreased at each dose within the TD groups and allopurinol group at each time point(P<0.05).Compared with the moderate-dose TD group,the expression of XOD mRNA in the liver and small intestine increased in the low-and high-dose TD groups and the allopurinol group at different time points(P<0.05).Over time,the expression of XOD mRNA in the liver and small intestine at each dose within the TD groups and the allopurinol group decreased(P<0.05).
Table 2.Comparison of SUA in each group rats over time(±s,n=5,mmol/L)

Table 2.Comparison of SUA in each group rats over time(±s,n=5,mmol/L)
Note:▲Compared with the blank group(P<0.05);★compared with the model group(P<0.05);▼compared with the moderate-dose TD group(P<0.05);■compared with each time point(P<0.05).1 Blank group;2 Model group;3 Low dose TD group;4 moderate dose TD group;5 High dose TD group;6Allopurinol group.
Groups 7 d 14 d 21 d 1 115.12±19.30 115.00±21.53 114.20±17.56 2 409.63±17.98▲ 474.30±20.01▲ 547.16±20.66▲3 397.14±11.97 330.75±10.79★▼■ 260.19±10.88★▼■4 395.69±13.88 250.90±3.75★■ 150.58±11.02★■5 366.78±20.17 304.38±9.01★▼■ 185.23±11.15★▼■6 275.94±11.98★▼ 271.81±4.33★▼ 250.06±9.11★▼
Table 3.Comparison of UUA in each group rats over time(`±s,n=5,mmol/L)

Table 3.Comparison of UUA in each group rats over time(`±s,n=5,mmol/L)
Note:▲Compared with the blank group(P<0.05);★compared with the model group(P<0.05);▼compared with the moderate-dose TD group(P<0.05);■compared with each time point(P<0.05).1 Blank group;2 Model group;3 Low dose TD group;4 moderate dose TD group;5 High dose TD group;6Allopurinol group.
Groups 7 d 14 d 21 d 1 1326.40±53.68 1371.59±32.57 1320.55±29.46 2 1324.10±38.86 1333.18±38.86 1229.2±44.46 3 1345.38±86.52 1629.85±76.26★▼■ 1703.72±88.19★▼4 1355.67±89.25 1922.37±79.09★■ 1992.20±70.58★5 1341.50±62.45 1792.20±52.86★▼■ 1863.45±46.27★▼6 1289.76±56.46 1359.98±59.28▼ 1307.18±73.55▼
Table 4.Comparison of IUAin each group rats over time(`±s,n=5,mmol/L)

Table 4.Comparison of IUAin each group rats over time(`±s,n=5,mmol/L)
Note:▲Compared with the blank group(P<0.05);★compared with the model group(P<0.05);▼compared with the moderate-dose TD group(P<0.05);■compared with each time point(P<0.05).1 Blank group;2 Model group;3 Low dose TD group;4 moderate dose TD group;5 High dose TD group;6Allopurinol group.
Groups 7 d 14 d 21 d 1 28.97±7.41 26.92±3.32 27.89±5.28 2 70.29±8.69▲ 87.29±10.44▲ 99.38±10.78▲3 63.79±6.57 51.29±3.97★▼■ 43.18±2.71★▼■3 60.63±6.81 40.73±2.28★■ 28.35±1.90★■5 61.30±8.60 47.87±1.24★▼■ 41.41±1.88★▼■6 54.05±5.96★ 53.01±6.41★▼ 49.89±1.07★▼
Table 5.Comparison of XOD activity in liver and small intestine of each group rats over time(`±s,n=5,U/g protein)

Table 5.Comparison of XOD activity in liver and small intestine of each group rats over time(`±s,n=5,U/g protein)
Note:▲Compared with the blank group(P<0.05);★compared with the model group(P<0.05);▼compared with the moderate-dose TD group(P<0.05);■compared with each time point(P<0.05).1 Blank group;2 Model group;3 Low dose TD group;4 moderate dose TD group;5 High dose TD group;6Allopurinol group.
Groups Liver Small Intestine 14 d 21 d 14 d 21 d 1 53.78±2.71 54.26±4.53 22.72±4.06 23.59±2.20 2 79.35±1.78▲ 88.87±4.64▲ 38.83±3.34▲ 42.27±2.44▲3 73.66±2.12★▼ 65.02±1.60★▼■ 30.26±2.27★▼ 28.65±1.11★▼■4 65.98±1.58★ 56.04±1.01★ 25.83±1.82★ 24.58±1.22★5 67.02±1.48★▼ 60.36±1.11★▼■ 29.97±1.27★▼ 27.41±1.01★▼■6 65.39±2.08★▼ 61.83±1.17★▼■ 29.52±1.13★▼ 27.52±1.23★▼■
Table 6.Comparison of relative gray value of XOD and GAPDH in liver and small intestine(`±s,n=5)

Table 6.Comparison of relative gray value of XOD and GAPDH in liver and small intestine(`±s,n=5)
Note:▲Compared with the blank group(P<0.05);★compared with the model group(P<0.05);▼compared with the intermediate-dose TD group(P<0.05);■compared with each time point(P<0.05).1 Blank group;2 Model group;3 Low dose TD group;4 moderate dose TD group;5 High dose TD group;6Allopurinol group.
Groups Liver Small Intestine 14 d 21 d 14 d 21 d 1 1.21±0.009 1.26±0.011 1.13±0.002 1.28±0.054 2 1.82±0.005▲ 1.85±0.008▲ 1.65±0.000▲ 1.61±0.238▲3 1.49±0.009★▼ 1.23±0.011★▼■ 1.31±0.017★▼ 1.15±0.027★▼■4 1.31±0.012★ 0.95±0.013★■ 1.09±0.000★ 0.90±0.000★■5 1.40±0.015★▼ 1.13±0.006★▼■ 1.14±0.000★▼ 0.98±0.074★▼■6 1.26±0.009★▼ 1.03±0.015★▼■ 1.12±0.000★▼ 0.93±0.000★▼■
Discussion
Owing to changes in lifestyle and diet,the number of HUA patients in China has been gradually increasing[11]and the occurrence of gout associated with HUA is becoming ever more acute.Therefore,there is an urgent need to prevent and treat the disease.The pathogenesis of HUA based on principlesofTraditionalChinese Medicine can be summarized as follows:1)There is an abundance of phlegm and dampness in obese people,whose diets often include greasy and sweet food,and the long-term existence of this condition can damage the spleen;2)The absorptive,metabolic,and digestive dysfunctions of the small intestine cause body fluid transportation disturbances;3)The irregular flow of the liver qi leads to the dysfunction of the spleen in transportion and the Sanjiao in gasification;4)The deficiency of kidney qi causes disorder of transpiration and vaporization and disturbance of ascending lucidity and descending turbidity of the kidney.All the above factors can cause"internal dampness"to breed and become pathogenic heat,which leads to stagnation of Qi and blood,pathogenic dampness,and heat obstruction of the veins and limbs,which eventually induces gout.This is precisely the same as the modern medicine pathogenesis of gout,so we believe that“Bi Syndrome Caused by Internal DampnessAccumulation”.


1. Chang HY,Lee PH,Lei CC,et al.Hyperuricemia Is an IndependentRisk FactorforNew Onset Micro-Albuminuria in a Middle-Aged and Elderly Population:A Prospective Cohort Study in Taiwan.PLoS One 2012,8:e61450.
2. LI HC, Wu HS. A new Urate-lowering drug-Febuxostat.Clin Med J 2012,10:52-55.
3. Chen XM,Su YX.A brief understanding of gout‘Bi syndrome caused by internal dampness.’Fujian J Tradit Chin Med 2011,42:58-59.
4. Su YX,Chen WH,Chen F,et al.Effects of Tongfengning Granule on Blood Uric Acid,ESR,Blood Lipid and Blood Rheology in 30 Patients with Chronic Gouty Joints.Chinese J Tradi Med Trauma Orth 2005,13:18-20.
5. Su YX,Chen WH,Chen F,et al.Clinical Study on 30 Cases of Chronic Gouty Arthritis Treated by Tongfengning Granule.J Fujian Coll Tradit Chin Med 2003,13:12-14.
6. Su YX,Lai Z,Zheng LP,et al.Effects of Tongfengning Granule on the activity of serum xanthine oxidase in chicken gout model.Fujian J Tradi Chin Med 2006,37:41-42.
7. Su YX,Liu XP,Zheng LP,et al.Effects of Tongfengning Granule on uric acid metabolism in experimental mice with elevated blood uric acid.Fujian J Tradi Chin Med 2008,39:45-46.
8. Su YX,Liu XP,Zheng LP,et al.Effect of Tongfengning Granule on IL-1β and TNF-α in joint fluid of New Zealand rabbit gouty arthritis model induced by sodium urate.Fujian J Tradit Chin Med 2008,39:45-46.
9. Du G,Jiang YT,Gu JR.Research progress on uric acid-lowering drugs.New Med 2017,48:369-374.
10.Wu BC.Medical animal experiment foundation and basic technical methods.1st ed.:People's Publishing House.Heilongjiang,Harbin,China 2008.
11.LiJ.Epidemiologic studiesofhyperuricemia.Chinese J Cardiovasc Med 2016,21:83-86.
12.Zhu CS,Zhang B,Li ZJ,et al.Research progress of traditional Chinese medicine in the treatment of hyperuricemia. Tradi Chinese Med Pharm 2015:4374-4376.
13.Yang HJ,Zhang L,Liu W,et al.Advances in research on oraladministration oftraditional Chinese medicine for gout.Rheumatoid Arthritis 2017,6:67-71.
14.Qin YW. Research progress on xanthine dehydrogenase.Forensic Med Sci2002,23:218-219.
15.Chen GL,Zhu LR,Na S,et al.Effects of total saponins of saponins on chronic hyperuricemia and renal tubular uric acid transporter 1 expression in rats.Chin J Tradi Chin Med 2013,38:2348-2353.
16.Guo SY,Zhang W,Zhang Y.Effect of Glabrous Greenbrier Rhizome on Uric Acid in Hyperuricemic Rats.Chin Pharm 2012,21:3-4.
17.Wang JP,Liu YM,He ZC,et al.Effect of ethanol extractofAlisma orientalis on hyperuricemia induced by potassium oxonate in rats.Chin Tradi Med 2017,39:605-608.
18.Yao X,He SH,Tang Y,et al.Extraction Separation and Pharmacodynamic Screening ofAnti-gout Active Components from Lysinwchia christinae Hance.Mod Chin Med 2014,16:985-988.
 TMR Modern Herbal Medicine2018年4期
- TMR Modern Herbal Medicine的其它文章
- Clinical experience in treating 78 cases of upper limb edema after breast cancer operation by WenYang HuoXue Washing Prescription
- Clinical observation of Furongtongmai capsule on the lower extremity Atherosclerotic Occlusive Disease after Intervention Operation
- Application of LC-MS based glutathione-trapped reactive metabolites in the discovery of toxicity of traditional Chinese medicine
- The progress in the chemical constituents of the genus Picrasma during 2007-2017
- Survey of dose-effect relationship in Chinese materia medica
- Analysis of pharmacological action and clinical application of DaXueTeng based on its anti-inflammatory action
