Fundamental diagrams for pedestrian flows in a channel via an extended social force model *
Yan-fang Wei (韦艳芳), Dong-kai Lan (蓝冬恺), Li-yun Dong (董力耘)
1. Shanghai Institute of Applied Mathematics and Mechanics, Shanghai University, Shanghai 200072, China
2. College of Physical Science and Technology, Yulin Normal University, Yulin 537000, China
3. Shanghai Key Laboratory of Mechanics in Energy Engineering, Shanghai 200072, China
Abstract: In this paper, an extended social force model was applied to investigate fundamental diagrams of pedestrian flows.In the presented model, both the static floor field and the view field were taken into account.Then each pedestrian can determine his/her desired walking directions according to both global and local information.The fundamental diagrams were obtained numerically under periodic boundary condition.It was found that the fundamental diagrams show good agreement with the measured data in the case of unidirectional flow, especially in the medium density range.However, the fundamental diagram for the case of bidirectional flow gave larger values than the measured data.Furthermore, the bidirectional flux is larger than the unidirectional flux in a certain density range.It is indicated that the bidirectional flow may be more efficient than the unidirectional flow in some cases.The process of lane formation is quite quick in the model.Typical flow patterns in three scenarios were given to show some realistic applications.
Key words: Pedestrian flow, social force model, view field, floor field, fundamental diagram
Introduction
The fundamental diagram, which describes the relationship between density and velocity or flow,reflects the basic property of pedestrian flow.Many empirical and experimental studies have been conducted to obtain fundamental diagrams[1-2].However,the available datasets show surprisingly large differences, especially when the density exceeds 2.0 ped/m2.Several well-controlled pedestrian experiments have been performed, but some experimental results disagree considerably.Helbing[3]and Kretz et al.[4]found that the bidirectional flow is more efficient than the unidirectional flow.However, Zhang et al.[5]showed that the flow in unidirectional stream is larger than that in bidirectional stream for densities larger than 1.0 ped/m2.The diversity of the findings demonstrates that the fundamental diagram depends on many factors.Therefore, more field observation, experiments and numerical simulation are needed to clarify these deviations in the fundamental diagrams for pedestrian flow.
The fundamental diagram is of basic importance in pedestrian dynamics which serves as a quantitative benchmark for models of pedestrian flow[1].The simplest case is the pedestrian flow in a channel which is suitable to obtain fundamental diagrams numerically.In general, microscopic models allow to simulate detailed interactions among pedestrians, and they can be used to calculate the relationship between density and flux or velocity by averaging, i.e., the fundamental diagram.These models can be classified into two main kinds: force-based models (e.g., the social force model[6]) and rule-based models (e.g.,cellular automaton (CA) models[7]and lattice gas models[8]) which have their own advantages and disadvantages.For example, CA models are discrete and appropriate for describing pedestrian dynamics in complex situations because of its simplicity, flexibility and computation efficiency.The floor field cellular automaton (FFCA) model suggested by Burstedde et al.[9]has been widely used and extended by many researchers.The social force (SF) model[6]is a continuous one which gives a more realistic description of pedestriansʼ movement.In the SF model, the social analogs of physical force, e.g., repulsive interactions, frictional forces and fluctuations were introduced to reproduce detailed behaviors among pedestrians.In order to coincide quantitatively with fundamental diagrams from empirical and experimental studies, many efforts have been conducted to improve the SF model.Lakoba et al.[10]suggested to take realistic parameters in the SF model and introduced new mechanisms in the social repulsion force, e.g.memory effects and density effects.Parisi et al.[11]introduced a self-stopping mechanism to prevent a simulated pedestrian from continuously pushing over other pedestrians.Moussaid et al.[12]proposed a heuristics-based approach which used some intelligent rules to evaluate the feasible direction and velocity.Kretz[13]pointed out how to choose the parameters of the SF model in order to avoid oscillations in the movement of pedestrians.Most of these improvements focused on modifying the forms of interaction forces[14-15].Few have paid attention to the self-driven force which determines the moving direction of individual pedestrian.However, it is not sufficient to guide a pedestrian only by the final destination, especially in complex situations[16].
Motivated by the above facts, we proposed an extended social force model[17]in order to combine advantages of the both kinds of microscopic models.The main modification on the social force model is to determine the desired walking direction of each pedestrian which appears in the self-driven force.In the FFCA model, the static floor field localizes the global environment information and drives pedestrians to their destination.In our model, the static floor field is introduced to the social force model with finer grids.Furthermore, the dynamic floor field is replaced by the view field which is more efficient in dealing with local interactions among pedestrians.By combining the floor field with the view field, the desired walking direction can be determined reasonably.Similar idea has been used in our previous works and proved to be effective[18].More recently, Jiang et al.[19]introduced the dynamic navigation field to the SF model.The dynamic navigation field was used to determine the desired walking directions of individual pedestrians.Han et al.[20]introduced the information transmission mechanism into the SF model to simulate pedestrian behavior in an emergency.
In this paper, we apply the extended SF model[17]to investigate the fundamental diagram for both uniand bidirectional pedestrian flows in a channel.The periodic boundary condition is applied.The numerical results are compared with measured data.More attention is paid to the process of lane formation in bidirectional flow.
1.The extended social force model
The movement equation in the SF model[6]is expressed as follows:

wherexi(t)is the position of pedestrianiandvi(t)is his/her actual velocity, i.e.,represents the mass of pedestriani.
There are three terms on the right side of Eq.(1).The first term is the self-driven force which represents the desire to adapt the actual velocityto the desired velocity

Here, the key issue is how to determine a pedestrianʼs desired direction, especially in the case of complex surroundings.The static floor field (SFF) is used to specify regions of space which are more attractive, e.g., exits or other targets[21].The gradient of the static floor field indicates the plausible moving direction for each pedestrian.Some effective algorithms have been proposed to calculate the static floor field in the presence of obstacles in a room[22-23].In this paper, the floor field is defined in a lattice, see Fig.1(a).The size of the lattice is 0.1 m×0.1 m that is smaller than that of a typical pedestrian.A pedestrian is represented by a circle of radiusrand his/her center is marked by a cross.There are eight possible directions for a pedestrian which are labeled by numbers.The probability to the nearest neighboring cells is calculated by the static floor fieldS, see Huang et al.[23]

whereSiis the strength of the static floor field of pedestriani, andSncorresponds to the strength of the static floor field at the neighboring cells.KSis the coefficient of the static floor field.In the diagonal direction, e.g., 2, 4, 6, 8 in Fig.1(a),d= 2,otherwised=1.In this case, pedestrians tend to walk in a straight line with a larger probability.
The view field of a pedestrian is also taken into account and represented by a circular region with radiusrV, which is divided into eight parts and shown in Fig.1(b).Each part corresponds to one of possible moving directions.The view field plays a similar but more efficient role as the dynamic floor field.The basic idea is that a pedestrian tends to follow the leader in the same direction and keeps away from those in the opposite direction

whereKVis the coefficient of the view field.Δnρis defined as the difference between the number of pedestrians with the same direction (or targets) and others divided by the area of each part.

Fig.1(a) A pedestrian (solid circle) in finer grids with eight possible directions

Fig.1(b) A pedestrian (solid circle) and his/her view field(dashed circle)
Finally, we obtain the transition probabilities to the neighboring cells according to the following formula


whereCis a normalization factor to ensureAccording toPn,pedestrianidetermines his/her desired direction in a random way.Notice thatKSis no longer a constant and is a decreasing function of density in the view field whereVρis the density of pedestrian in the view field.WhenVρtends to zero,KSreaches its maximum, then pedestrians have a strong intention to move towards his/her target.WhenVρincreases,decreases accordingly, the movement of a pedestrian may be influenced significantly by others in his/her view field.

The social force is a kind of the psychological force which includes the repulsion forceand the attraction force


The physical force includes the body force and the sliding friction force which take place when pedestrians have physical contact, i.e.,

where the functionΘ(x)is equal to its argumentxifx≥0, otherwise 0.means the tangential direction,denotes the tangential velocity difference, andkandκrepresent large constants.

The interactions with the boundaries of walls and other obstacles are treated analogously to those among pedestrians and will not be repeated here.Furthermore,the parameters for pedestrian-wall interactions are taken as those of pedestrian-pedestrian interactions.More detailed discussion about the model can be found in Ref.[17].
2.Numerical simulation
In this paper, we mainly focus on the basic properties of uni- and bidirectional pedestrian flows in a channel, i.e., their fundamental diagrams.In the case of a channel without obstacles, each pedestrian inside knows his/her desired direction, so the floor field does not obviously show its ability in determining pedestriansʼ moving direction in complex situations.However, if pedestrians are treated as a kind of dynamic obstacles[24], the static floor field is no longer static and should be updated over time.On the other hand, the view field still takes effect on the motion of pedestrians.
Some parameters of the extended SF model were determined by comparing simulation results with the experimental data of Kretz et al.[25]In our simulation,these parameters are set as follows: For each pedestrian, the radiusrp=0.2m , the massm= 80kg, the desired velocity0=1.34m/sv, the relaxation timeτ= 0.5s.As for the view field, the radius of the view fieldrV=1.5m andKV=1.13.The coefficients of the SFF areK0=0.5 andH=5.0.The parameters for both the social force and the physical force areA|m= 1.8,B=0.1,k|m= 150,κ/m=5,respectively.The four parameters in this paper are close to those of Kretz et al.[25]and they are rather small, hence the physical forces among pedestrians are reasonable.It makes possible to adopt larger time step (e.g., 0.1 s) during simulations.
2.1 Unidirectional flow
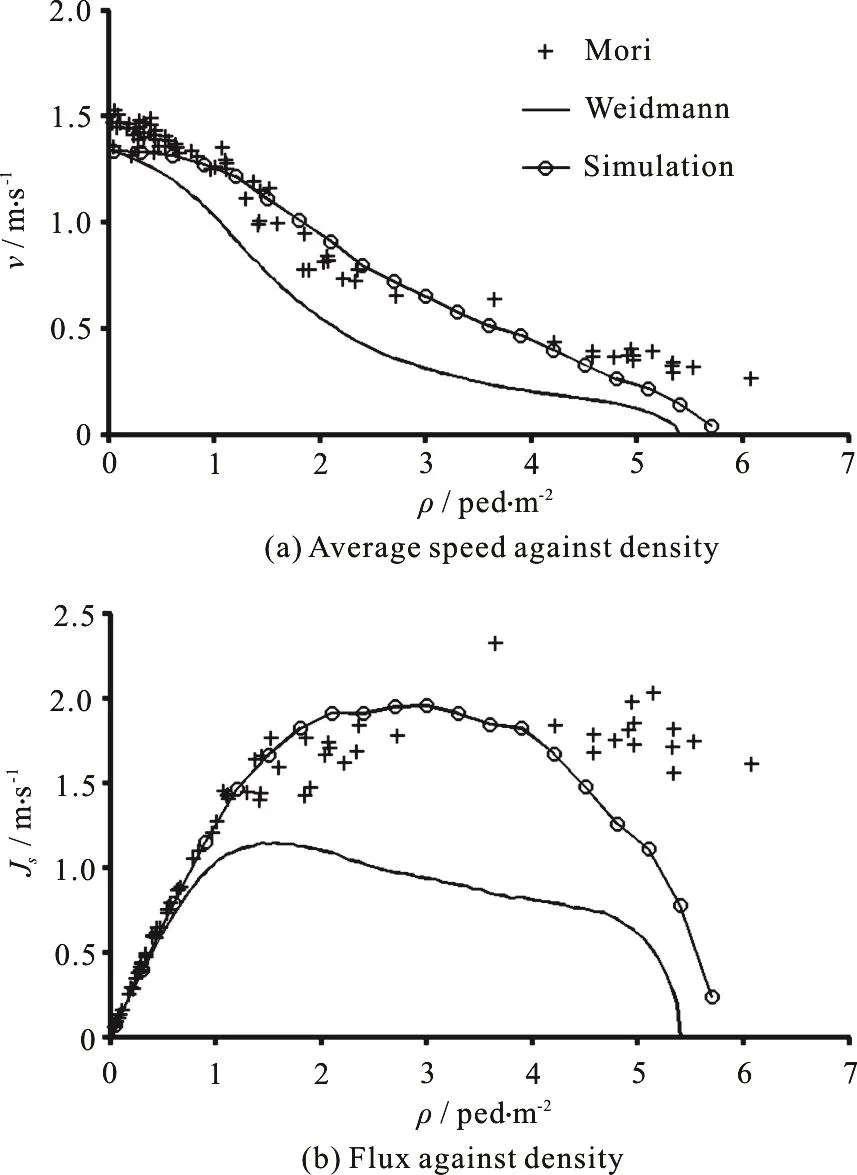
The length and width of the channel are 14 m and 2.4 m, respectively.Initially, all pedestrians with given density were distributed randomly in the channel.Figure 2 shows the fundamental diagram obtained by numerical simulation and the data of Mōri and Tsukaguchi[26]measured in the central business district of Osaka City on strictly unidirectional streams.For comparison, the fundamental diagram used in planning guidelines[27]has been shown together.It was found that the velocity decreases with the density of pedestrian, see Fig.2(a).The numerical results coincide with Mōriʼs data quite well, especially in the medium density range.It was shown that the data given by Weidmann are smaller than those of both experimental and numerical data.It was believed that the fundamental diagrams of multidirectional and unidirectional flow differ only slightly, while Weidmann neglected difference between them.According to the numerical results shown in Fig.2(b),it was found that the specific fluxIsincreases with density in the low density range (ρ<1.5ped/m2).Then the flux decreases slightly in the medium density range.In the high density range (ρ>4.0ped/m2),the flux decreases with density abruptly.According to Mōriʼs data[26], the flux remains a large value even in very high density, it can be attributed to pedestrians moving in groups coordinately.To mimic such a phenomenon, it is better to use the open boundary condition.

Fig.2 Fundamental diagrams for unidirectional flow including the planning guidelines (Weidmann), measured data(Mōri) and simulation results (Simulation)
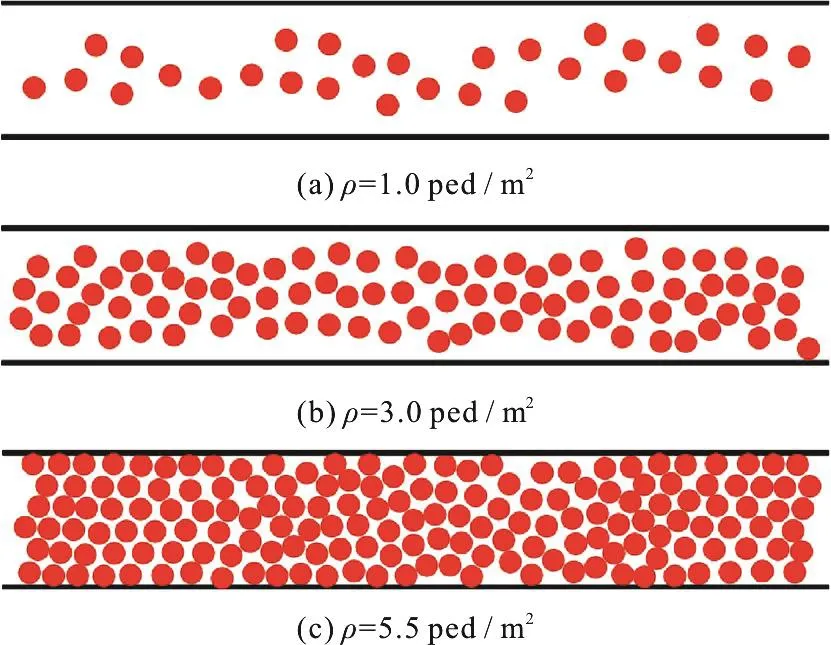
Figure 3 shows the spatial distributions of pedestrians with typical densities in different density ranges.As is shown in Fig.3(a), it is the free flow state.Pedestrians move with higher velocities close to the desired velocity.Due to the view field, pedestrians tend to follow those in front and move in order.Usually they move in the middle of the channel.At the medium density, pedestrians can follow those in front and move slowly, as shown in Fig.3(b).According to the numerical results, it can be regards as the saturated flow, see Fig.2(b).When the density is rather high, the free space in front of each pedestrian is quite limited and he/she hardly moves forward.It is the congested state.

Fig.3 (Color online) Flow patterns for unidirectional flow at typical densities

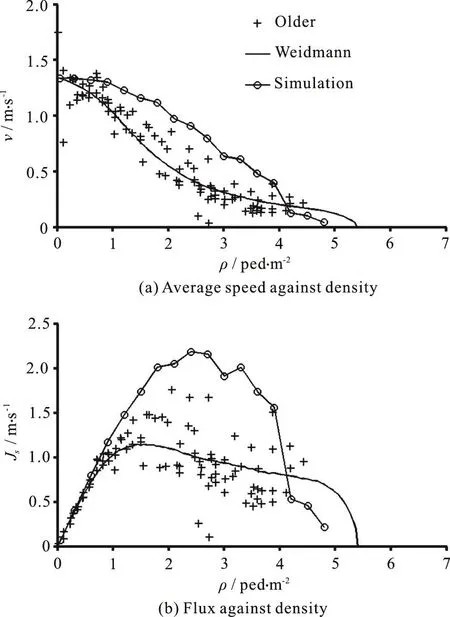
Fig.4 Fundamental diagrams for bidirectional flow including the planning guidelines (Weidmann), measured data(Older) and simulation results (Simulation)
2.2 Bidirectional flow
The channel is 14 m in length and 4.8 m in width.Besides the results of Weidmann and our simulation,the data of Older[28]are shown together.In general,most field data were measured on multidirectional streams.Compared to the case of unidirectional flows,the data for bidirectional flow are more scattered.The curve calculated by Weidmannʼs formula lies between the measured data of Older.Therefore, Weidmannʼs formula reflected the features of bidirectional flow quite well.As is shown in Fig.4(a), the velocity decreases with increasing density.The simulation data are larger than those of Weidmann and Older at the density ranging from 1.0-4.0 ped/m2.By comparing the simulation data in Fig.2(b), Fig.4(b), we found that the specific flux in the bidirectional case is larger than that in the unidirectional case at the density ranging from 1.5-3.3 ped/m2.Therefore, it seems that our simulation results partly support the conclusion in Ref.[4].It is obvious that the congestion density for bidirectional flow is lower than that for unidirectional flow.The lane formation in counterflow can reduce the conflicts between pedestrians in opposite directions and then enhance the walking efficiency of pedestrians.However, when the density is high enough, the interaction between lanes moving oppositely triggers instability and finally results in congestion.

Fig.5 (Color online) Flow patterns for bidirectional flow at typical densities
Figure 5 shows the spatial distributions of pedestrians with typical densities.As is shown in Fig.5(a), it is the free flow state.The lane formation was observed and usually three or more lanes formed.In the medium density range, the stable lane formation was observed as well, see Fig.5(b).In most cases,three lanes formed spontaneously.Pedestrians walk more efficiently than the unidirectional case.In the high density range, the phase separation was found that pedestrians in the same direction move in groups.However, the gap between two lanes in the same direction is so narrow that the group of pedestrians in opposite direction are difficult to pass through such a bottleneck, see Fig.5(c).The gap flow decreases with increasing density.When the density is large than 5.0 ped/m2, the gap flow ceases gradually.

Fig.6 (Color online) Snapshots for lane formation of bidirectional flow at different times ( ρ=3.3ped/m2)
Figure 6 shows the process of lane formation when2ρ=3.3ped/m.At the initial time, all pedestrians are distributed randomly in the channel (Fig.6(a)), and then the nearby pedestrians in the same direction begin to form clusters quickly (Fig.6(b)).Soon the interconnected group of pedestrians in the same direction appears and the phase transition is observed (Fig.6(c)).Finally, stable lanes are dynamically formed in which all pedestrians move in the same direction (Fig.6(d)).It should be noted that the whole process of lane formation is quite quick which coincides with real pedestrian traffic, e.g.,pedestrians move from both sides of a street during the green signal period and form lanes on the crosswalk instantly.
2.3 Flow patterns in different scenarios
Typical self-organization phenomena of pedestrians emerge spontaneously which have attracted more attention from researchers in various fields[1,3].In the following we show some simulation results in different scenarios and only discuss the qualitative properties.

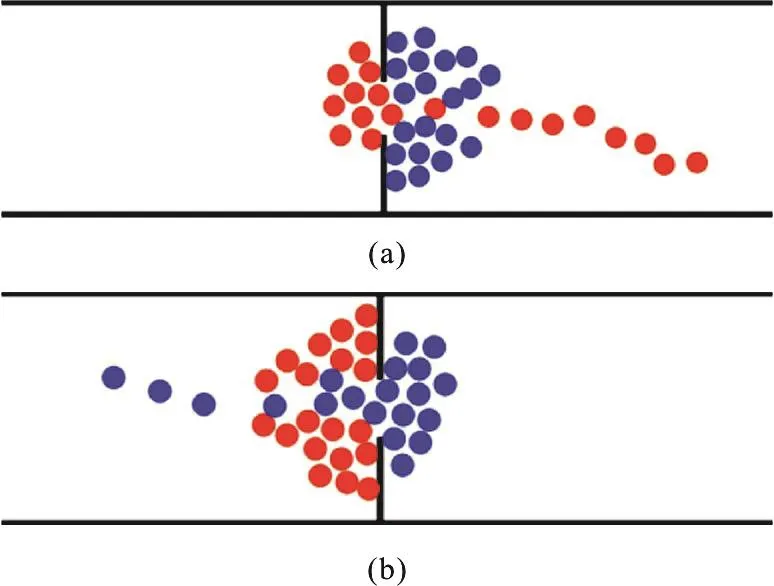
Fig.7 (Color online) Trajectories of two groups of pedestrians passing a wide bottleneck in opposite directions
The first scenario is that bidirectional pedestrian flows pass through a wide bottleneck.Initially pedestrians are distributed randomly in the square area of both sides of the channel.The number of pedestrians inside is not enough to cause congestion near the bottleneck.Figure 7 shows the trajectories of pedestrians when they pass the bottleneck.It was found that pedestrians from both sides separate from each other and pass the bottleneck orderly.

Fig.8 (Color online) Oscillating flows at narrow bottlenecks

Fig.9 (Color online) Clogging near the exit of a room
The second scenario is that bidirectional pedest-rian flows pass through a narrow bottleneck.Figure 8 shows the oscillations of counterflow at a bottleneck.The oscillatory changes of the direction of motion of pedestrian flow were observed.The switch of direction is irregular and sometimes the bottleneck flow is intermittent.
The third scenario is that pedestrians evacuate from a room with a single exit, as shown in Fig.9.When the inflow exceeds the capacity of exit, the clogging occurs near the exit where high-density pedestrians gather in the upstream of bottleneck.The outflow may be blocked temporarily due to the presence of arching at the exit.
3.Conclusion
In this paper, we have used an extended social force model to investigate fundamental diagrams for both uni- and bidirectional flow in a channel.The fundamental diagrams were obtained numerically under periodic boundary conditions.By comparison,the measured data for both cases were used together with the results of Weidmannʼs formula.It was found that the fundamental diagram shows good agreement with Mōriʼs data in the unidirectional flow, especially in the medium density range.However, the fundamental diagram for bidirectional flow gives larger values than Olderʼs data.Furthermore, the bidirectional flux is larger than the unidirectional flux in a certain density range.It is indicated that the bidirectional flow may be more efficient than the unidirectional flow in some cases.The most predominant flow pattern is still lane formation of pedestrian counterflow in the channel.The process of lane formation is quite quick in the extended SF model.Typical flow patterns in different scenarios were given to show some realistic applications.It is believed that the extended SF model can provide reliable simulation results of pedestrian flow,especially in complex situations.
- 水动力学研究与进展 B辑的其它文章
- Call For Papers The 3rd International Symposium of Cavitation and Multiphase Flow
- Improving the real-time probabilistic channel flood forecasting by incorporating the uncertainty of inflow using the particle filter *
- A selected review of vortex identification methods with applications *
- Tracer advection in an idealised river bend with groynes *
- Simulation of the overtaking maneuver between two ships using the non-linear maneuvering model *
- The effect of downstream resistance on flow diverter treatment of a cerebral aneurysm at a bifurcation: A joint computational-experimental study *

