A discrete model for prediction of radon flux from fractured rocks
K.M.Ajyi,K.Shhzi,P.Tukkrj,K.Ktzenstein
aDepartment of Mechanical Engineering,South Dakota School of Mines and Technology,Rapid City,SD,57701,USA
bDepartment of Mining Engineering and Management,South Dakota School of Mines and Technology,Rapid City,SD,57701,USA
cDepartment of Geology and Geological Engineering,South Dakota School of Mines and Technology,Rapid City,SD,57701,USA
Keywords:Radon mass flux Radon dimensionless flux Stochastic model Discrete fracture network(DFN)Caving mining method Fractured rocks
A B S T R A C T Prediction of radon flux from the fractured zone of a propagating cave mine is basically associated with uncertainty and complexity.For instance,there is restricted access to these zones for field measurements,and it is quite difficult to replicate the complex nature of both natural and induced fractures in these zones in laboratory studies.Hence,a technique for predicting radon flux from a fractured rock using a discrete fracture network(DFN)model is developed to address these difficulties.This model quantifies the contribution of fractures to the total radon flux,and estimates the fracture density from a measured radon flux considering the effects of advection,diffusion,as well as radon generation and decay.Radon generation and decay are classified as reaction processes.Therefore,the equation solved is termed as the advection-diffusion-reaction equation(ADRE).Peclet number(Pe),a conventional dimensionless parameter that indicates the ratio of mass transport by advection to diffusion,is used to classify the transport regimes.The results show that the proposed model effectively predicts radon flux from a fractured rock.An increase in fracture density for a rock sample with uniformly distributed radon generation rate can elevate radon flux significantly compared with another rock sample with an equivalent increase in radon generation rate.In addition to Pe,two other independent dimensionless parameters(derived for radon transport through fractures)significantly affect radon dimensionless flux.Findings provide insight into radon transport through fractured rocks and can be used to improve radon control measures for proactive mitigation.
1.Introduction
Radon gas is a major source of ionizing radiation(Nadakavukaren,2011),emitting harmful radioactivity during its decay(McPherson,1993).The Health Protection Agency(HPA)estimates that about 1100radon-induced lung cancer deaths occur every year in UK(HPA,2009),and the Environmental Protection Agency(EPA)estimates that about 21,000 radon-related lung cancer deaths occur each year in the US(US EPA,2017).These problems are more severe around uranium-rich rocks(El-Fawal,2011),because radon is a disintegration product from uranium(Barakos et al.,2014),known to be abundant in rare-earth minerals(Abumurad and Al-Tamimi,2001).In addition,certain mining methods such as caving mining,which involves inducing fracturing of rock(McNearny and Abel,1993;Li et al.,2014),increases rock’s surface area and creates pathways for radon gas to migrate within the rock mass.This makes prediction of radon flux more complex in the caving mining of uranium-rich rocks.
Radon(discharged by radium-bearing molecules)migrates within the rock mass(Ferry et al.,2002)by diffusion and/or advection through pores,macro-pores,and fractures(Nazaroff and Nero,1988;Ferry et al.,2002),and eventually emanates into the atmosphere.In a steady flow situation in a rock mass,fractures transport 99.99%of the total vertical mass flow through the composite medium(Nilson et al.,1991).Therefore,fractures contribute significantly to radon transport(Schery et al.,1982;Holford et al.,1993;Rowberry et al.,2016)and to proactively mitigating human exposure to radon.In this sense,knowledge of radon flux is required.At present,there are a few traditional approaches for predicting radon flux,but they are not relevant in all cases.One approach is the direct measurement of radon flux in houses and mines(Lario et al.,2005;Kitto,2014;Ongori et al.,2015).For this approach,Lario et al.(2005)concluded that only uninterrupted short-term monitoring can represent radon concentration over an extended period.However,this approach is not relevant for rocks with access constraints,such as cave mines.Another approach used is laboratory investigation.Sahu et al.(2013)conducted a laboratory test of radon emanation rate from a low-grade uranium ore sample and found that in situ radon emanation rate is about 3 times higher than that measured in the laboratory.This disparity is attributed to the massive size and degree of fracturing in in situ orebodies(Bochiolo et al.,2012;Sahu et al.,2013),which is difficult to be replicated in laboratory studies.These challenges limit the application of these techniques.Hence,a non-traditional strategy is required to predictrad on flux forlarge-scale underground excavations.
We developed an approach for predicting radon flux from fractured rocks,a discrete fracture network(DFN)model that can predict radon transport through fractures considering diffusion,advection,and radon generation with radon decay.We assumed that radon flux at the rock’s surface is due to the transport by advection and diffusion(Catalano et al.,2015)through the fractures.Multiple studies predict that advection dominates radon transport(Nilson et al.,1991;Rowberry et al.,2016)(diffusion can be ignored);however,within the range of radon diffusion length(2.18 m)(Thompkins,1982)and for rocks with low permeability,both are important(Bear et al.,1993;Mosley et al.,1996).The influence of diffusion transport is limited by its short halflife(3.83 d),but advection transport through structural discontinuities can cover about 100 m length more than diffusion(Appleton,2013).
We solved the advection-diffusion-reaction equation(ADRE),where radon generation and decay are classified as reaction processes.This requires the knowledge of advection velocity(u)and we used three different methods to compute u.The technique developed in this study applies to fractured rock and specifically to instances such as a propagating cave mine,where the yield,seismogenic,and elastic zones(Board and Pierce,2009;Sainsbury,2010) (characterized by both natural and induced fractures)are inaccessible for field measurements.
2.Research approach
2.1.Radon flux
2.1.1.Radon flux from a rock mass
Advection and diffusion are the major transport mechanisms for a rock mass(Cigna,2005;Prasad et al.,2012;Ye et al.,2014;Catalano et al.,2015).Therefore,radon flux(J)is obtained by summing the flux due to advection and diffusion.The flux due to diffusion(Jdiff)is derived using Fick’s first law of diffusion:

and the flux due to advection(Jadv)is obtained(Garges and Baehr,1998)using

where D is the radon’s coefficient of molecular diffusion(m2/s),c is the radon concentration(Bq/m3),z is the fracture axis,and u is the advection velocity(m/s).
2.1.2.Radon concentration for a single fracture
Radon concentration(c),required for Eqs.(1)and(2),is obtained from radon transport equation(Bates and Edwards,1980;Bear et al.,1993;Mosley et al.,1996):

whereλis the decay constant(s-1),t is the time(s),V is the fluid velocity(m/s),and q is the radon generation rate(Bq/(m3s)).For fractures in the rock mass,q is the radonflux fromthe fracture walls per unit aperture and is assumed to be uniform.Assuming a steady,incompressible and one-dimensional transport of radon along the fracture axis(z),Eq.(3)is reduced(Iakovleva and Ryzhakova,2003;Xie et al.,2012;Zhang et al.,2014)to

Eq.(4)is non-dimensionalized by using c*=c/c∞andz*=z/L,where L is the characteristic length of the DFN size,and c∞is the reference concentration.Then we have

The three dimensionless parameters identified from Eq.(5)are
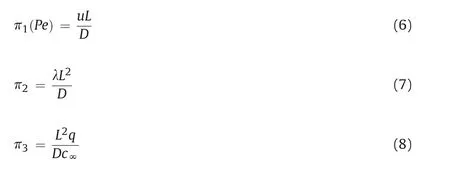
whereπ1is the Peclet number(Pe),a parameter that relates the effectiveness of mass transport by advection to dispersion or diffusion(Fetter,1993).It is used for classifying transport regimes(Garges and Baehr,1998;Huysmans and Dassargues,2005;Haddad et al.,2012;Chattopadhyay and Pandit,2015;Yadav et al.,2016),and also as a stability measure in numerical analysis(Ewing and Wang,2001).Forπ1< 1,diffusion governs transport,and advection is negligible(Huysmans and Dassargues,2005).For numerical or analytical studies,knowledge of the dominant transport mechanism helps to eliminate a hyperbolic term related to advection or parabolic terms related with diffusion.
Using boundary conditions

for a fracture with length of L,the solution to Eq.(4)is obtained as

For clarity on the boundary conditions,Fig.1 shows a schematic of a fractured rock with an arbitrarily located single fracture with the length of L,along the fracture axis(z).In this case,either end of the fracture can be coor cL.If the flux is negative,then the transport direction is opposite to the assigned direction.
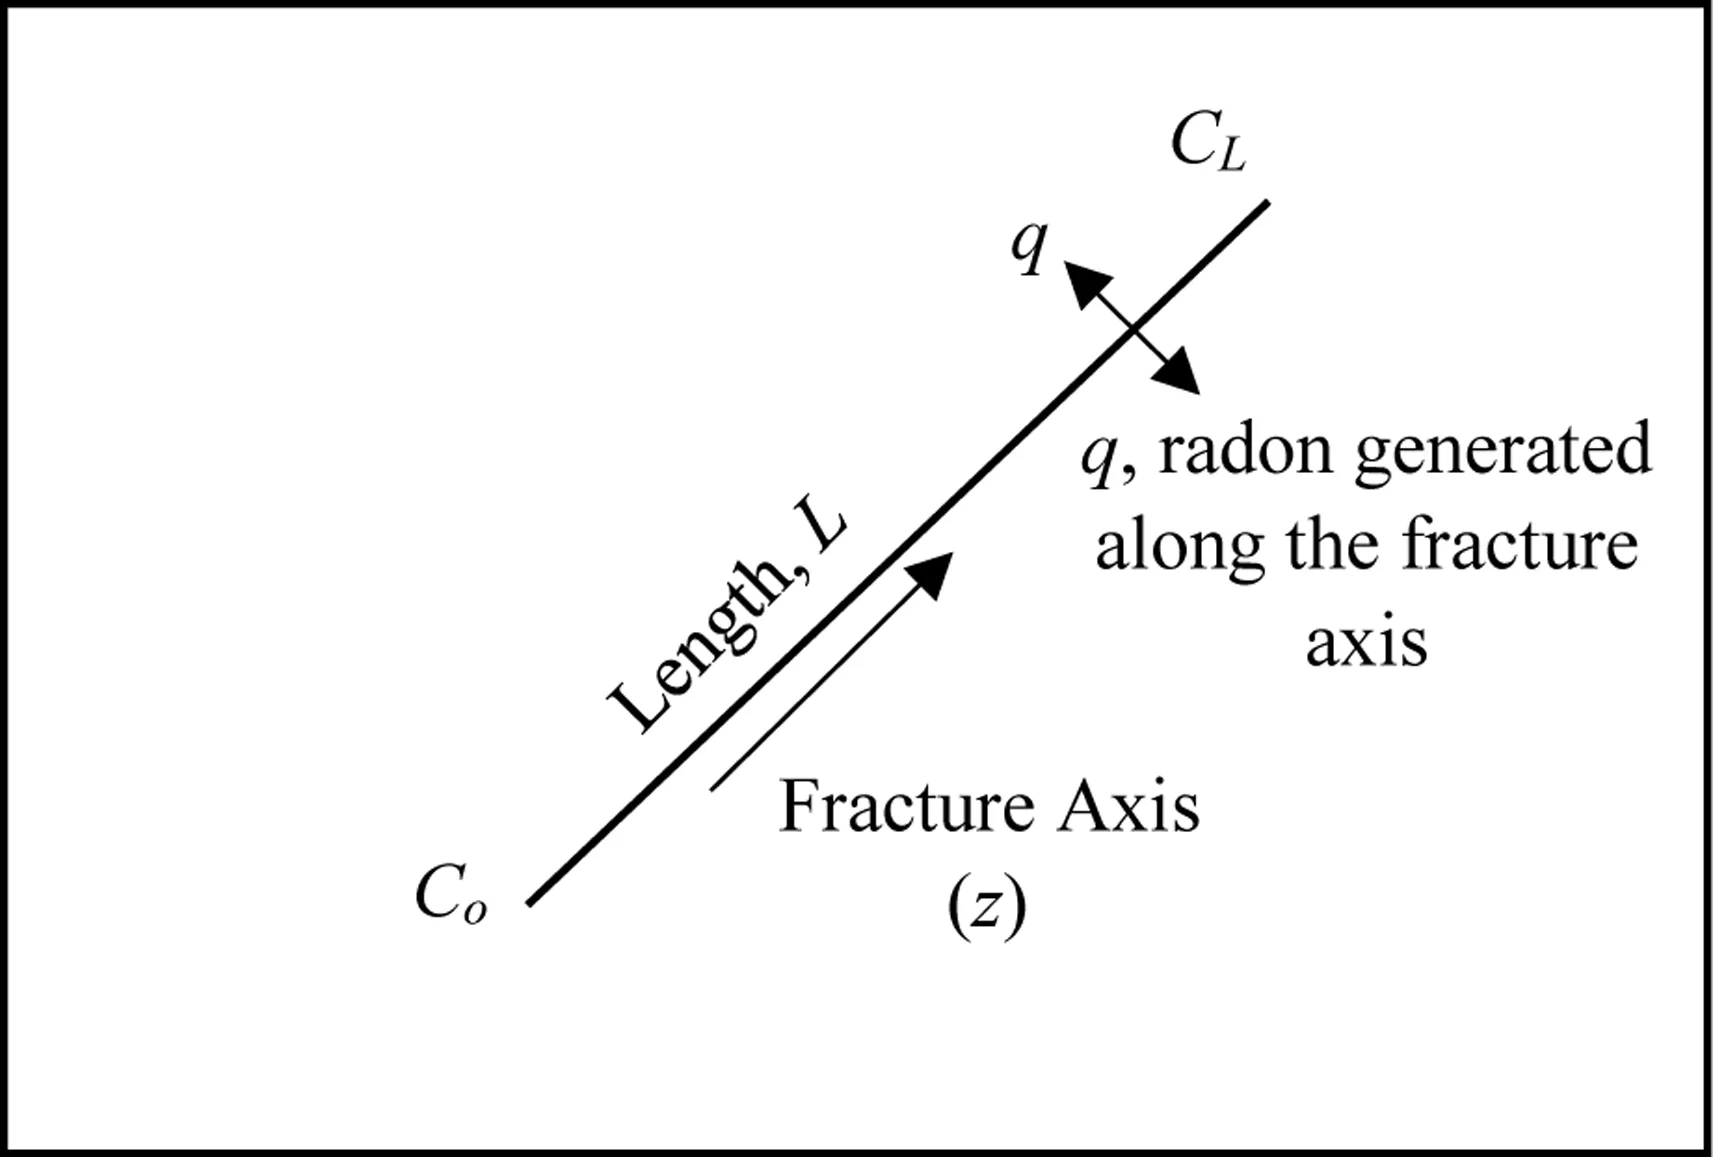
Fig.1.Schematic of an arbitrarily located fracture within a rock domain.
2.1.3.Radon flux and dimensionless flux from a single fracture
Eq.(11)is included in Eqs.(1)and(2)to obtain the flux due to diffusion and advection at any point z as


The total radon flux(J)at the end of a single fracture with length of L(Fig.1)is obtained by summing(Andersen,2001;Catalano et al.,2015)Eqs.(12)and(13)at z=L:
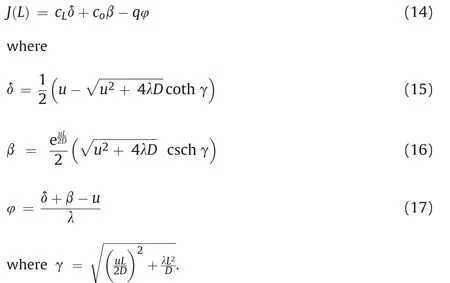
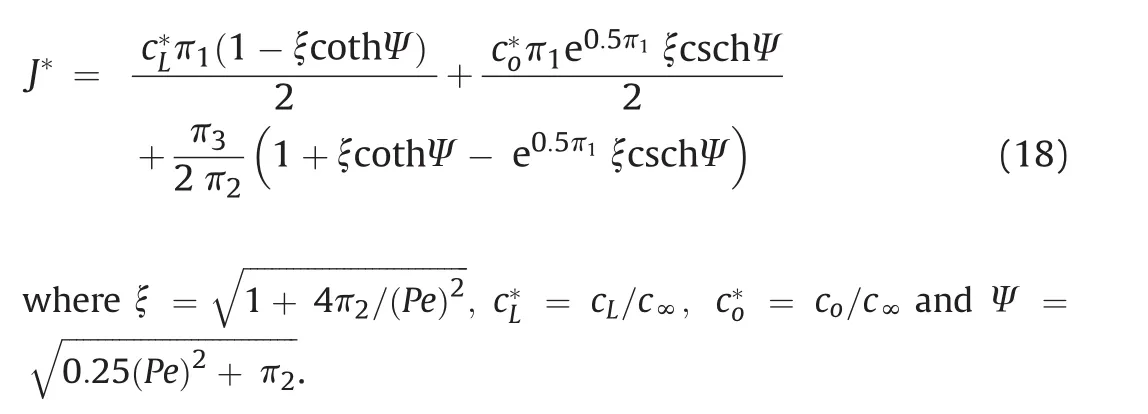
The dimensionless mass flux,J*,is obtained by dividing Eq.(14)with the diffusion flux(Dc∞/L):
2.1.4.Radon flux from a fracture network
Eq.(14)estimates radon flux from a single fracture;however,for a fracture network as shown in Fig.2,the internal node concentrations are unknown(nodes 4 and 5),but specific values can be assigned to the boundary concentrations(nodes 1,2 and 3).
Assuming that the boundary concentrations are known,the internal node concentration can be calculated using radon mass balance at each of the internal node:

where n is the total number of nodes connected to a particular internal node,and j and i are the connecting nodes.
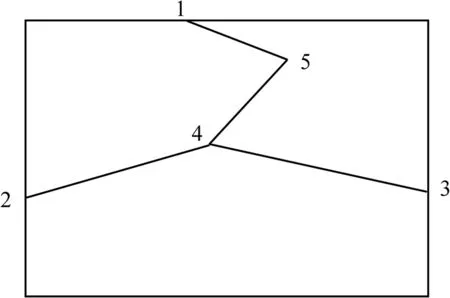
Fig.2.Schematic of a typical fracture network.
For example,after applying Eq.(19)to nodes 4 and 5 in Fig.2,we have

A linear set of equation is obtained as

Therefore,based on the number of internal nodes,say m,m number of equations that combines in the form of

where A is the coefficient of the unknown internal node concentrations,B is the radon generation rate coefficient obtained mainly from the known boundary concentrations,and X is a matrix of the unknown internal node concentration.For a typical dense fracture network,a matrix system as large as 1200×1200 can be obtained,with each row of the matrix representing the application of Eq.(19)to the internal node.Due to the size of the system of equation,we solved for the internal node concentration in MATLAB using the‘mldivide’function.
2.1.5.Radon boundary flux
Fig.3shows the radon fluxes obtained based on the boundary gradients applied independently in two directions.Jxxand Jyxare the principal flux in the x direction and cross flux in the y direction,respectively;while Jyyand Jxyare the principal flux in the y direction and cross flux in the x direction,respectively.Unlike Fig.2,in a typical fracture network,several fractures connect to the boundaries,and the total boundary flux is calculated as

where N is the total number of fractures connecting to the particular boundary,Aiis the area of the specific fracture i(m2),Jiis the corresponding flux(Bq/(m2s)),and Abis the boundary area(m2)(boundary length at a unit distance normal to the plane of flow(Priest,2012a)).Aidepends on the aperture size,which affects flow and fluid transport(Nick et al.,2011).In a stochastic DFN model,the aperture sizes could be predicted by using the power-law distribution(De Dreuzy et al.,2001),assuming constant aperture(Min et al.,2004;Lei et al.,2014),and/or scaling the fracture aperture with length(Bonnet et al.,2001;Olson,2003;Baghbanan and Jing,2007;Klimczak et al.,2010;Bang et al.,2012).For most of the sections in this study,the aperture and length are correlated using(Klimczak et al.,2010):

where davgis the hydraulic aperture(m),KICis the fracture toughness (MPa m1/2), αfis the proportionality coefficient considered as 0.0007 m1/2(Klimczak et al.,2010),νis the Poisson’s ratio,Ltis the length of the fractures(m),and E is the Young’s modulus(MPa).This correlation is applicable to opening-mode fractures with constant fracture toughness(Klimczak et al.,2010).
It should be noted thatαfis a site-specific value and Eq.(25)is applicable when the rock is able to resist further fracturing.Therefore,in case of continuous fracturing,the driving stress is required to predict the fracture aperture.In this case,the hydraulic aperture can be predicted from(Pollard 1987;Olson,2003):

where ΔσIis the driving stress calculated from the normal stress and fluid pressure within the rock mass(MPa).Bisdom et al.(2016)calculated the driving stress based on the normal stress assuming constant fluid pressure as

whereσ1is the maximum horizontal stress(assumed to be 30 MPa),σ3is the minimum horizontal stress(assumed to be 10 MPa),andβ is the angle between fractures and direction ofσ1.This can increase the computational complexity;therefore,for most of this study,we used Eq.(25)to obtain the aperture sizes assuming constant fracture toughness.For clarity,it will be specified when the stress model is used to predict the aperture size.
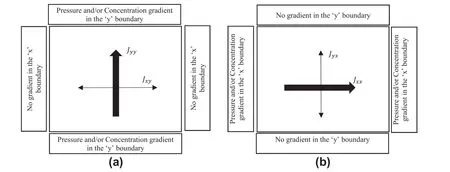
Fig.3.(a)Applying concentration and/or pressure gradient in the y direction to obtain principal flux in the y direction(Jyy)and cross flux in the x direction(Jxy);and(b)Applying concentration and/or pressure gradient in the x direction to obtain principal flux in the x direction(Jxx)and cross flux in the y direction(Jyx).
2.2.Advection velocity
As observed in Section 2.1.3,advection velocity(u)is a required parameter for computing the radon flux(see Eq.(14));three possible methods can be used to predict u.The first is by cubic law(Tsang,1992;Xu and Dowd,2010;Lee and Ni,2015):

whereΔH is the pressure head difference(m),L is the length of the fractures(m),b is the fracture aperture(m),ρis the density of air(kg/m3),g is the acceleration due to gravity(m/s2),andμis the dynamic viscosity of air(N s/m2).Since the internal pressure heads for the fractures are unknown,following cubic law is applied to estimate the pressure head at each of the internal nodes using the method suggested by Priest(Klimczak et al.,2010;Priest,2012a):

where Q is the volume flow rate(m3/s).Although this approach is often used(Kohl et al.,1994;Mosley et al.,1996;van der Pal et al.,2001;Chauhan and Kumar,2015;Datta,2017),there are limited applications to contaminant transport through a DFN,and this is one of the contributions of this study(see Section 3.2.1).Fig.4a shows a typical velocity distribution obtained from the cubic law model solving for air flow through a known DFN model(Priest,2012a).The second approach calculates advection velocity from Eq.(6)for a specified Peclet number(Pe)and obtains a uniform velocity for each fracture.The third method assumes uniform advection velocity from previous studies such as the advection/diffusion model proposed by Benoit et al.(1991).Air flow study through a rock pile at Nordhalde(former uranium mining site of Ronneburg)obtained a velocity of 2:3148×10-6m/s(Wels et al.,2003),while Nachshon et al.(2011)reported different advection velocities based on fracture aperture.Unlike the first approach,the second and third approaches assume uniform velocity distribution through the fracture network,as shown in Fig.4b.
2.3.Discrete fracture network(DFN)model
Characterization of all fractures from a rock sample is impractical(Andersson and Dverstorp,1987);therefore,a statistical approach is used.Previous studies considered stochastic DFN models in both two-and three-dimensional domains(Klimczak et al.,2010;Xu and Dowd,2010;Jafari and Babadagli,2012;Hymanet al.,2015;Liuet al.,2015;Ren et al.,2015),while some incorporated site data(Cacas et al.,1990;Min et al.,2004;Masihi et al.,2012;Dorn et al.,2013).In this study,a stochastic DFN model is developed for a two dimensional(2D)domain.The parameters required for the model are locations of the fracture center,fracture orientation,fracture sets,fracture length,and fracture density.This section describes the approach used to develop the DFN in MATLAB.
The center of the fractures is modeled with uniform distribution(Parashar and Reeves,2012;Priest,2012b),and the orientation of the fractures is modeled with von Mises-Fisher distribution(Best and Fisher,1979;Cacas et al.,1990;Parashar and Reeves,2012;Reeves et al.,2012).Two fracture sets oriented at 0°and 90°are considered with a maximum trend variation of 30°(Klimczak et al.,2010).Ltis modeled using a power-law distribution:

where Lminis the minimum length of fractures considered as 2 m(Klimczak et al.,2010),U is the uniform random variable that varies between 0 and 1,and a is the power law exponent assumed to be 2 with a corresponding fracture density(df)of 1:2 m/m2(Klimczak et al.,2010):

It is important to note that the model is very sensitive to the values of a.The length of the fractures generated decreases with increasing values of a.For example,a=1 generates very long fractures;a=2 generates a mix of short and long fractures;and a=3 generates short fractures.
The fracture network is generated for a 2D domain until the fracture density in Eq.(32)is satisfied.After generating fractures in a DFN domain,we develop the DFN backbone by eliminating the dead ends.Fig.5a shows a typical fracture network for a 40 m domain generated based on the method presented from MATLAB,and Fig.5b shows the corresponding DFN backbone.
2.4.Numerical simulation
Fig.5b is a typical example of the fracture network generated in this study.Fora complex system like this,it is quite difficult to solve for the internal node concentration(Eq.(23)).Therefore,we developed a MATLAB function to
(1)Generate the stochastic DFN(Fig.5a);
(2)Generate the DFN backbone(Fig.5b);
(3)Classify the nodes as internal and external;
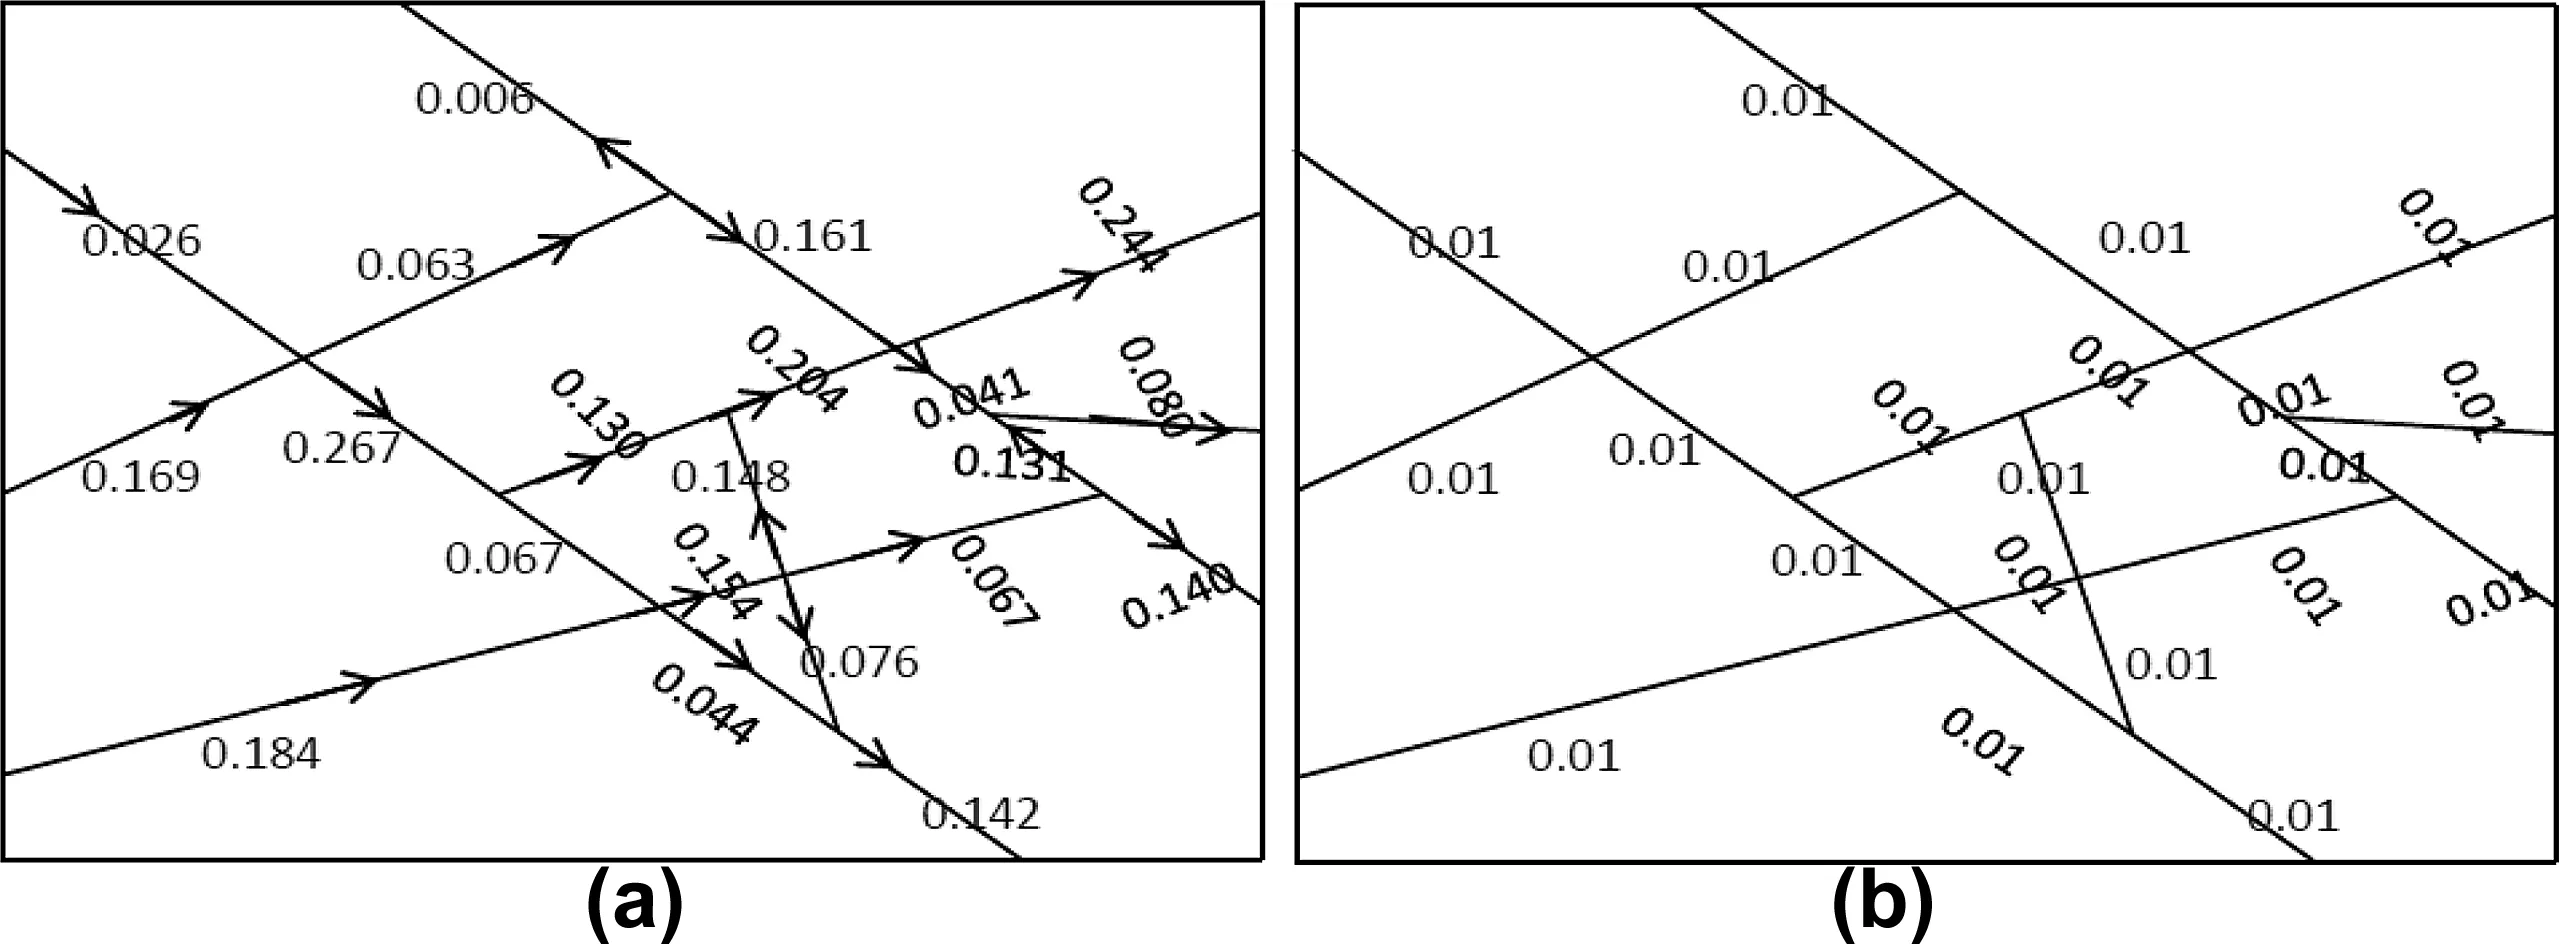
Fig.4.DFN model presented by Priest et al.(2012a):(a)Example of air flow velocity(mm/s)for individual fractures obtained from cubic law;and(b)Constant values of advection velocity(mm/s)obtained from Eq.(6)or data from literature.
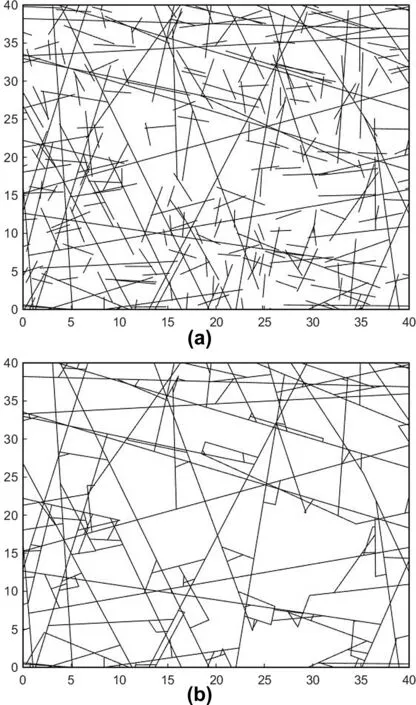
Fig.5.(a)DFN generated for a 40 m domain;and(b)Corresponding DFN backbone(after eliminating the dead ends in Fig.5a).
(4)Apply the boundary concentrations to the external nodes(Fig.3);
(5)Calculate individual fracture advection velocity(Section 2.2);
(6)Apply mass balance to all internal nodes(Eq.(19));
(7)Form the matrix and solve the internal node concentration;
(8)Estimate boundary flux for a 2D domain.
Repeat steps(1)-(8)for Monte Carlo 100 simulations for any condition simulated,and an ensemble average of the 100 Monte Carlo simulations is presented for each of the results in Sections 3.1-3.3.A uniform radon generation rate(q)of 4.36 Bq/(m3s)ismodeled using the fracture walls with a reference concentration c∞of 3,445,527 Bq/m3(Ye et al.,2014);radon diffusion coefficient(D)is modeled as 1.1×10⁻⁵m2/s(McPherson,1993)through the fractures;and the decay coefficient is modeled as2:1×10⁻⁶s-1.
2.5.Analytical model verification
A method for predicting the radon flux from fractured rocks using a DFN analysis is presented in this paper.However,due to the complexity of a typical DFN model(Fig.5b),it is rather difficult to verify these results.As a result,we solved the transport equations analytically for a DFN configuration with a single fracture to determine a valid range of values used as a benchmark for the complex DFN model.The DFN model consists of a single horizontal fracture that runs through the width of the DFN domain(Fig.6).Hence,the fracture length is equal to the domain length.
The minimum and maximum domain sizes considered are 2 m×2 m and 150m× 150m,respectively.Usingαf=0:0007 m1/2in Eq.(25),the minimum and maximum hydraulic apertures are 7:78×10-4m and 6:73×10-3m, respectively. We used q=4:36 Bq/(m3s) with a reference concentration of c=3,445,527 Bq/m3and c=141,116 Bq/m3(Ye et al.,2014).We analyzed the diffusion and advection models,independently.The diffusion flux is obtained by setting the velocity(u)to zero in Eq.(14)as

and the advection flux is obtained by the first eliminating diffusion in Eq.(3)as

By applying the boundary condition,c(0)=co,the concentration is obtain as

and the advection flux is obtained as

With the assumption of a constant radon generation rate,the only variable in the diffusion model(Eq.(33))is the fracture length.Therefore,Eq.(33)is used to solve different fracture lengths(equal to the size of the DFN domain)as shown in Fig.7a,b,using the minimum and maximum hydraulic apertures,respectively.The results show that diffusion flux decreases as the fracture length increases until about 40 m where the variation is minimized.This agrees with the previous knowledge of diffusion flux as we expect a decrease as the distance from the source increases(Eq.(1)).Based on Fig.7a,b,we have a range that can be used to verify the results from the complex DFN model.
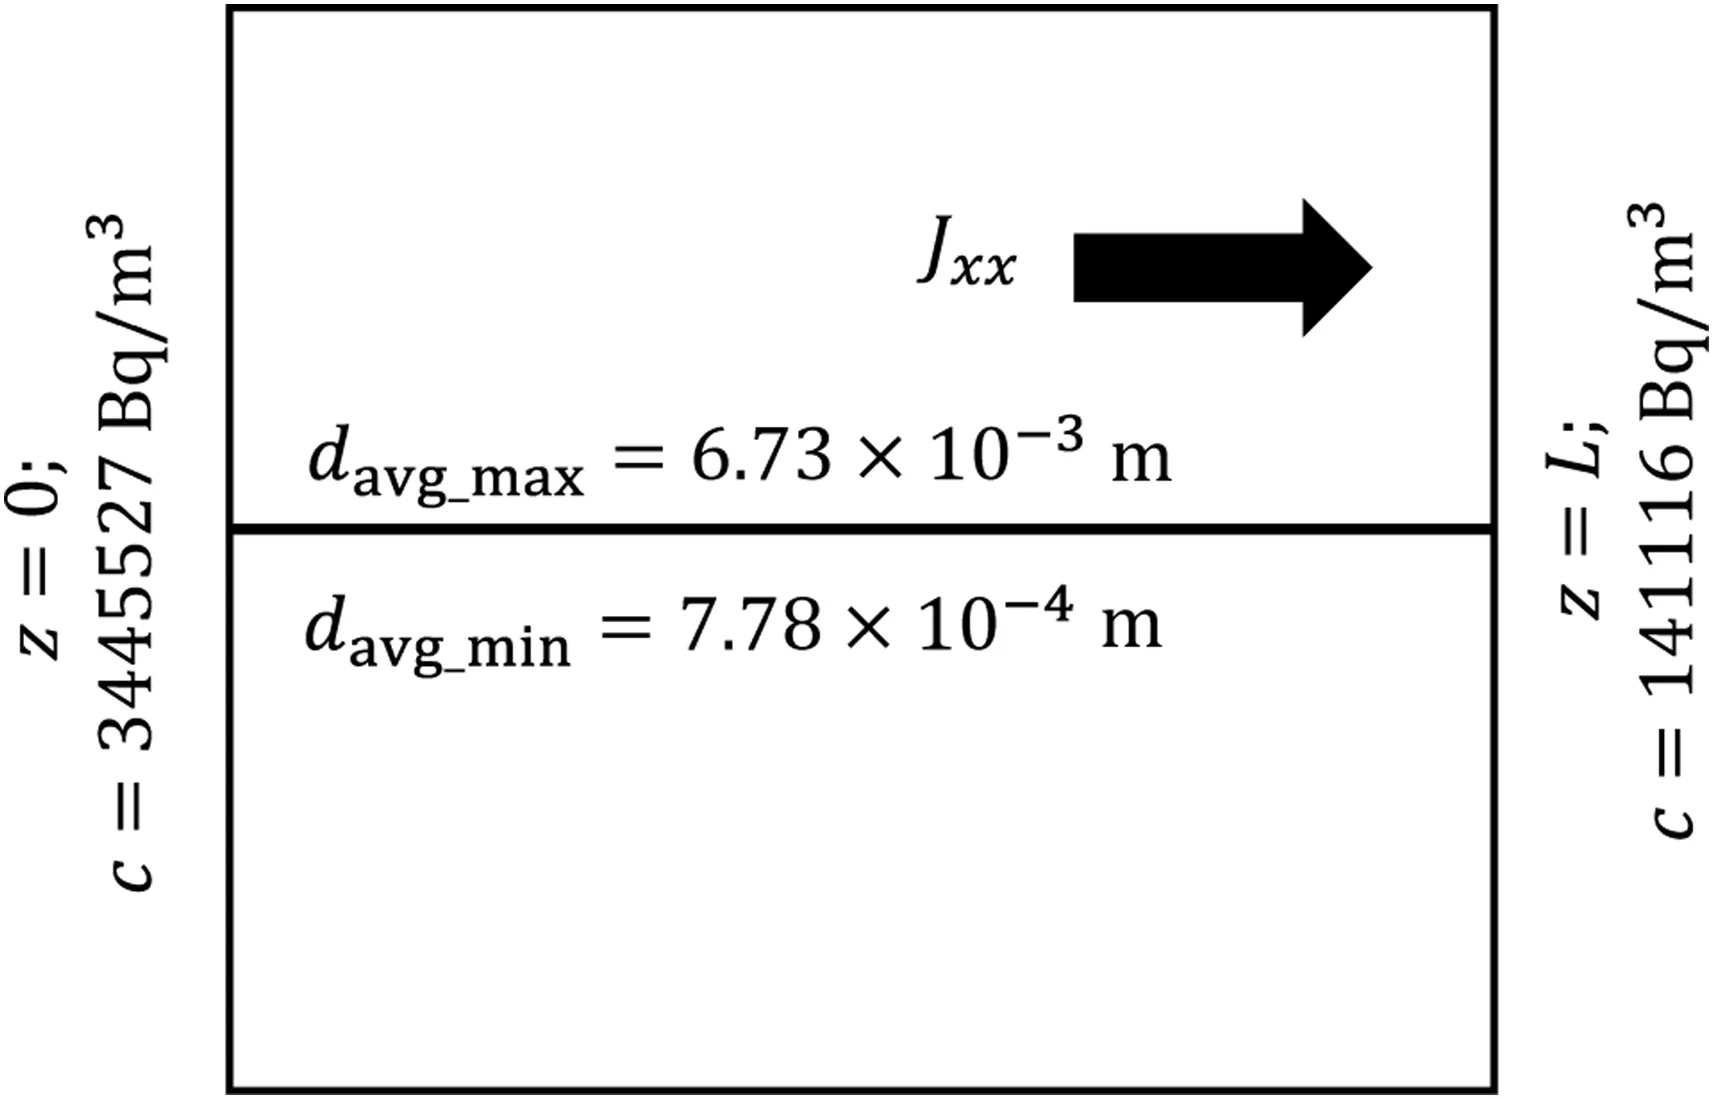
Fig.6.Model used for verification of DFN model results from MATLAB.
Eq.(36)predicts flux due to advection and has three variables as the fracture length,the advection velocity,and radon generation rate.Since a uniform radon generation rate is assumed,we studied the effects of advection velocity and fracture length on the advection flux using the maximum aperture size(6:73×10-3m).Therefore,for a fixed advection velocity(1×10⁻³m),the advection flux decreases with increase in fracture length to a minimum value(with slight variation beyond 40 m as shown in Fig.8a).However,for a fixed fracture length(e.g.2 m),Fig.8b shows that the advection flux increases with an increase in advection velocity.These results agree with the existing knowledge on contaminant transport,and will be used to verify the results obtained from the DFN model.
3.Results and discussion
This section presents our findings based on the characteristics of the transport equation.Unless otherwise stated,the advection velocity is determined from Eq.(6)for a fixed Peclet number.Section 3.1 presents the radon mass flux for different DFN domains;Section 3.2 presents the sensitivity of the radon flux model to the DFN and transport parameters;and Section 3.3 presents radon dimensionless flux for a single fracture and a DFN.
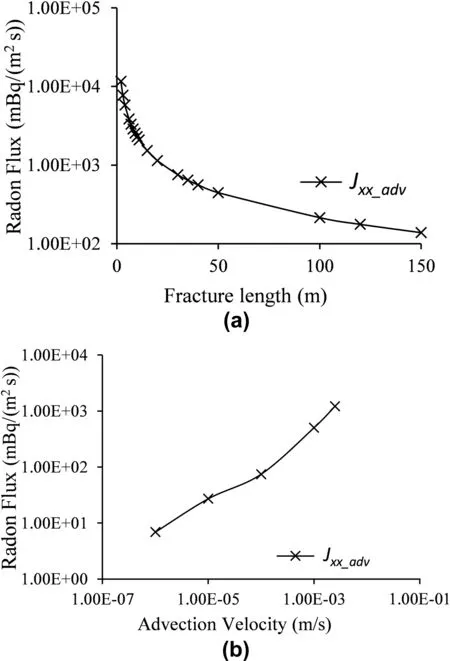
Fig.8.Jxx_advrepresents the principal advection flux in the x direction calculated with maximum aperture:(a)Effect of fracture length on radon advection flux;and(b)Radon advection flux(calculated using maximum aperture)with the advection velocity.
3.1.Radon mass flux from DFN
As discussed in the Introduction,we highlighted some challenges associated with existing methods of predicting radon flux,a parameter that is required for effective mitigation.Here,we compare the effectiveness of our proposed method with previous work.Then,we also use our approach to determine the influence of domain sizes on radon flux measurements.The radon flux from the ADRE in Eq.(14)is solved for different DFN domain sizes(for example,the 40 m DFN domain in Fig.5b)using zero advection velocity first(pure diffusion,Jyy_no_advin Fig.9),and then with velocity computed fromπ1=1(Jyy_diff_advin Fig.8a,equal effect of advection and diffusion).
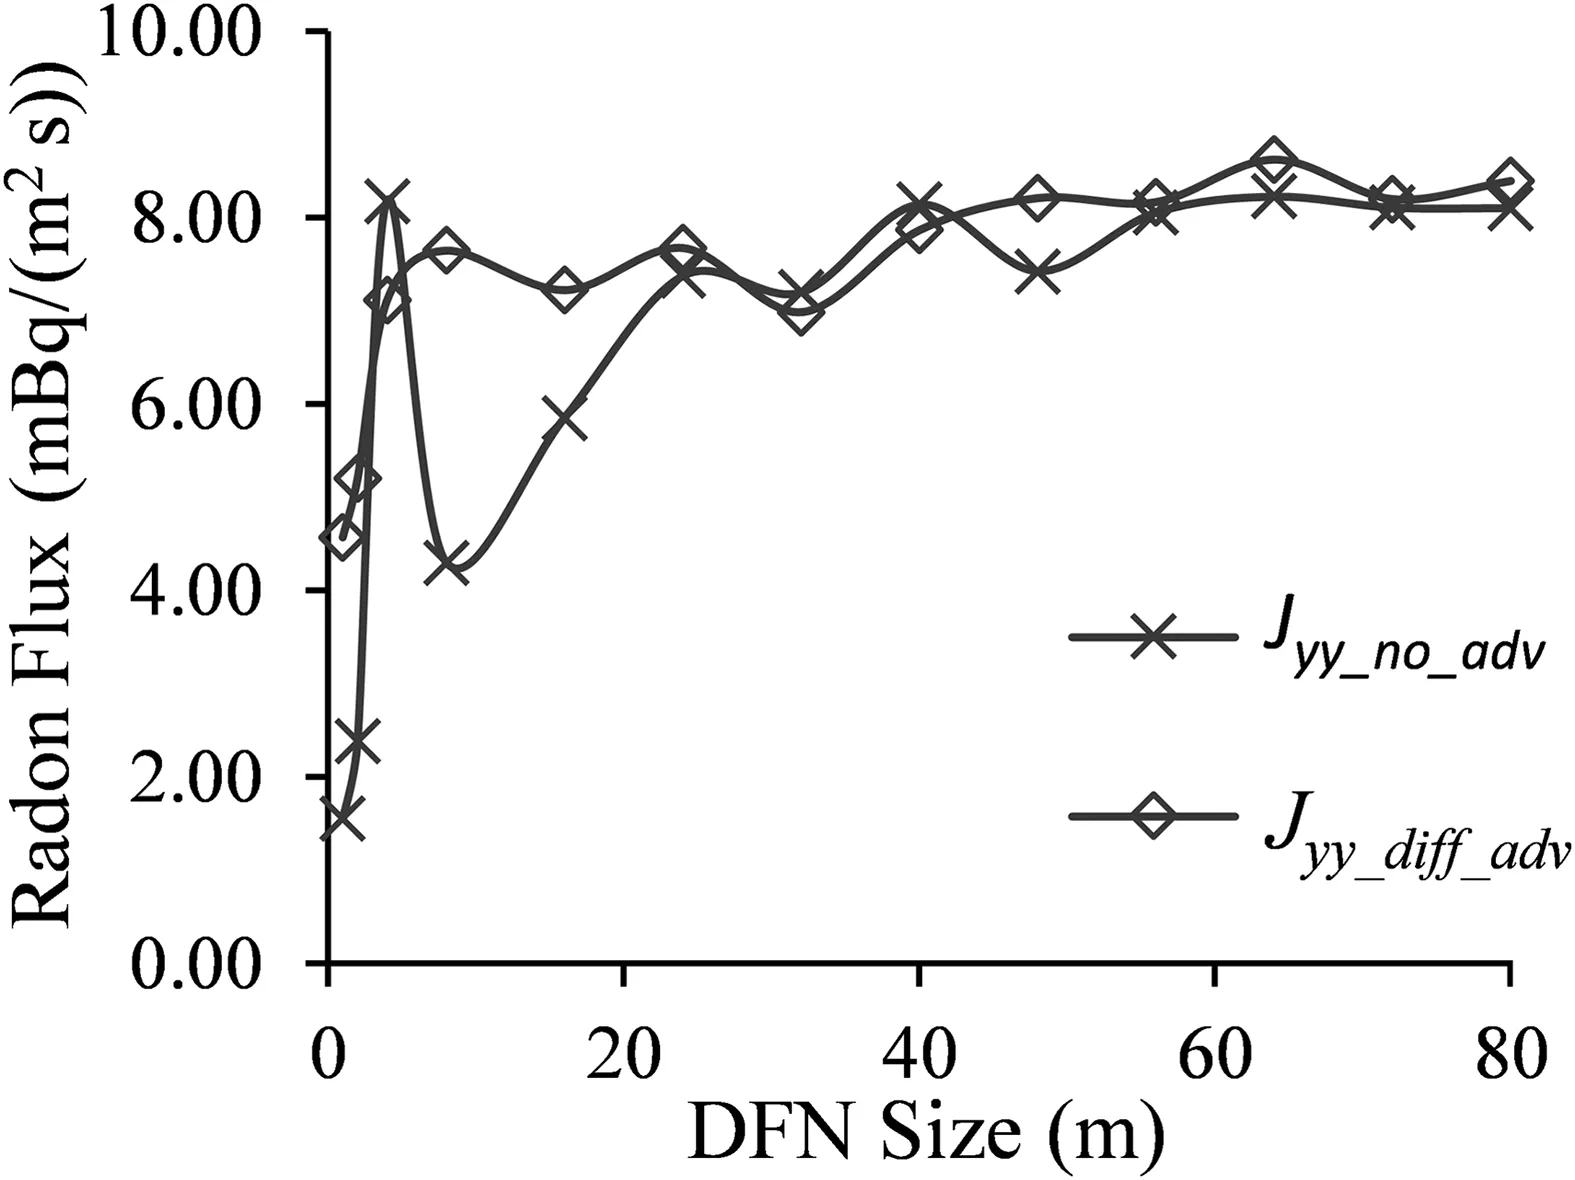
Fig.9.Radon flux for different DFN sizes:comparison of radon fluxes for pure diffusion(Jyy_no_adv,u=0 in Eq.(14))with radon flux from both advection and diffusion(u is obtained from Eq.(6)with π1=1,Jyy_diff_adv).
Fig.9 shows the results for both conditions using different DFN domains.We compared the results with the analytical model in Section 2.5,and observed that the range of values is similar to the analytical model,which is representative of values from previous studies(Singh et al.,1999;Sengupta et al.,2001;Mahur et al.,2008;Mudd,2008).After verifying the range of values,we analyzed the trend of results based on the influences of advection,diffusion and DFN size,which are some of the limitations in existing radon flux measurement approaches.For the diffusion model,radon flux increases as the size of the domain increases until about 8 m where it decreases.This can be attributed to the number of boundary fractures,and the diffusion length of radon.We understand that diffusion flux decreases with an increase in fracture length;however,as the DFN size increases,there is an increase in the number of boundary fractures(Fig.5b).Therefore,based on Eq.(24),as N increases,the overall boundary diffusion flux increases.However,at a DFN size of about 8 m,we observe a decrease in flux as the effect of diffusion length outweighs the number of boundary fractures.Beyond the 8 m DFN domain,the radon flux increases slightly due to the increase in number of boundary fractures(Fig.5b)until a 40 m DFN domain,where it is almost constant.At this point,even though the number of boundary fractures increases,the diffusion flux is significantly lower,and almost constant(Fig.7a).Hence,at about 40 m,we establish a representative result for the DFN model.
Furthermore,in Fig.9,the overall radon flux increases when both advection and diffusion are considered(Jyy_diff_adv),which is consistent with previous studies.Even though the effect of advection decreases with increasing fracture length,the increasing trend in the Jyy_diff_advplot is due to the increase in the number of boundary fractures,which increases with the DFN domain size.However,beyond 40 m,the flux remains almost constant,similar to the diffusion flux.In this sense,as the domain size increases,the average length of fractures in the domain increases,leading to a decrease in both diffusion and advection flux;however,the number of boundary fractures increases to maintain a constant flux.Recalling that the results presented in Fig.9 are an average of 100 Monte Carlo simulations for each of the DFN domains,Fig.10 shows the histogram of the range of radon flux magnitudes predicted for the 40 m DFN domain.We observe a few extreme values(more than double of the mean)as the model is right skewed.Since this model assumes a uniform advection velocity,the extreme values occur at very short fracture length around the DFN boundary due to the stochastic nature of a DFN.As presented in Figs.7 and 8,radon fluxes are significantly higher with short fracture lengths.Therefore,further analysis is required for quantifying the uncertainty related to the stochastic model.
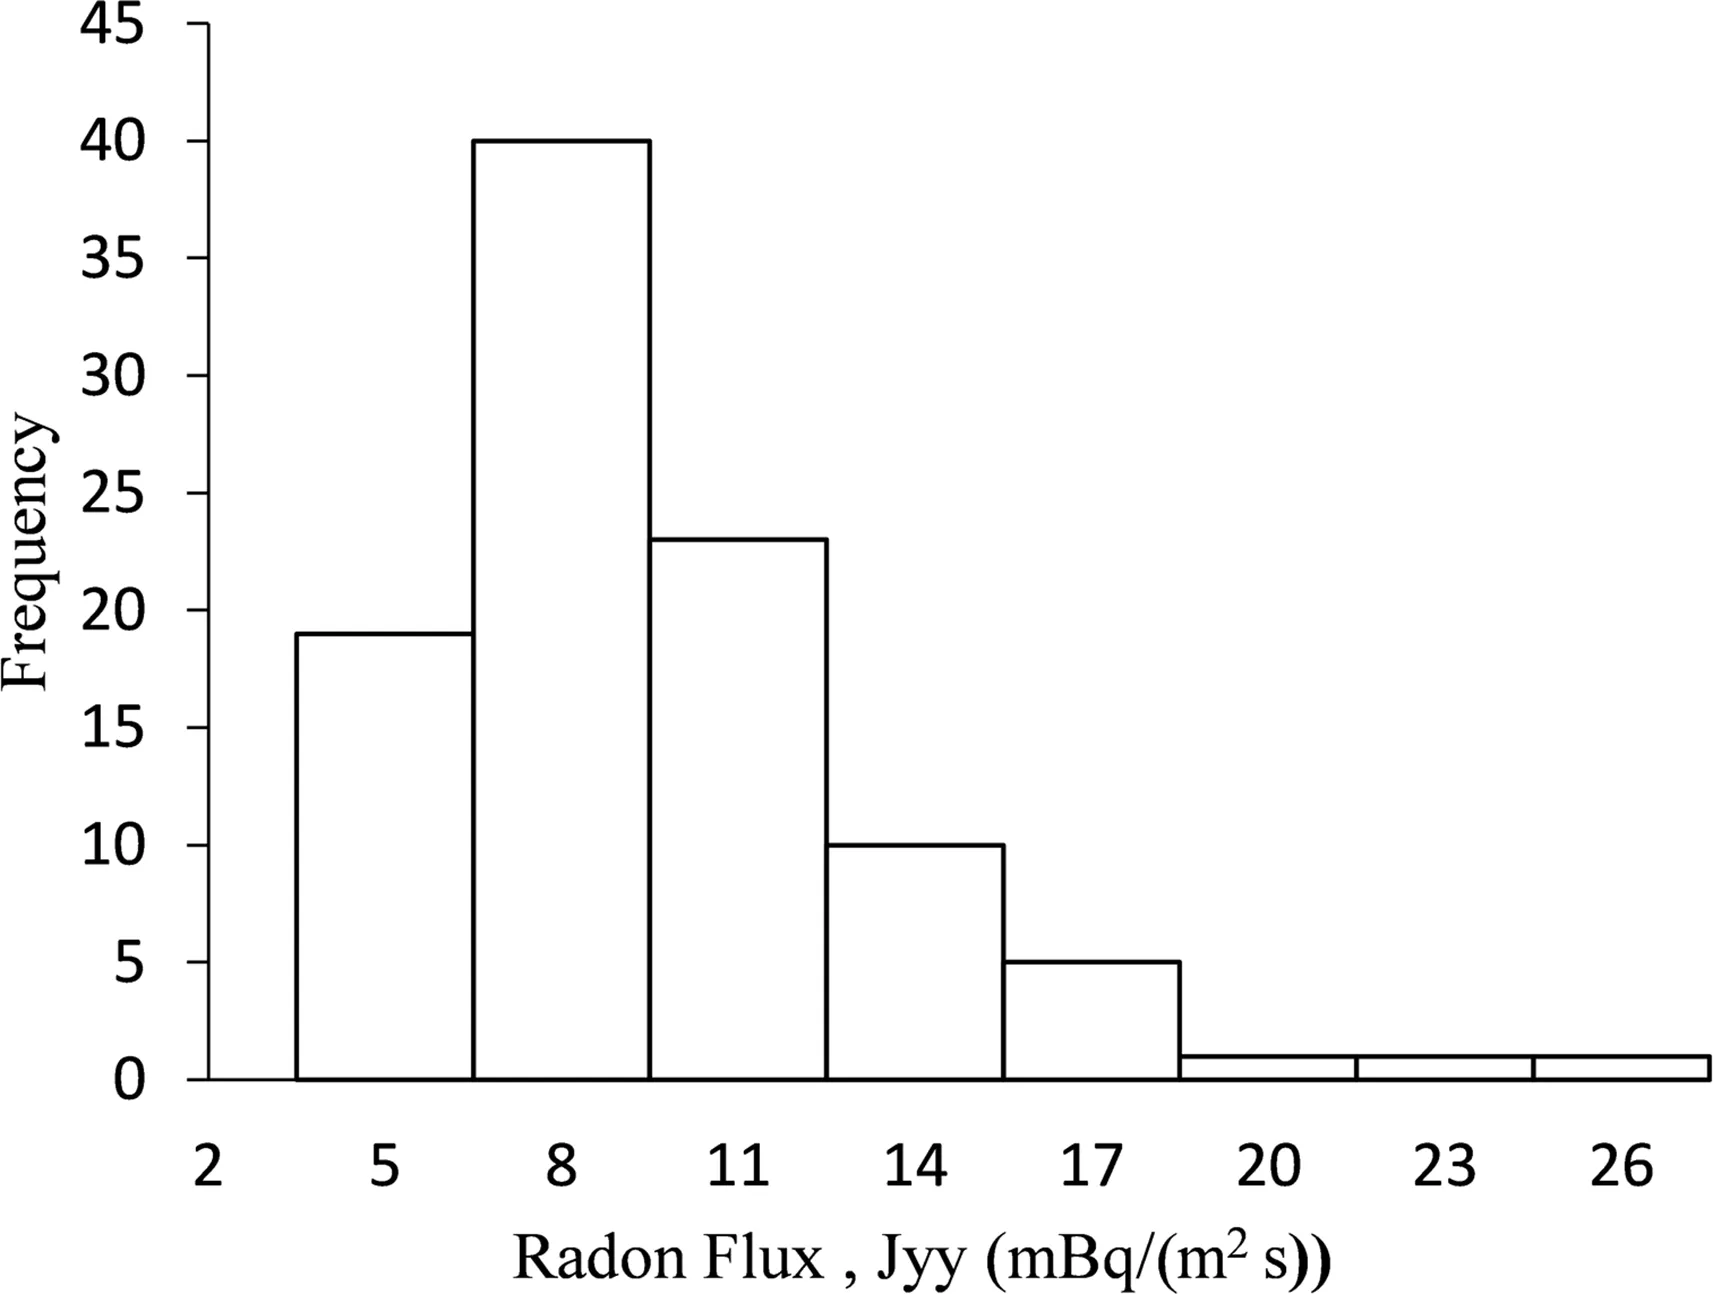
Fig.10.Histogram of 100 Monte Carlo simulation results of radon flux for a 40 m DFN domain.
In reality,the advection velocity might vary significantly based on the pressure gradient across the domain.Therefore,we studied the effect of advection velocity on a 40m DFN domain as shown in Fig.11.The results show that an increase in the advection velocity increases radon flux through the DFN,which facilitates radon transport through fractured rock and shows that,in case of high advection velocity,the flux due to advection is significantly higher(Nilson et al.,1991;Rowberry et al.,2016).Therefore,a significant pressure gradient through the fractured rock boundaries can increase the radon flux into the environment. For this, pressure balancing through the fractured rock boundary is suggested as one of the proactive measures for radon mitigation in cave mines.These results provide conclusive evidence that our method agrees with existing studies,and beyond this,it is able to predict radon flux for large domain(which is a limitation for laboratory studies),and provide more insight into the contribution of fractures to radon flux.
3.2.Sensitivity of result to model parameters
After presenting the results in Section 3.1,it is necessary to study the sensitivity of the result to the parameters in the DFN and transport models.Some of these parameters are advection velocity model(u),aperture model(davg),fracture density(df),and radon generation rate(q).
3.2.1.Effect of advection velocity model on radon flux
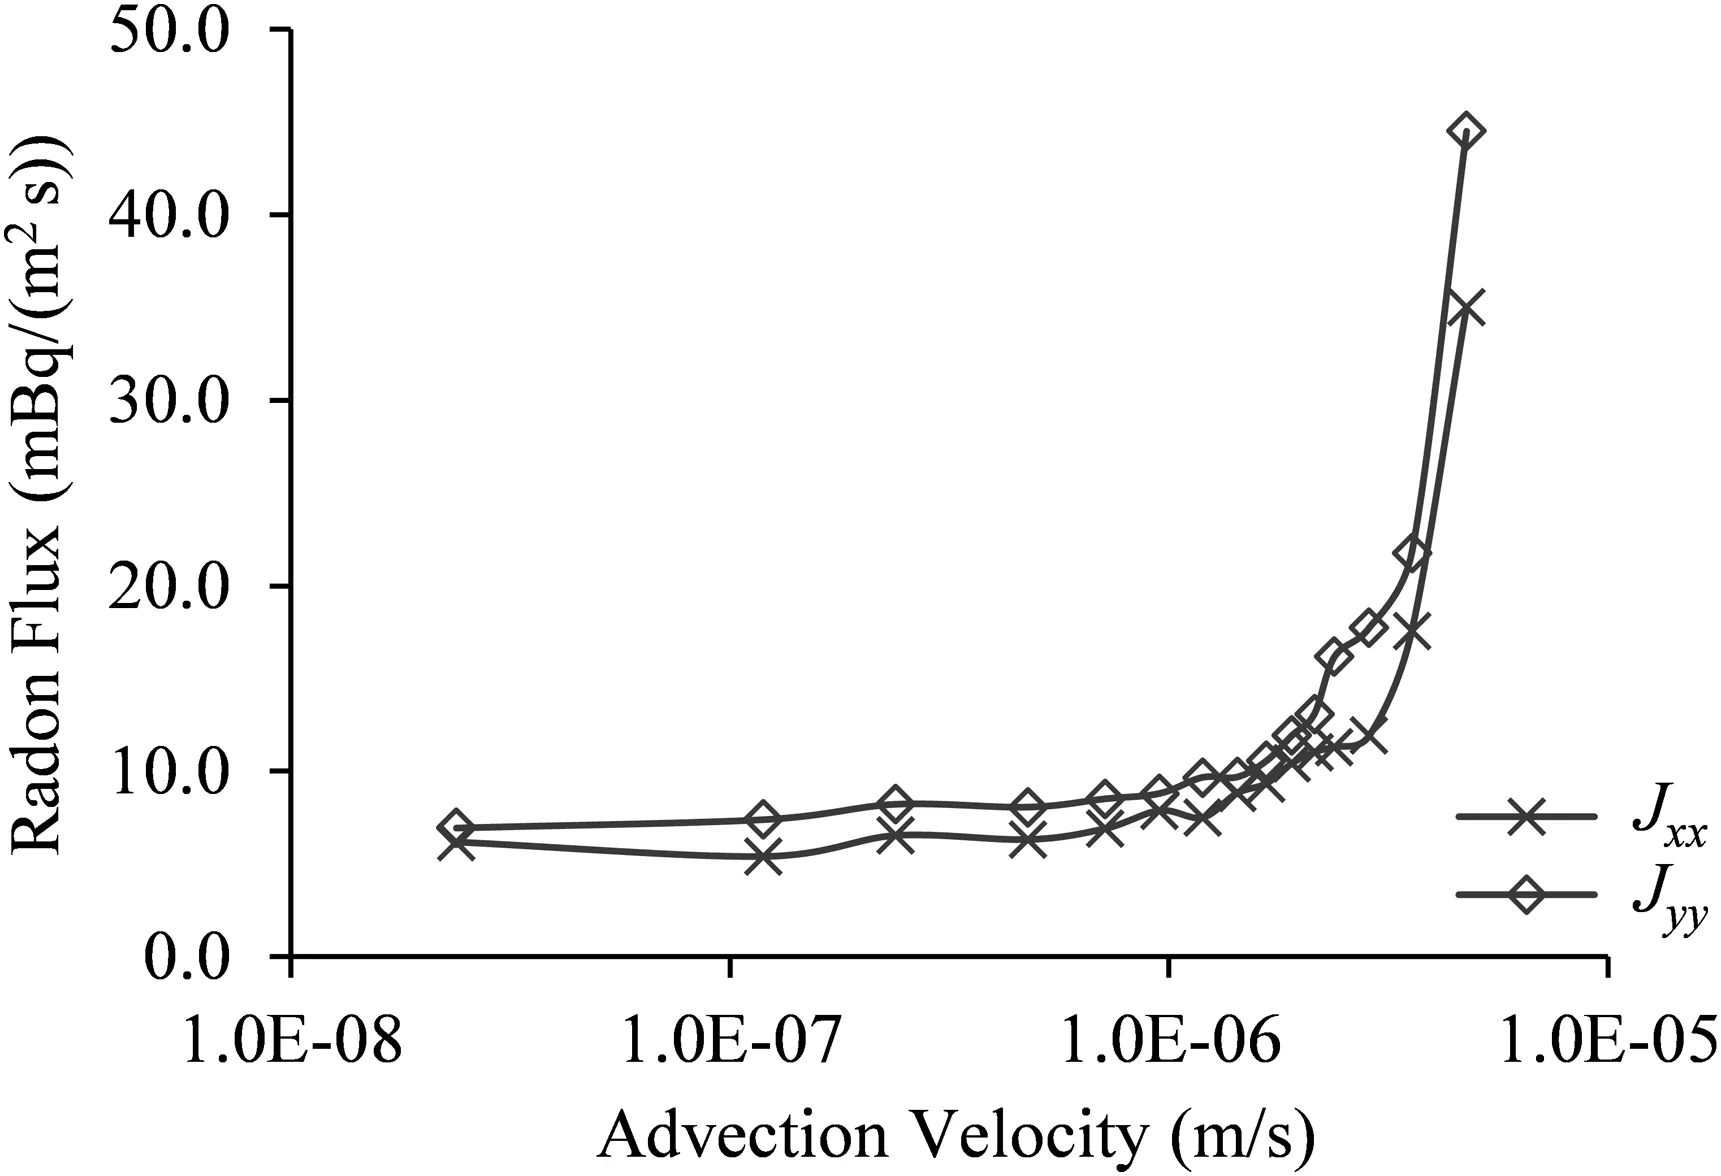
Fig.11.Plot of radon flux with advection velocity for a 40 m DFN size.
Section 2.2 explains three different techniques for modeling advection velocity,but the results presented in Section 3.1 are based on uniform advection velocity calculated from Eq.(6).Therefore,this section discusses the impact of different advection velocity models on the model results.First,we used the cubic law model from Eqs.(29)and(30)with a uniform aperture of 65μm(Min et al.,2004)(different advection velocities generated for each fracture similar to Fig.4a).Fig.12a shows the radon flux for different DFN domain sizes.This figure shows that radon flux decreases until the DFN domain reaches about 40 m,with a small variation to assume a representative result.Though the trend to establish a representative result is different in Section 3.1(Fig.9),both methods show an insignificant change in radon flux in DFN models larger than 40 m in size.The difference in trend is due to the approach used to model the pressure head in Eq.(29).We maintained a constant pressure head difference(ΔH)for all the DFN sizes,and this decreases the advection velocity(Eq.(29))as the domain size increases(which decreases the flux).Therefore,the model is sensitive to the advection velocity model implemented and the approach used.In addition,further investigation is needed to understand whether there might be differences in trend if the cubic law velocity model is implemented with a constant pressure head gradient(ΔH/L)for each of the DFN domains.
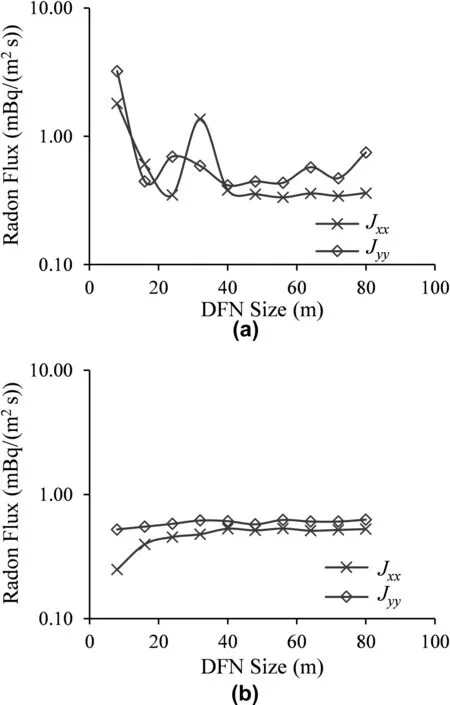
Fig.12.Radon flux for ADRE solution with different advection velocity models:(a)Plot of radon flux for different DFN sizes with advection velocity obtained from cubic law;and(b)Plot of radon flux for different DFN sizes with advection velocity obtained from literature(uniform velocity).
For further analysis,we used a uniform velocity of 0.2 m/d(2:315×10-6m/s)from the literature(Wels et al.,2003)as shown in Fig.12b.The result shows a smooth trend towards the establishment of a representative result at a DFN domain of about 40 m similar to the result obtained previously.Since the effect of advection is assumed constant for each of the DFN sizes(uniform advection velocity),the slight increasing trend is due to the effect of diffusion as illustrated in Fig.9.
3.2.2.Effect of aperture model on radon flux
Fracture aperture is a major source of uncertainty in fluid modeling(Bisdom et al.,2016)because small variation in the aperture has a significant effect on the flow modeling and contaminant transport properties(Nick et al.,2011).In the previous sections,we considered opening-mode fractures with a constant value of proportionality coefficient(αf)used to correlate the fracture trace length with aperture(Eqs.(25)and(26)).However,from Eq.(26),αfdepends on the rock’s properties such as Poison’s ratio and Young’s modulus,hence,it is site-specific.Klimczak et al.(2010)provided a summary of the proportionality coefficient for different sites,and three of these values are used to compare the variation in radon flux due to rock’s mechanical properties.Fig.13a compares the principal flux in the y direction,while Fig.13b compare the cross flux in the x direction for 100 Monte Carlo simulations.
The results show that increase in values ofαfelevates the radon flux within several orders of magnitude.Therefore,rock properties such as fracture toughness,Poisson’s ratio,and Young’s modulus have significant effects on the size of the fracture opening(aperture),which affects the radon flux.
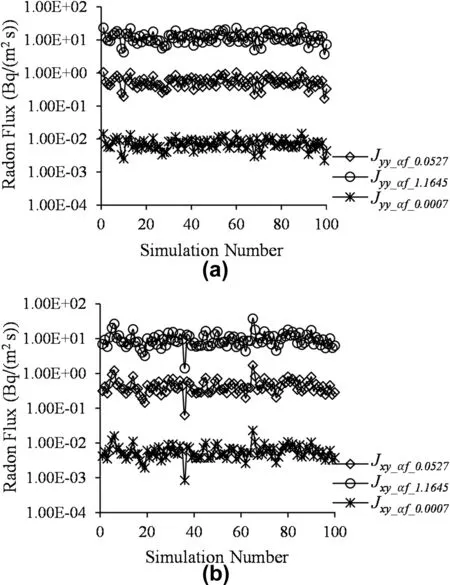
Fig.13.(a)Comparison of radon principal flux in y direction for different values ofαf;and(b)Comparison of radon cross flux in x direction for different values ofαf.The legend displays radon flux along with the proportionality coefficient(Jyy_αf_value);Jyy_αf_0.0527is the principal flux corresponding to αf=0.0527 m1/2and Jxy_αf_0.0527is the cross flux corresponding toαf=0.0527 m1/2.
In most cases,considering the impact of stress on the aperture size is more realistic(as described in Section 2.1.5 with Eqs.(27)and(28))than assuming a constant proportionality coefficient(αf).Here,we compared the stress boundary conditions described in Eq.(28)with a constant valueαf=0:0007 m1/2in Fig.14.The result indicates that the stress aperture model(using Eq.(27))shows more heterogeneity in the flux through the DFN compared to constant value of αf=0:0007 m1/2in Eq.(25)(the stress advection velocity model is able to replicate more realistic variation in the radon flux).Therefore,when rock properties such asαfare not available,or the constant fracture toughness assumption is not valid,the stress boundary condition can be used in the model.
3.2.3.Effect of fracture density
One of the major parameters required for the DFN model is the fracture density(df)described in Eq.(32).In this study,we used df=1:2 m/m2for a=2(Klimczak et al.,2010);however,sometimes the rock might havea higher fracture density.Therefore,we analyzed the sensitivity of the model to the changes in fracture density for a DFN domain size of 40 m with uniformly distributed radon source.Fig.15 shows the plot of radon flux with fracture density and an empirical relationship observed between both parameters.The model shows that about 10%increase in fracture densitycan increase the radon flux by about 15%due to the increase in porosity of the block,which creates more pathways for radon transport.Therefore,the model is very sensitive to the fracture density.In addition,a power relationship is observed between radon flux and fracture density.Although no unique fracture set is particularly related to a measured radon flux,the empirical relationship can be used with measured radon flux from field studies to predict an approximate fracture density for the rock.
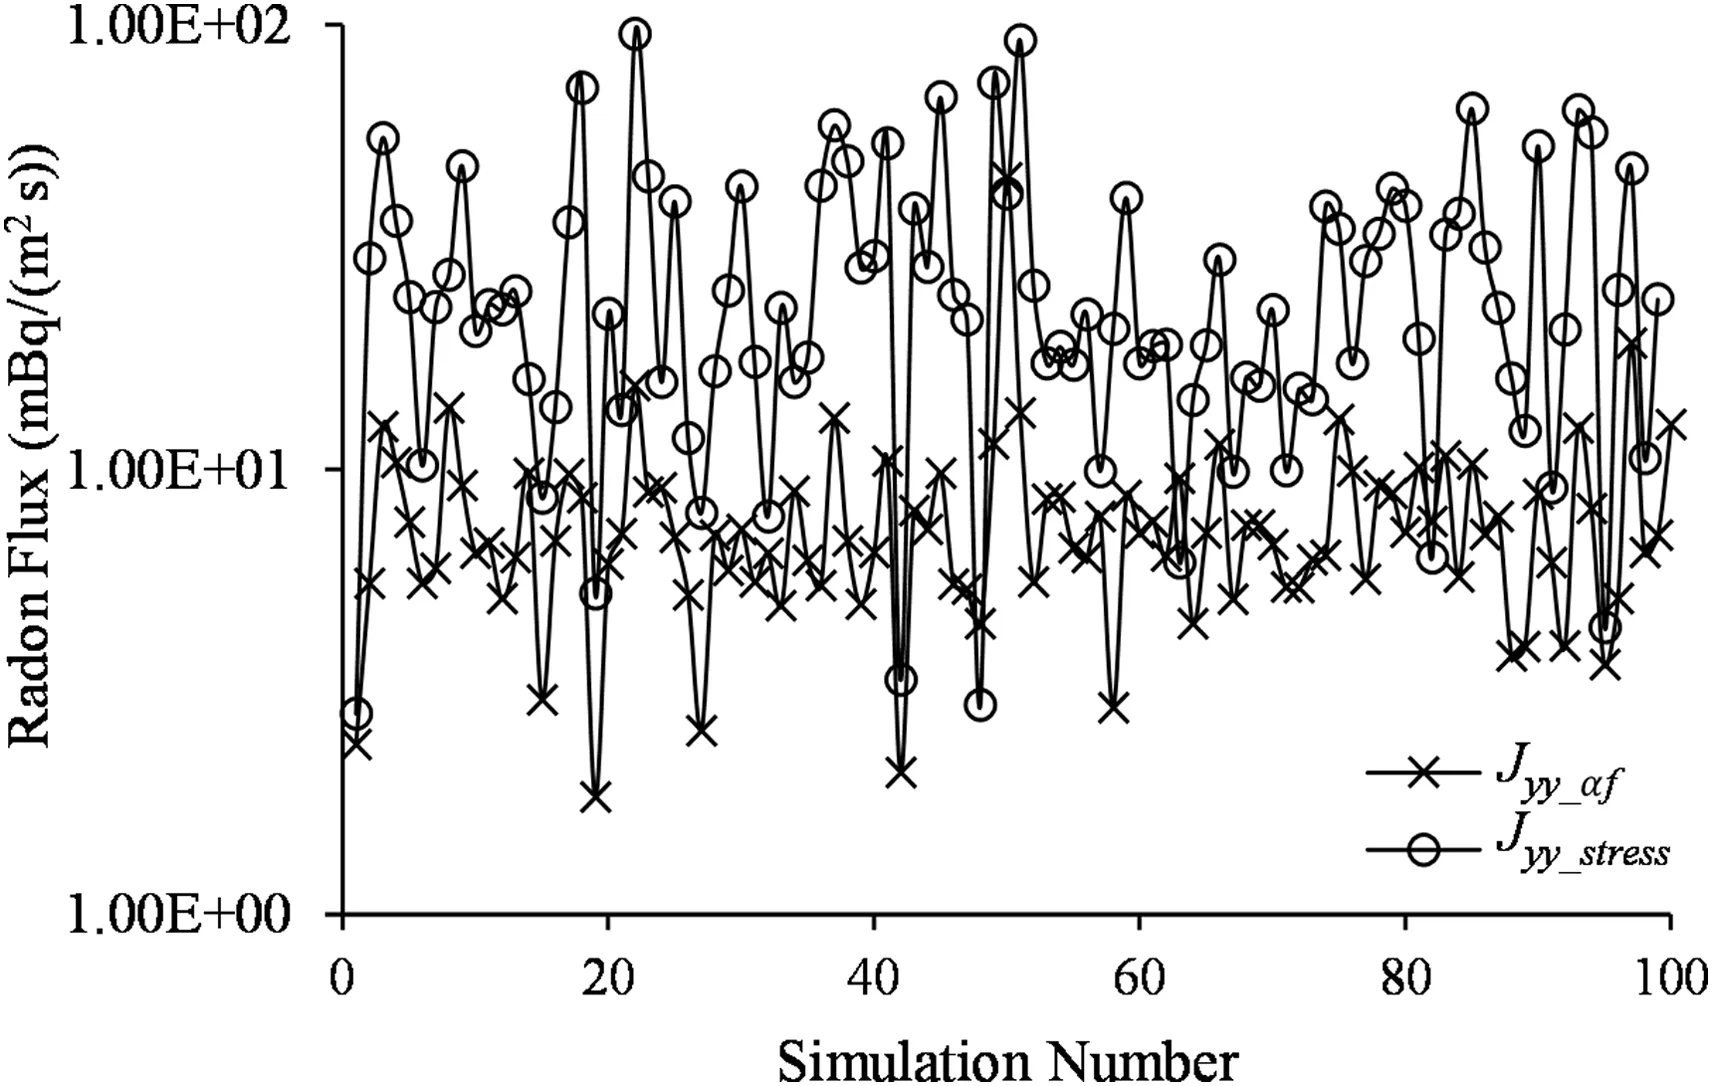
Fig.14.Comparison of stress predicted from constant fracture toughness(αf=0.0007 m1/2,Jyy_af)with variable stress condition(Jyy_stress).

Fig.15.Plot of radon flux with fracture density.
3.2.4.Effect of radon generation rate
This model assumes a uniformly distributed radon source from the rock.However,different rocks have different average radon generation rates.Therefore,we studied the impact of changes in radon generation rate (q)between rock samples using a 40 m DFN domain.Fig.16 shows that an increase in the generation rate increases radon flux,but not as significantly as changes in the fracture density as shown in Fig.15.For example,there is a less than 10%increase in radon flux for the first 20%increase in q,which is unlike in Fig.15.Therefore,for a rock sample with a uniformly distributed radon source,an increase in the fracture density has a more significant effect on radon flux compared to a rock with equivalent higher radon generation rate.Hence,a rock sample with a lower radon generation rate can be harmful if the fracture density is high.
3.3.Radon dimensionless flux
After presenting the results for radon flux,and discussing the model sensitivity to different parameters in Sections 3.1 and 3.2,this section focuses on radon dimensionless flux described in Eq.(18).Three dimensionless parameters are derived(i.e.Eqs.(6)-(8))from Eq.(5).π1is a conventional dimensionless parameter(Peclet number),whereas π2and π3are dimensionless parameters derived from this study.For clarity,π2is named as dimensionless decay,andπ3,is named as dimensionless generation.Since both are dimensionless parameters presented in this study,it is important to study the range of values and their effects.
The dimensionless decay,π2,is defined as the ratio of decay effect to diffusion effect:

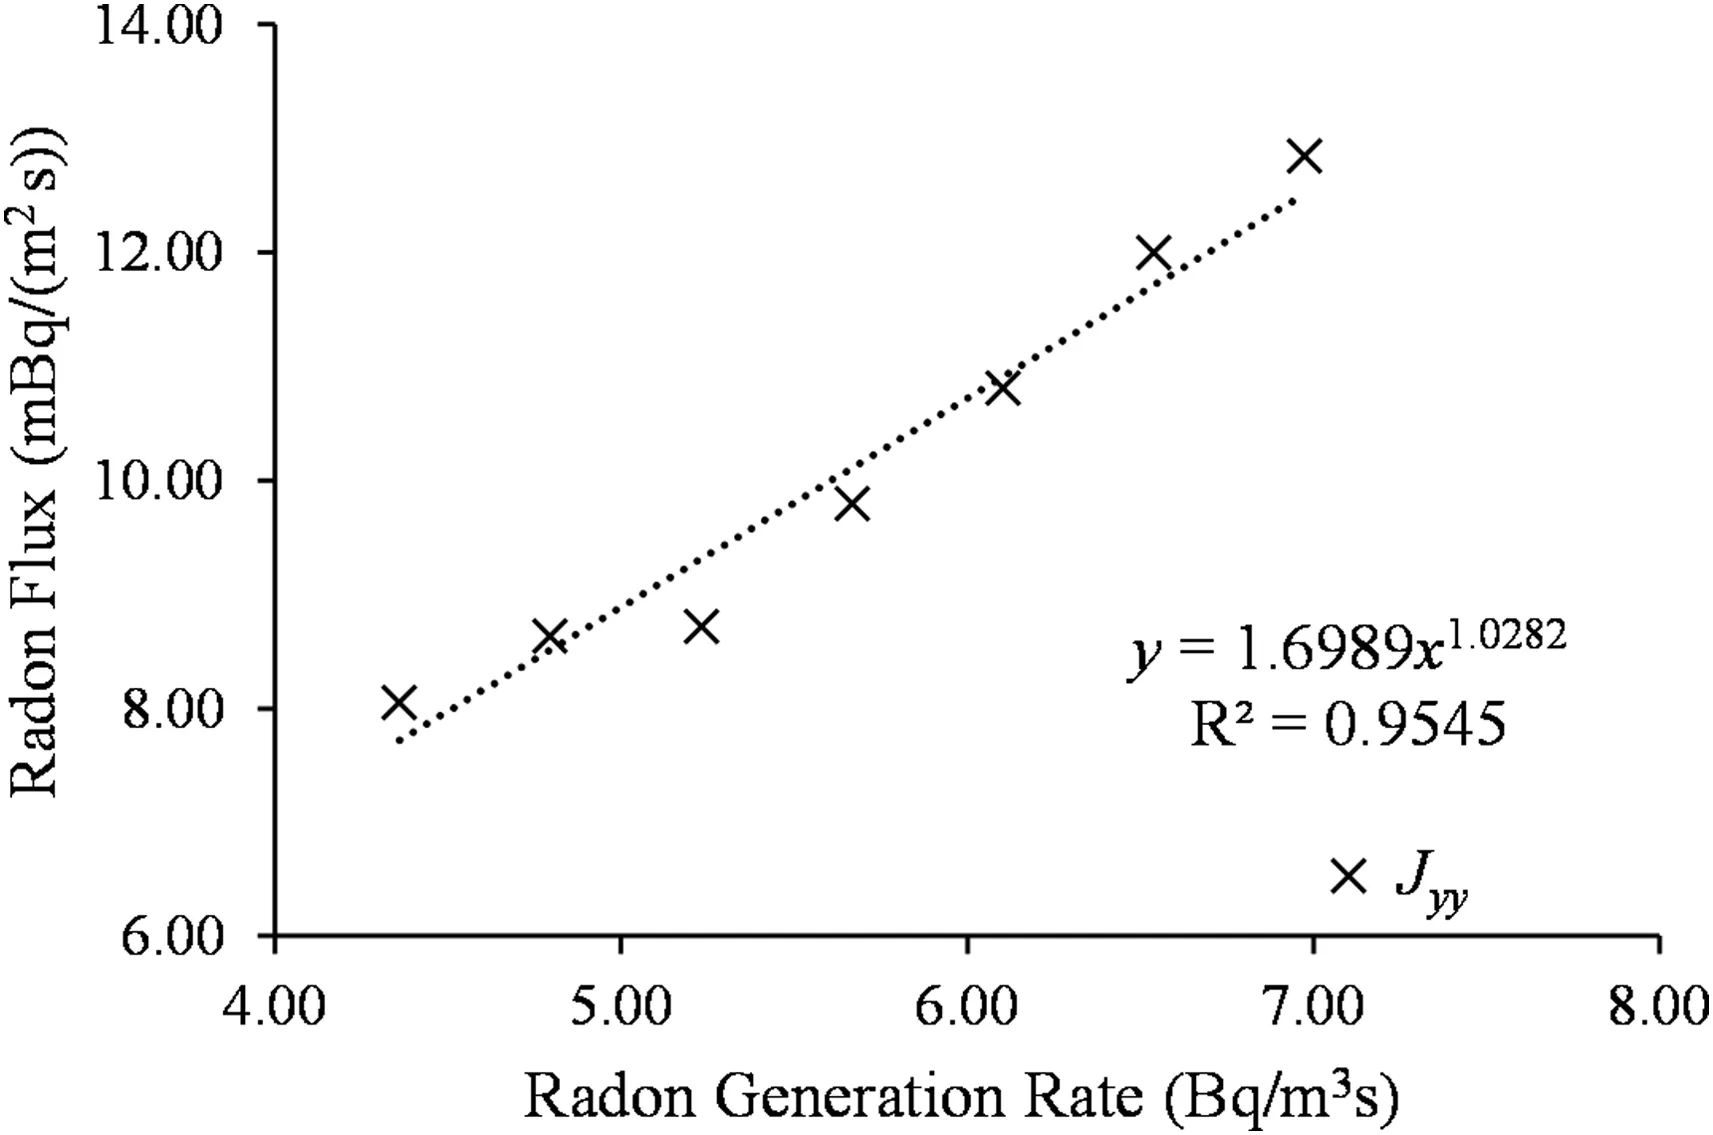
Fig.16.Plot of radon flux with radon generation rate.
Since bothλand D are constants(2:1×10⁻⁶s-1and 1:1×10⁻⁵m2/s,respectively),the ratio of the decay constant to diffusion coefficient(λ/D)is 0.191.Therefore,the values depend significantly on the characteristic length,which could vary significantly depending on the domain.For the characteristic length of 0.1 m,π2≈0:00191 and for 100 m,π2≈1909.However,using the diffusion length of radon(2.18 m),we haveπ2≈0:91.Hence,for π2< 0:91,diffusion transport is significant,and asπ2increases significantly beyond 0:91,the effect of decay becomes more significant.Therefore,the radon flux decreases asπ2increases.
The dimensionless generationπ3is defined as the ratio of radon generation effect to the diffusion effect:

Here,only the diffusion coefficient is a constant;hence,any of the other three values might vary to changeπ3.For the values used in this study,we assumed q/(Dc∞)≈0:12.Using the diffusion length of radon as the characteristic length(2.18 m),it yields π3≈0:55.Therefore,π3<0:55 implies that the concentration gradient is significant such that the mass flux due to the diffusion dominates the radon mass flux generated within the fracture walls.However,asπ3increases,the radon generated within the fracture wall becomes very significant.Therefore,high values ofπ3imply high radon generation flux per unit distance,and vice versa.
3.3.1.Radon dimensionless flux for a single fracture
Here,we present the effect of the three dimensionless parameters on radon dimensionless flux for a single fracture.Fig.17a shows the effect ofπ1on dimensionless flux for different values of π2,and constant value ofπ3(=100).First,the result shows that an increase inπ1significantly increases the dimensionless flux within 3-4 orders of magnitude for different values ofπ2.Since the dimensionless flux is obtained by dividing the flux with the diffusion flux(Eq.(18)),asπ1increases,the advection flux increases,and the dimensionless flux trends towards π1.For a fixed value of π1,radon dimensionless flux decreases with an increase in π2.From Fig.17a,we observed the minimum dimensionless flux for the highest value ofπ2;hence,an increase in π2implies a significant effect of radon decay in the rock mass.
Similarly,we repeated the same study for different values ofπ3and π2(=1).This follows a similar trend as that in Fig.17a,demonstrating that increase inπ1increases radon dimensionless flux.However,in this case for a fixed π1,an increase inπ3elevates the radon dimensionless flux,and this implies an increase in the influence of radon generation rate within the rock mass.In addition,we observe that the range of variation increases for lower values ofπ3,which indicates strong influence of diffusion.
3.3.2.Radon dimensionless flux for a DFN
Section 3.3.1 presents the effect of the dimensionless parameters on the dimensionless flux for a single fracture.However,in most cases,rocks consist of a network of fractures,hence,it is necessary to extend this to a fracture network.Therefore,this section focuses on the effects of dimensionless parameter on radon flux for a 40 m DFN domain.Fig.18 shows the effect ofπ1on the dimensionless mass flux with constant values ofπ2=407 and π3=245 calculated using the maximum fracture length for the 40 m domain as L=46 m.The result shows that radon dimensionless flux increases as the Peclet number increases similar to the single fracture study.The range of values varies within about 2 orders of magnitude unlike the single fracture effect in Fig.17a due to the combined effects of the high value ofπ2in the fracture network.Therefore,increase in Peclet number increases radon dimensionless flux,but the range of influence depends onπ2.
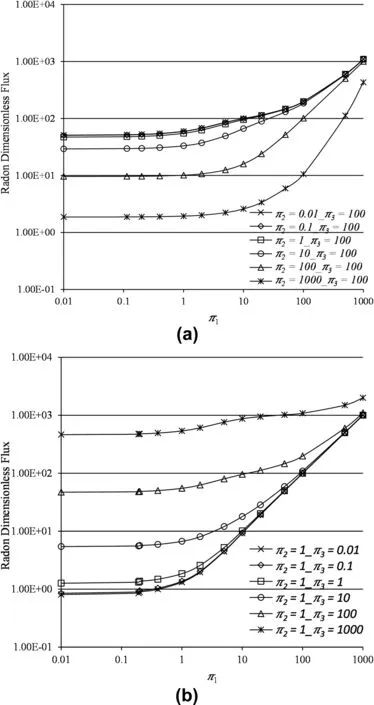
Fig.17.Study of dimensionless flux for a single fracture.(a)Plot of dimensionless flux with Peclet number(π1)for varying dimensionless decay(π2)and constant dimensionless generation(π3=100);and(b)Plot of dimensionless flux with Peclet number(π1)for varying dimensionless generation(π3)and constant dimensionless decay(π2=1).
Similarly,we studied the effect ofπ2on the dimensionless flux for a 40 m DFN domain as shown in Fig.19.The result shows that increase inπ2decreases radon dimensionless flux similar to the result obtained for a single fracture in Section 3.3.1.Furthermore,we studied the effect ofπ3on radon dimensionless flux for constant values ofπ2(=407)(a DFN size of 40 m),and π1(=1)as shown in Fig.20.An increase inπ3significantly increases the dimensionless flux(similar to results observed in Fig.17b for a single fracture)due to the strong influnce of radon generation within the rock mass for high values of π3.Therefore,for a DFN with constantπ1,the dimensionless flux decreases with an increase inπ2for a fixedπ3,and the dimensionless flux increases with an increase inπ3for a fixedπ2.
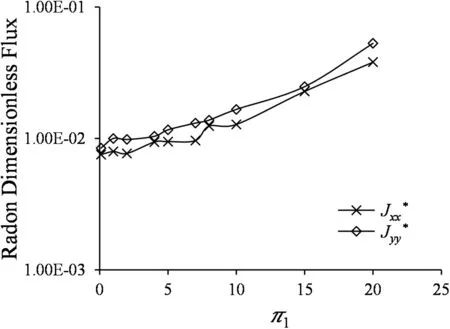
Fig.18.Plot of dimensionless flux with Peclet number(π1)with constant dimensionless decay(π2=407)and dimensionless generation(π3=245)for a DFN.
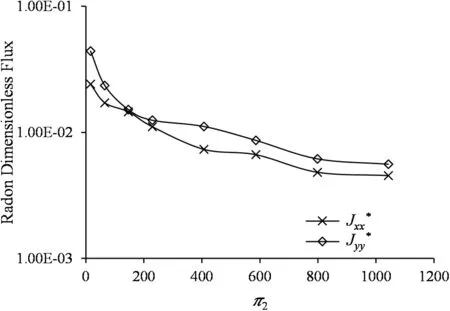
Fig.19.Effect of dimensionless decay(π2)on dimensionless flux with constant dimensionless Peclet number(π1=1)and dimensionless generation(π3=245)for a DFN.
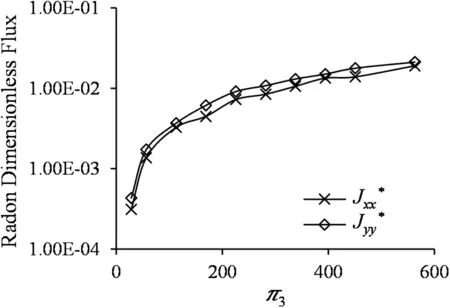
Fig.20.Effect of dimensionless generation(π3)on dimensionless flux with constant dimensionless Peclet number(π1=1)and dimensionless decay(π2=407)for a DFN.
4.Conclusions and future work
This paper presents an approach for determining radon flux from fractured rocks using a DFN model.This involves the derivation of radon flux equations related to transport due to advection and diffusion,application of radon mass balance,and generation of a stochastic DFN model.In cases of particular field study,discontinuity data from borehole,rock cores,and scanlines can be processed to identify fracture sets and their orientations to tune the stochastic model for better match of site-specific conditions.Therefore,this model predicts radon flux from fractured rocks,and it has specific application in rocks that are not easily accessible for field measurements.
In this study,we found that:(1)the proposed model predicts radon flux from fractured rock;(2)the model can be applied to specific locations if the site data such as fracture sets,fracture orientations,and rock’s engineering properties are available;(3)the model is very sensitive to the advection velocity model and the aperture model implemented;(4)incorporating the effect of stress into the model shows more heterogeneity related to radon transport as observed from field studies;(5)an increase in fracture density increases radon flux,and an empirical power law relationship is found to relate both parameters;(6)the empirical relationship can be used with measured radon flux from field studies to predict the rock’s fracture density;(7)radon flux increases with increase in radon generation rate,but not as sensitive as the fracture density,hence,increase in fracture density of a rock sample with uniformly distributed radon generation rate increases radon flux more than another rock sample with an equivalent increase in radon generation rate;(8)apart from Peclet number,a conventional dimensionless parameter and two other dimensionless parameters(π2and π3)represent the effects of diffusion,radon generation and radon decay rate on radon dimensionless flux,respectively;(9)π2tagged dimensionless decay is defined as the ratio of decay effect to diffusion effect,and the increase inπ2decreases radon dimensionless flux;and(10)π3tagged dimensionless generation is defined as the ratio of radon generation rate to diffusion rate,and increase inπ3increases radon dimensionless flux.
Though we have developed a robust model to predict radon flux from fractured rocks,there are certain limitations to the model,which provides further opportunities for improvement.Some of these are:(1)implementing a distribution of radon generation rate within the rock mass since radon generation rate is not uniform in a real world scenario;(2)quantifying the uncertainty related to this model,since the results presented are averages of 100 Monte Carlo simulations,and there are uncertainties in the model due to the approach and input parameters used;(3)investigating the ratio of dimensionless generation to dimensionless decay within relevant transport regimes;(4)considering the interaction between the rock matrix and the DFN;and(5)implementing the model in three dimensions,and further investigation on the application of the identified dimensionless parameters.However,the numerical experience developed from this study shows that this model can predict radon flux from inaccessible zones,and also improve understanding of the radon transport mechanism through fractured rocks.
Conflicts of interest
The authors wish to confirm that there are no known conflicts of interest associated with this publication and there has been no significant financial support for this work that could have influenced its outcome.
Acknowledgements
The authors acknowledge the financial support from the National Institute for Occupational Safety and Health(NIOSH)(200-2014-59613)for conducting this research.The data for this paper are available at https:// figshare.com/s/95560d8d59e72af7ef09.
Appendix A.Supplementary data
Supplementary data related to this article can be found at https://doi.org/10.1016/j.jrmge.2018.02.009.
 Journal of Rock Mechanics and Geotechnical Engineering2018年5期
- Journal of Rock Mechanics and Geotechnical Engineering的其它文章
- Pullout behavior of polymeric strip in compacted dry granular soil under cyclic tensile load conditions
- A comparative study between gravel and rubber drainage columns for mitigation of liquefaction hazards
- Bearing behavior and failure mechanism of squeezed branch piles
- Experimental evaluation of mechanically stabilized earth walls with recycled crumb rubbers
- Dynamic properties and liquefaction behaviour of cohesive soil in northeast India under staged cyclic loading
- Saturated anisotropic hydraulic conductivity of a compacted lateritic soil
