An approach for wellbore failure analysis using rock cavings and image processing
Christopher Ske,Alirez Rezgholilou,*,Pouri Behnoud Fr,Roof Gholmi,Mohmmd Srmdivleh
aDepartment of Petroleum Engineering,Curtin University,Perth,Australia
bDepartment of Petroleum Engineering,Amirkabir University of Technology,Tehran,Iran
Keywords:Caving shape Cuttings Drilling Image analysis Wellbore failures Roundness Sphericity
A B S T R A C T There have been interests to link different cuttings/cavings to various wellbore failure types during drilling.This concept is essential when caliper and image logs are not available.Identification of wellbore failure during drilling gives more chance of immediate actions before wireline logging program.In this paper,an approach was presented based on the image processing of ditch cuttings.This approach uses the sphericity and roundness of cuttings as input data to classify caving types and subsequently determine the dominant failure type.Likewise,common definitions of cavings were discussed initially before a new criterion is suggested.This quantitative criterion was examined by observations from caliper and acoustic image logs as well.The proposed approach and criterion were implemented on ditch cuttings taken from a well in Western Australia.Results indicate that the primary failure is shear failure(breakout)due to high levels of angular cavings.However,another failure due to the fluid invasion into pre-existing fractures was also recorded by blocky cavings.
1.Introduction
Cuttings are a valuable source of information when drilling oil and gas wells.One of the major issues that may arise during drilling is the presence of abnormal cuttings/cavings which indicate that a failure has occurred downhole.The cost induced by wellbore instabilities is estimated to be 15%of the overall drilling budget for the well(Zausa et al.,1997).A quick interpretation of these cuttings is vital to remedy the problem,avoiding downtime and increased costs.This study aims to achieve a fast and reliable method of cutting analyses using image processing technique in order to determine the mode and size of failure without running wireline logging tools.Due to the vast number of different wells and even greater number of variables,this study will focus on ditch cutting produced from a vertical well in the southern part of Perth Basin in Western Australia.The well was drilled to a total depth of 2913.8 m TVDSS(true vertical depth subsea),and cuttings were collected at various depths.The well mainly intersected sandstone,although traces of claystone and siltstone were detected.The wellbore was at risk of instability due to the long open-hole completion.A detailed evaluation of the ditch cutting samples was undertaken to assess the relationship between cavings and wellbore instabilities.The study covers the shape,size and type distributions of cavings in available samples.Accordingly,image processing technique is employed by using ImageJ software to evaluate the particle’s shape features.This method allows for a depth-dependent characterization of the dominant failure types in the well.
Although this method is a common practice for cuttings,there is very little work on its application or characterization of caving.For cuttings,real-time monitoring of particle size distribution(PSD)is coupled with a Coriolis flow meter measuring flow density.This system is programmed to identify cuttings vs.caving ratio based on the shape factor(length/width)and return volume,and thus can give an alert of escalating caving percentage to drilling engineer(Karimi,2013).Real-time PSD is not feasible for cavings due to their large size.However,the image analysis technique applied in this paper can be beneficial to study samples in required situations.It provides a fast analysis of caving shape,size and distribution regardless of the size of cavings presented.
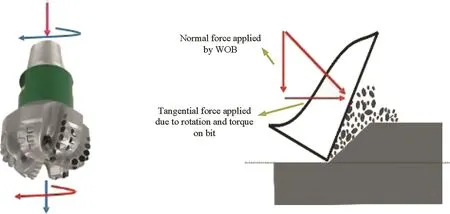
Fig.1.Cutting mechanism of a drill bit(modified after Mostofi and Franca,2014).
2.Particle descriptions
2.1.Cuttings
Drill cuttings are an important piece of data coming to the surface,providing a real-time description of subsurface lithology.Mud engineers can identify the likely type and location of wellbore failure by monitoring these cuttings.As a result,good knowledge of cutting size,shape and color is required for judgment.However,distinguishing cuttings generated by the drill bit from those created by the wellbore failure is not an easy and straightforward task due to a variety of bits and phenomena included in the generation of cuttings.This section aims to provide an insight into the differences between the cuttings created by the bits and those induced by stresses around the wellbore.
2.2.Drill bit cuttings
The type of drill bit is important for size of cutting,and its selection depends on formation type,required rate of penetration(ROP)and service-life of a bit.Weight on bit(WOB)and rotation per minute(RPM)are two important parameters in the creation of cuttings.RPM induces the tangential force with the help of WOB,while WOB provides the normal force on the wellbore floor.When these two forces are transferred to the wellbore through bit teeth,rocks are crushed,and cuttings are generated,as shown in Fig.1.
Size of cutting produced from a roller cone bit depends on the tooth length and formation hardness.Large tooth roller cone bits are used in soft formations producing large cuttings while small tooth bits are employed in hard formations generating very small to almost powder-like cuttings(Seubert,1995).
A polycrystalline diamond cutter(PDC),on the other hand,uses synthetic diamond material as sharp fixed surfaces to scrape orgrind the rock.A PDC cutter induces a shear failure along the shear planes of the rock face and is suitable for soft to medium strength rocks(Bar-Cohen and Zacny,2009).

Table 1Cutting characteristics with respect to formation types(Egenti,2014).
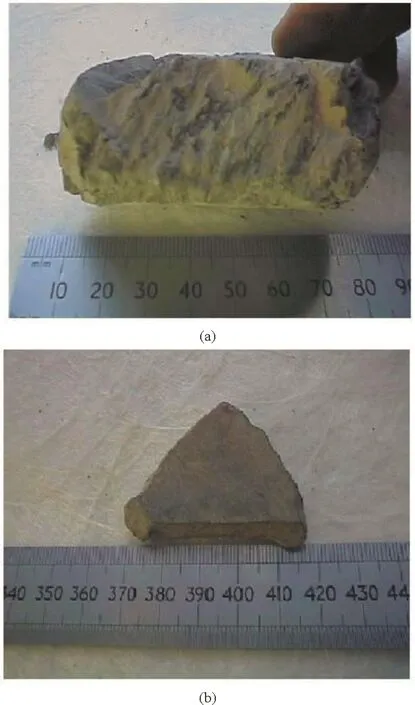
Fig.2.(a)Naturally fractured (blocky)and (b)weak plane(tabular)cavings(Kristiansen,2004).
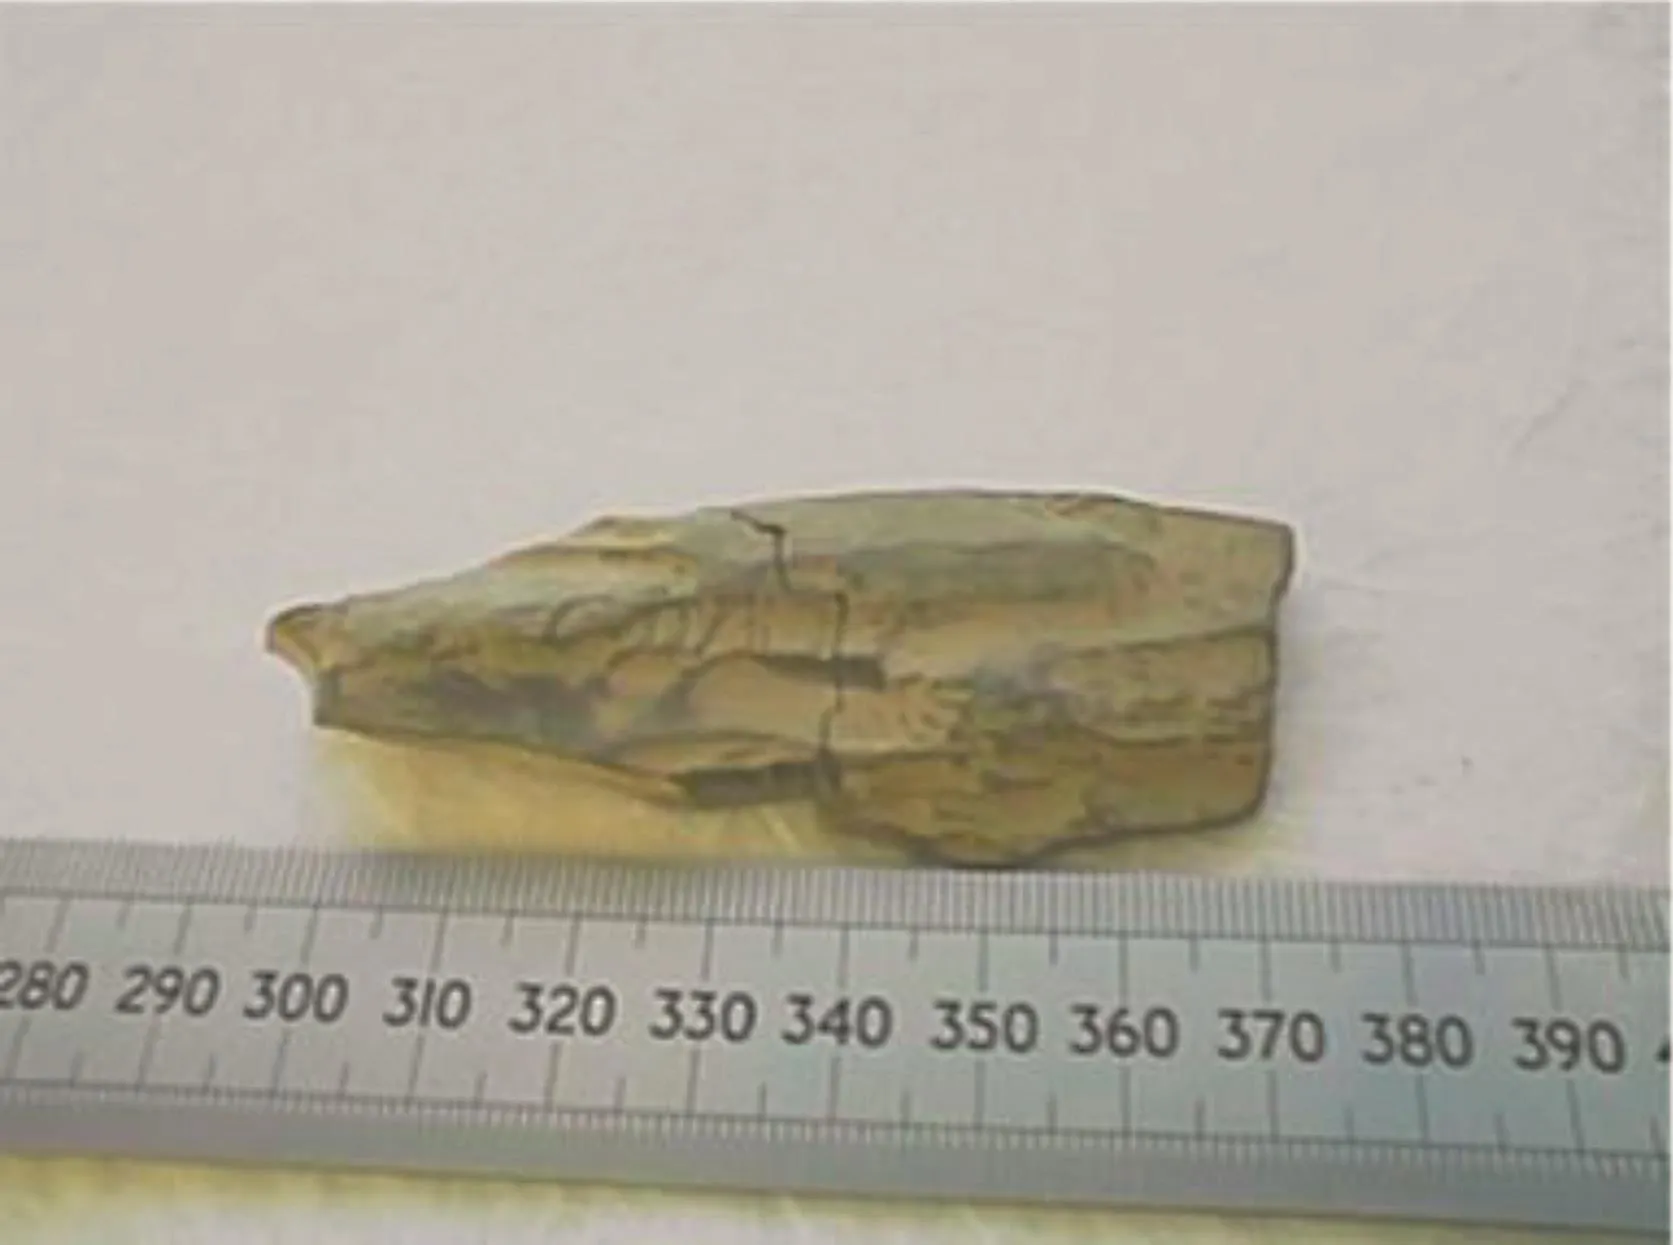
Fig.3.Angular caving(Bradford et al.,2000).
However,diamond-impregnated bits are the bestoption for ultrahard abrasive rock formations due to their exceptional durability.This characteristic keeps them sharp even as they wear(Mostofi and Franca,2014).They are used when sheets of ultra-hard rock are embedded within softer formations.This eliminates the need for an additional trip(topull out of the hole and run back) to replace the worn out bits,thereby reducing the time and cost of projects.These differences in the size of cuttings produced between PDC and tri-cone bits are due to the PDC bit shearing the formation at a set angle causing ductile failures of a rock mass, so cuttings are relatively constant in size..The tri-cone bits,on the other hand,cause brittle failure of rock mass,which leads to a variety of large cutting sizes.
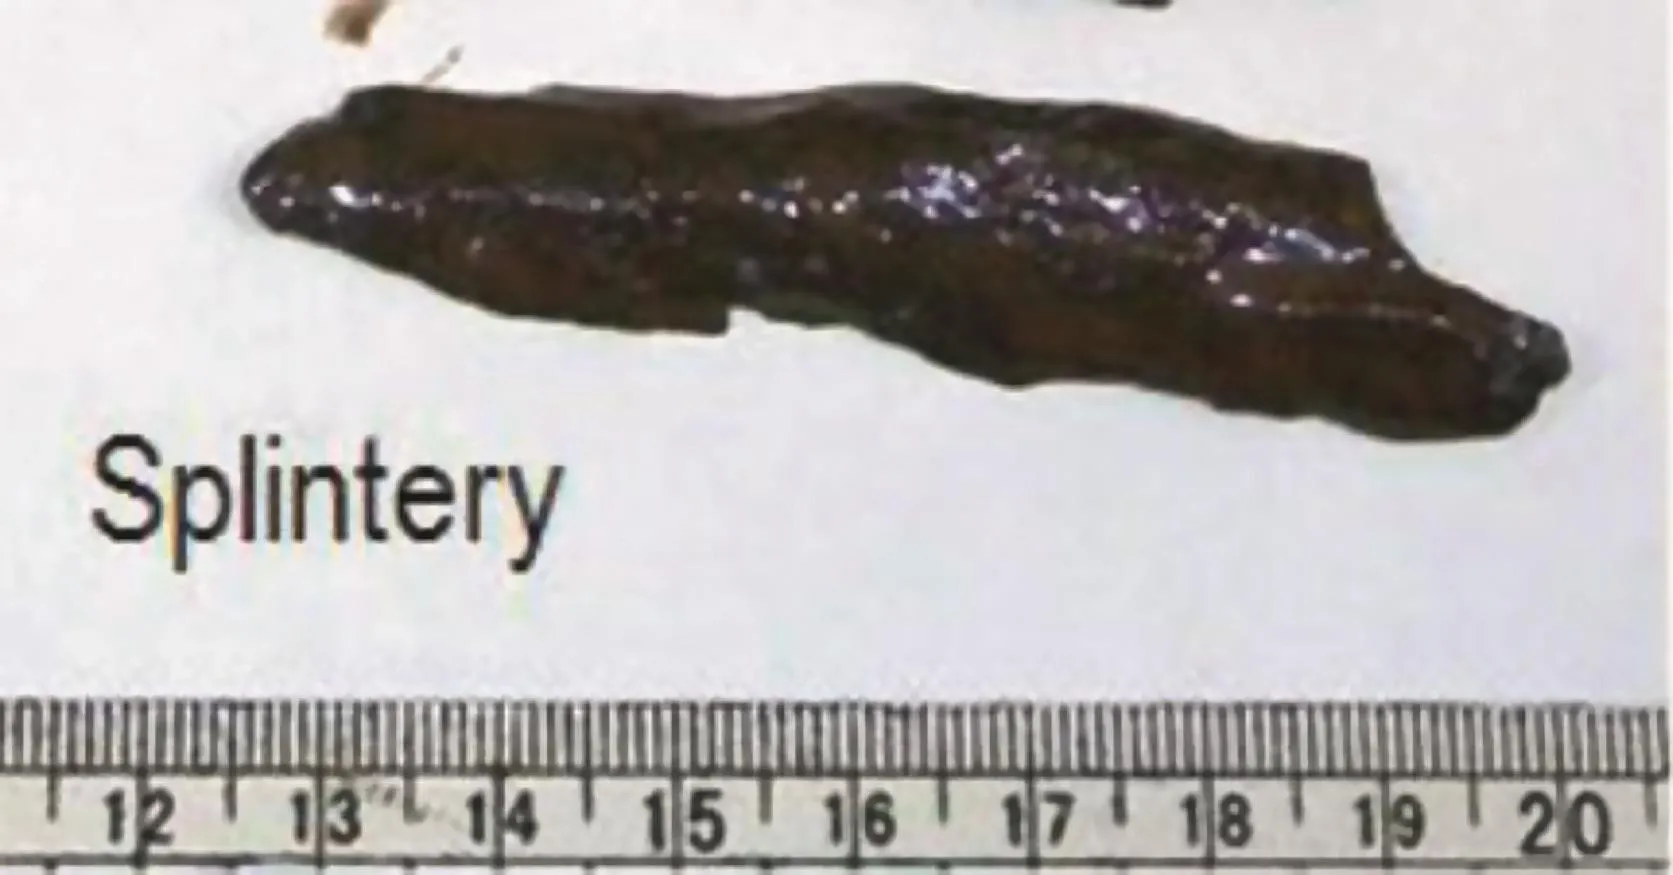
Fig.4.Splintery caving from underbalanced drilling(Kumar et al.,2012).
The formation type may also have a large impact on the size of cuttings obtained at the surface.Cuttings produced in hard formations,such as limestone and claystone,are usually large,while those produced in soft formations,including sandstone and siltstone,are more rounded and may not reach the surface in the original condition(Egenti,2014).Table 1 shows the general characteristics of cuttings with respect to formation types.As presented in Table 1,sandstones produce a small cutting size when a PDC bit is utilized at a shallow depth which indicates the fact that as the bit grinds the rock,the cementitious material holding individual grains breaks(Bourgoyne et al.,1986).
2.3.Cavings
Cavings are often the primary cause of wellbore instability and account for approximately 40%of rig downtime(Gallant et al.,2007).They usually occur because of rock failure but may not necessarily lead to wellbore instability,but they can pose hole cleaning issues.Induced cavings that appear at shale shakers allow quick interpretation of the downhole environment,including the nature of instability and its locations.These cavings can be produced by several factors such as underbalanced drilling,residual stress relief,pre-existing weak planes,or the mechanical action of the drilling process and tools(Kumar et al.,2012).
Under these circumstances,the failure mechanisms can be classified into two main classes:shear failure of intact rock(breakout)and failure along pre-existing weak planes such as fractures,cleavage or bedding planes(Edwards et al.,2004).The former is referred to as isotropic rock failure,and the latter is known as anisotropic rock failure.Rock containing pre-existing planes of weakness can be divided into two subcategories.Depending on the well trajectory and the ambient stress field,certain bedding and natural fracture orientations may be suitable for initiating shear failure when the in situ stresses resolved along these planes exceed the sliding friction and the natural cohesion.If the shear failure is excessive,blocky and angular rock cavings will spall into the borehole.Drilling fluid would leak into these cracks and could cause further propagation of shear failure due to pore pressures,especially when a low viscosity synthetic/oil-based drilling mud is used(Behnoud Far et al.,2017;Gholilou et al.,2017;Salemi et al.,2017).Because of the permeable nature of these shear-induced cracks,they provide a plane of weakness which allows the drilling fluid to enter into the formation.Increasing the mud weight may increase anisotropic wellbore failure and exacerbate the hole cleaning issues,which,if not properly managed,will create wellbore instabilities.A preventive measure would modify the mud weight or change the trajectory of the well for providing additional support to wellbore wall(Zoback et al.,2003).Interpreting caving shape is quite difficult,as multiple failure modescan co-exist under different circumstances as well as a change of caving shape due to grinding in wellbore annulus on the way to surface(Karimi,2013).

Table 2General characteristics of cavings and their treatments(Edwards et al.,2004;Pasic et al.,2007;BP,2008;Osisanya,2011;Kumar et al.,2012;Karimi,2013;Halliburton,2014).
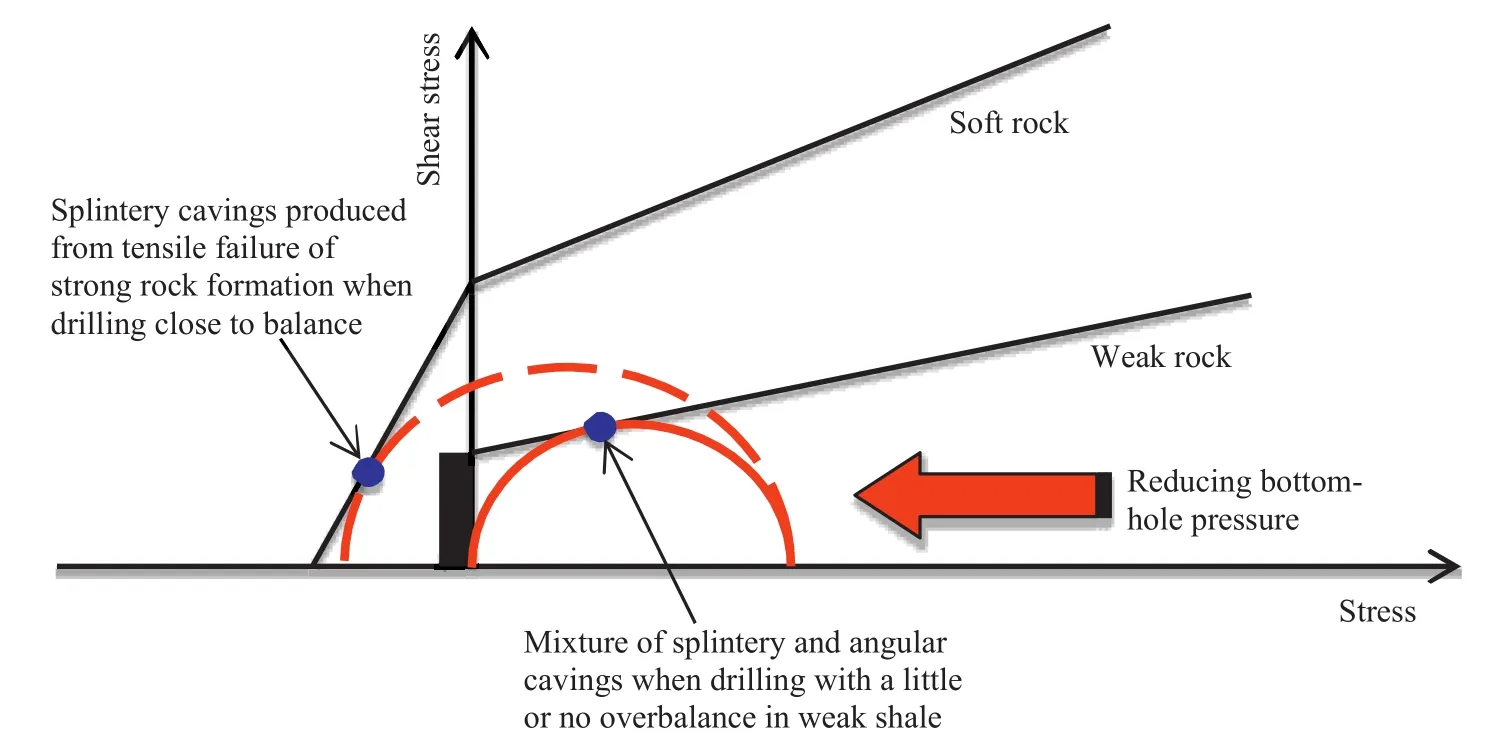
Fig.5.Mohr’s circle illustration of borehole tensile and shear failures for strong and weak formations(modified after BP,2008).
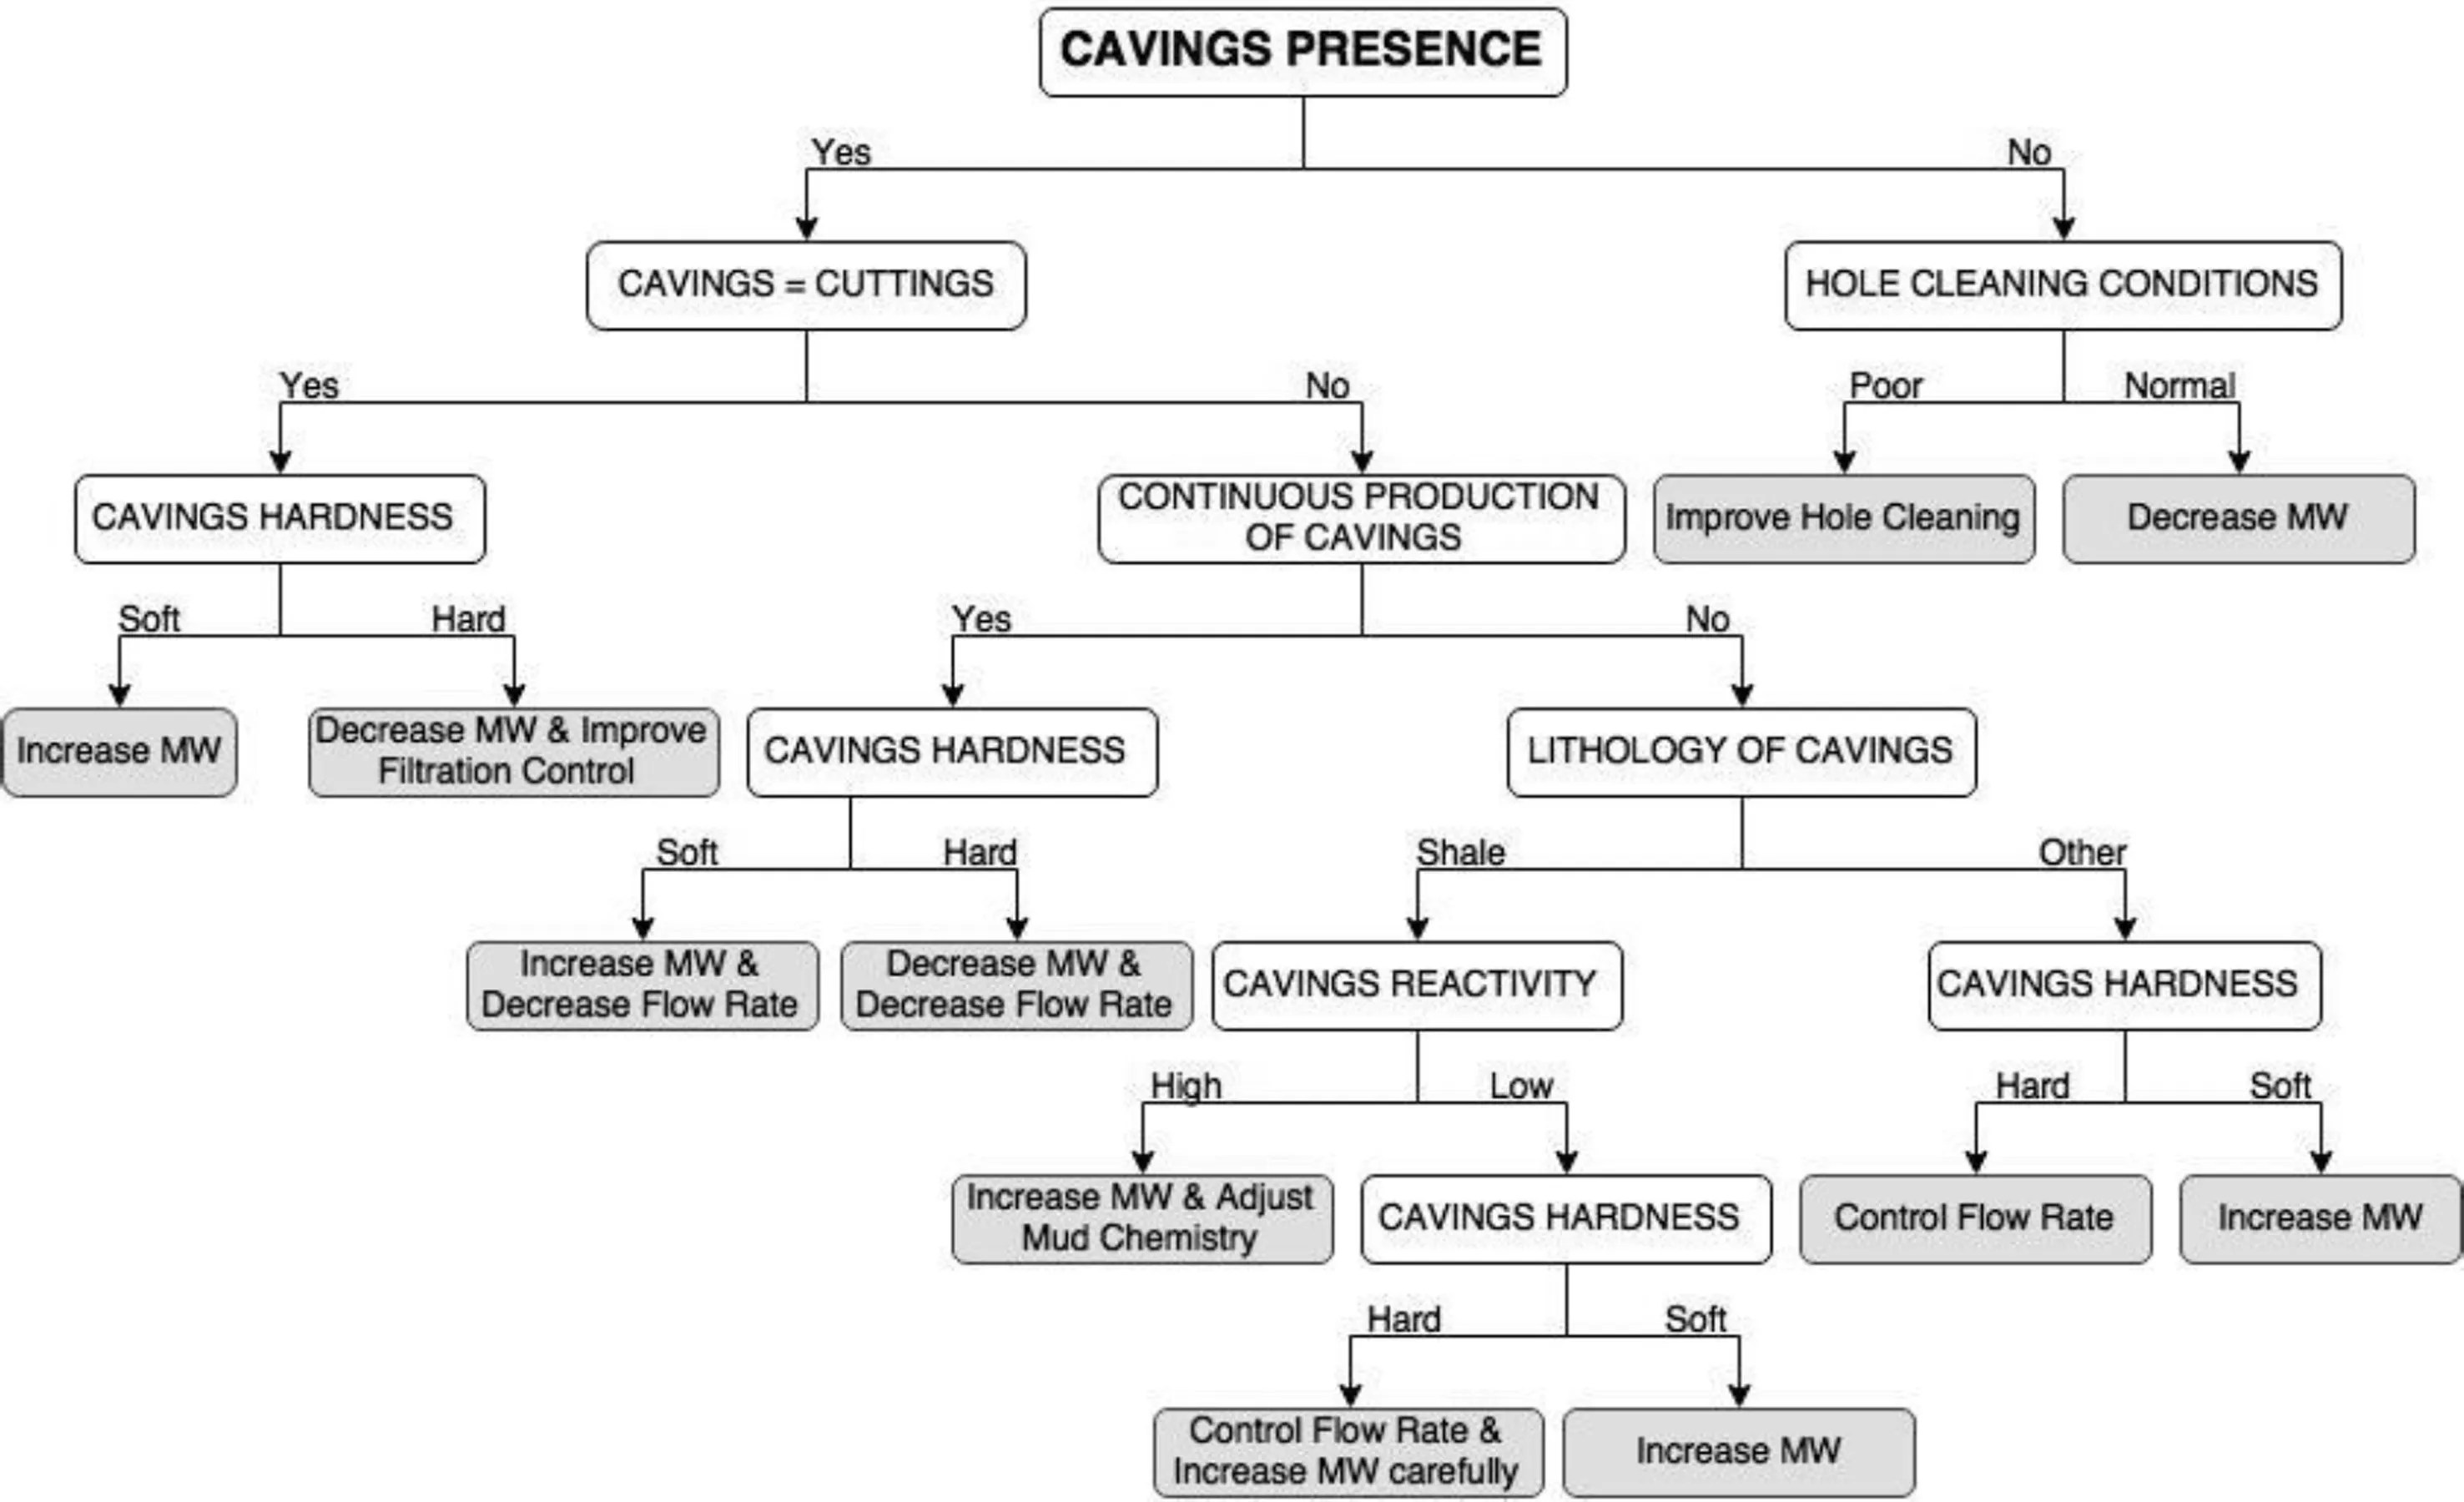
Fig.6.Action flowchart when cavings are present at the surface(Zausa et al.,1997).
The three main shapes of cavings often used for identifications are tabular(or blocky),angular and splintered.Osisanya(2011)and Bradford et al.(2000)described these shapes as follows.
2.3.1.Tabular/blocky cavings
Anisotropic bedding/fracture plane related cavings may originate from weak bedding planes or unstable natural fractures.Cavings in the kinds of natural fracture and bedding plane have tabular/blocky shapes when produced.However,they are difficult to be removed from the well,and thus re-working of these cavings may alter the shape of the tabular/blocky cavings.

Table 3Summary of preliminary sieving of ditch cutting(2.36 mm sieve).
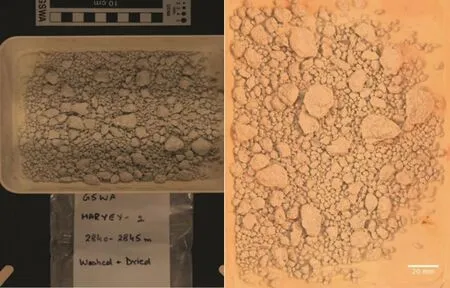
Fig.7.Sample ditch cuttings(left)and cropped image of ditch cuttings with background subtracted(right).
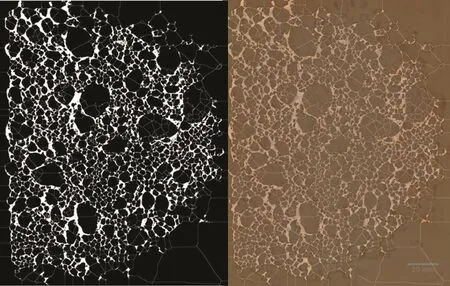
Fig.8.The watershed of threshold image to identify individual particles(left)and overlaying of the original image over the processed image(right).
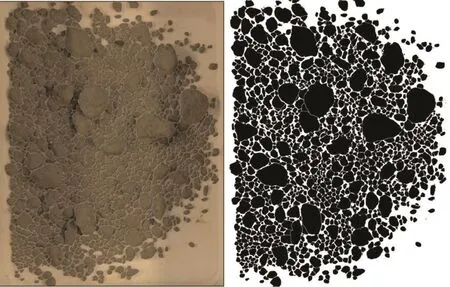
Fig.9.Processed image with overlay(left)and that of the ditch cuttings for analysis(right).
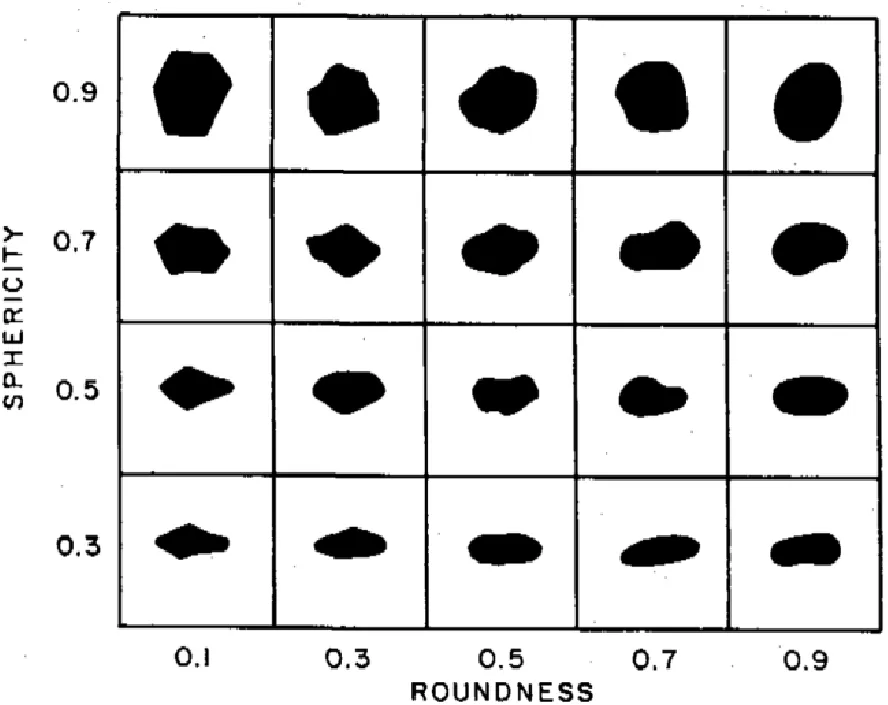
Fig.10.A plot describing the grain shape by roundness and sphericity(Swanson,1981).
Tabular cavings are caused by the invasion of drilling fluids into the weak planes/fractures causing instability within the wellbore.This failure leads to high caving rates,lost returns,and stuck pipe and tools within the hole.Weak plane cavings have flat faces parallel to bedding planes and are often induced by selecting a low mud weight and drilling a borehole with 15°-20°deviation from the direction of bedding(Bradford et al.,2000;BP,2008).The combination of these two factors induces massive failure along weak planes on the high side of the wellbore.
In vertical wells,however,tabular/blocky cavings are mainly produced due to destabilization of wellbore wall induced by fluid invasion into natural fractures rather than a weak plane, as shown in Fig. 2.
2.3.2.Angular cavings
Angular cavings are generated due to shear failure of the wellbore.As such,different parameters such as high horizontal stresses,low strength of rocks,low mud weight,insufficient mud viscosity,and improper trajectory and temperature differences can be problematic.If the surface appears old,they may have come from rubble zones which consist of rock fragments held together by the friction(BP,2008).These rubble zones occur in mechanically weak areas and may lie near faults,salt domes or other forms of a diaper(BP,2008).
Angular cavings can be described byan arrowhead or triangular shape with curved faces and a rough surface structure(BP,2008).To prevent this failure,an increase in the mud weight is suggested,if the pore/fracture window allows.Careful drilling practices with a low ROP can also be considered,on these occasions,to mitigate the borehole cleaning issues.Fig.3 displays a typical angular caving.
2.3.3.Splintery cavings
Splintery cavings are produced in over-pressured zones,where tensile failures occur throughout the wellbore circumference.High formation pore pressures pop the cavings out with a long and concave shape similar to that shown in Fig.4.When wells are drilled into a tectonically active region,splintery cavings are produced.This is because of the movement between tectonic plates,which places significant stresses on the rock causing it to buckle(Pasic et al.,2007).The hydrostatic pressure required to stabilize the wellbore may be higher than the fracture initiation pressure of other exposed formations.Thus,the solution would be to case the hole as quickly as possible while maintaining a sufficient mud weight(Bowes and Procter,1997).
The size of splintery cavings may range from very tiny splintery fragments to long slivers,several centimeters in length.The splintery cavings occur when drilling has a high ROP through low permeable rocks.Under this circumstance,a high pore pressure condition is induced,causing tensile failures.This situation is intensified in the presence of high tectonic stresses and wellbore enlargements(Halliburton,2014).Splintery cavings can be prevented/mitigated by increasing the weight of the drilling fluid or by reducing ROP if it is high(Skalle,2010).
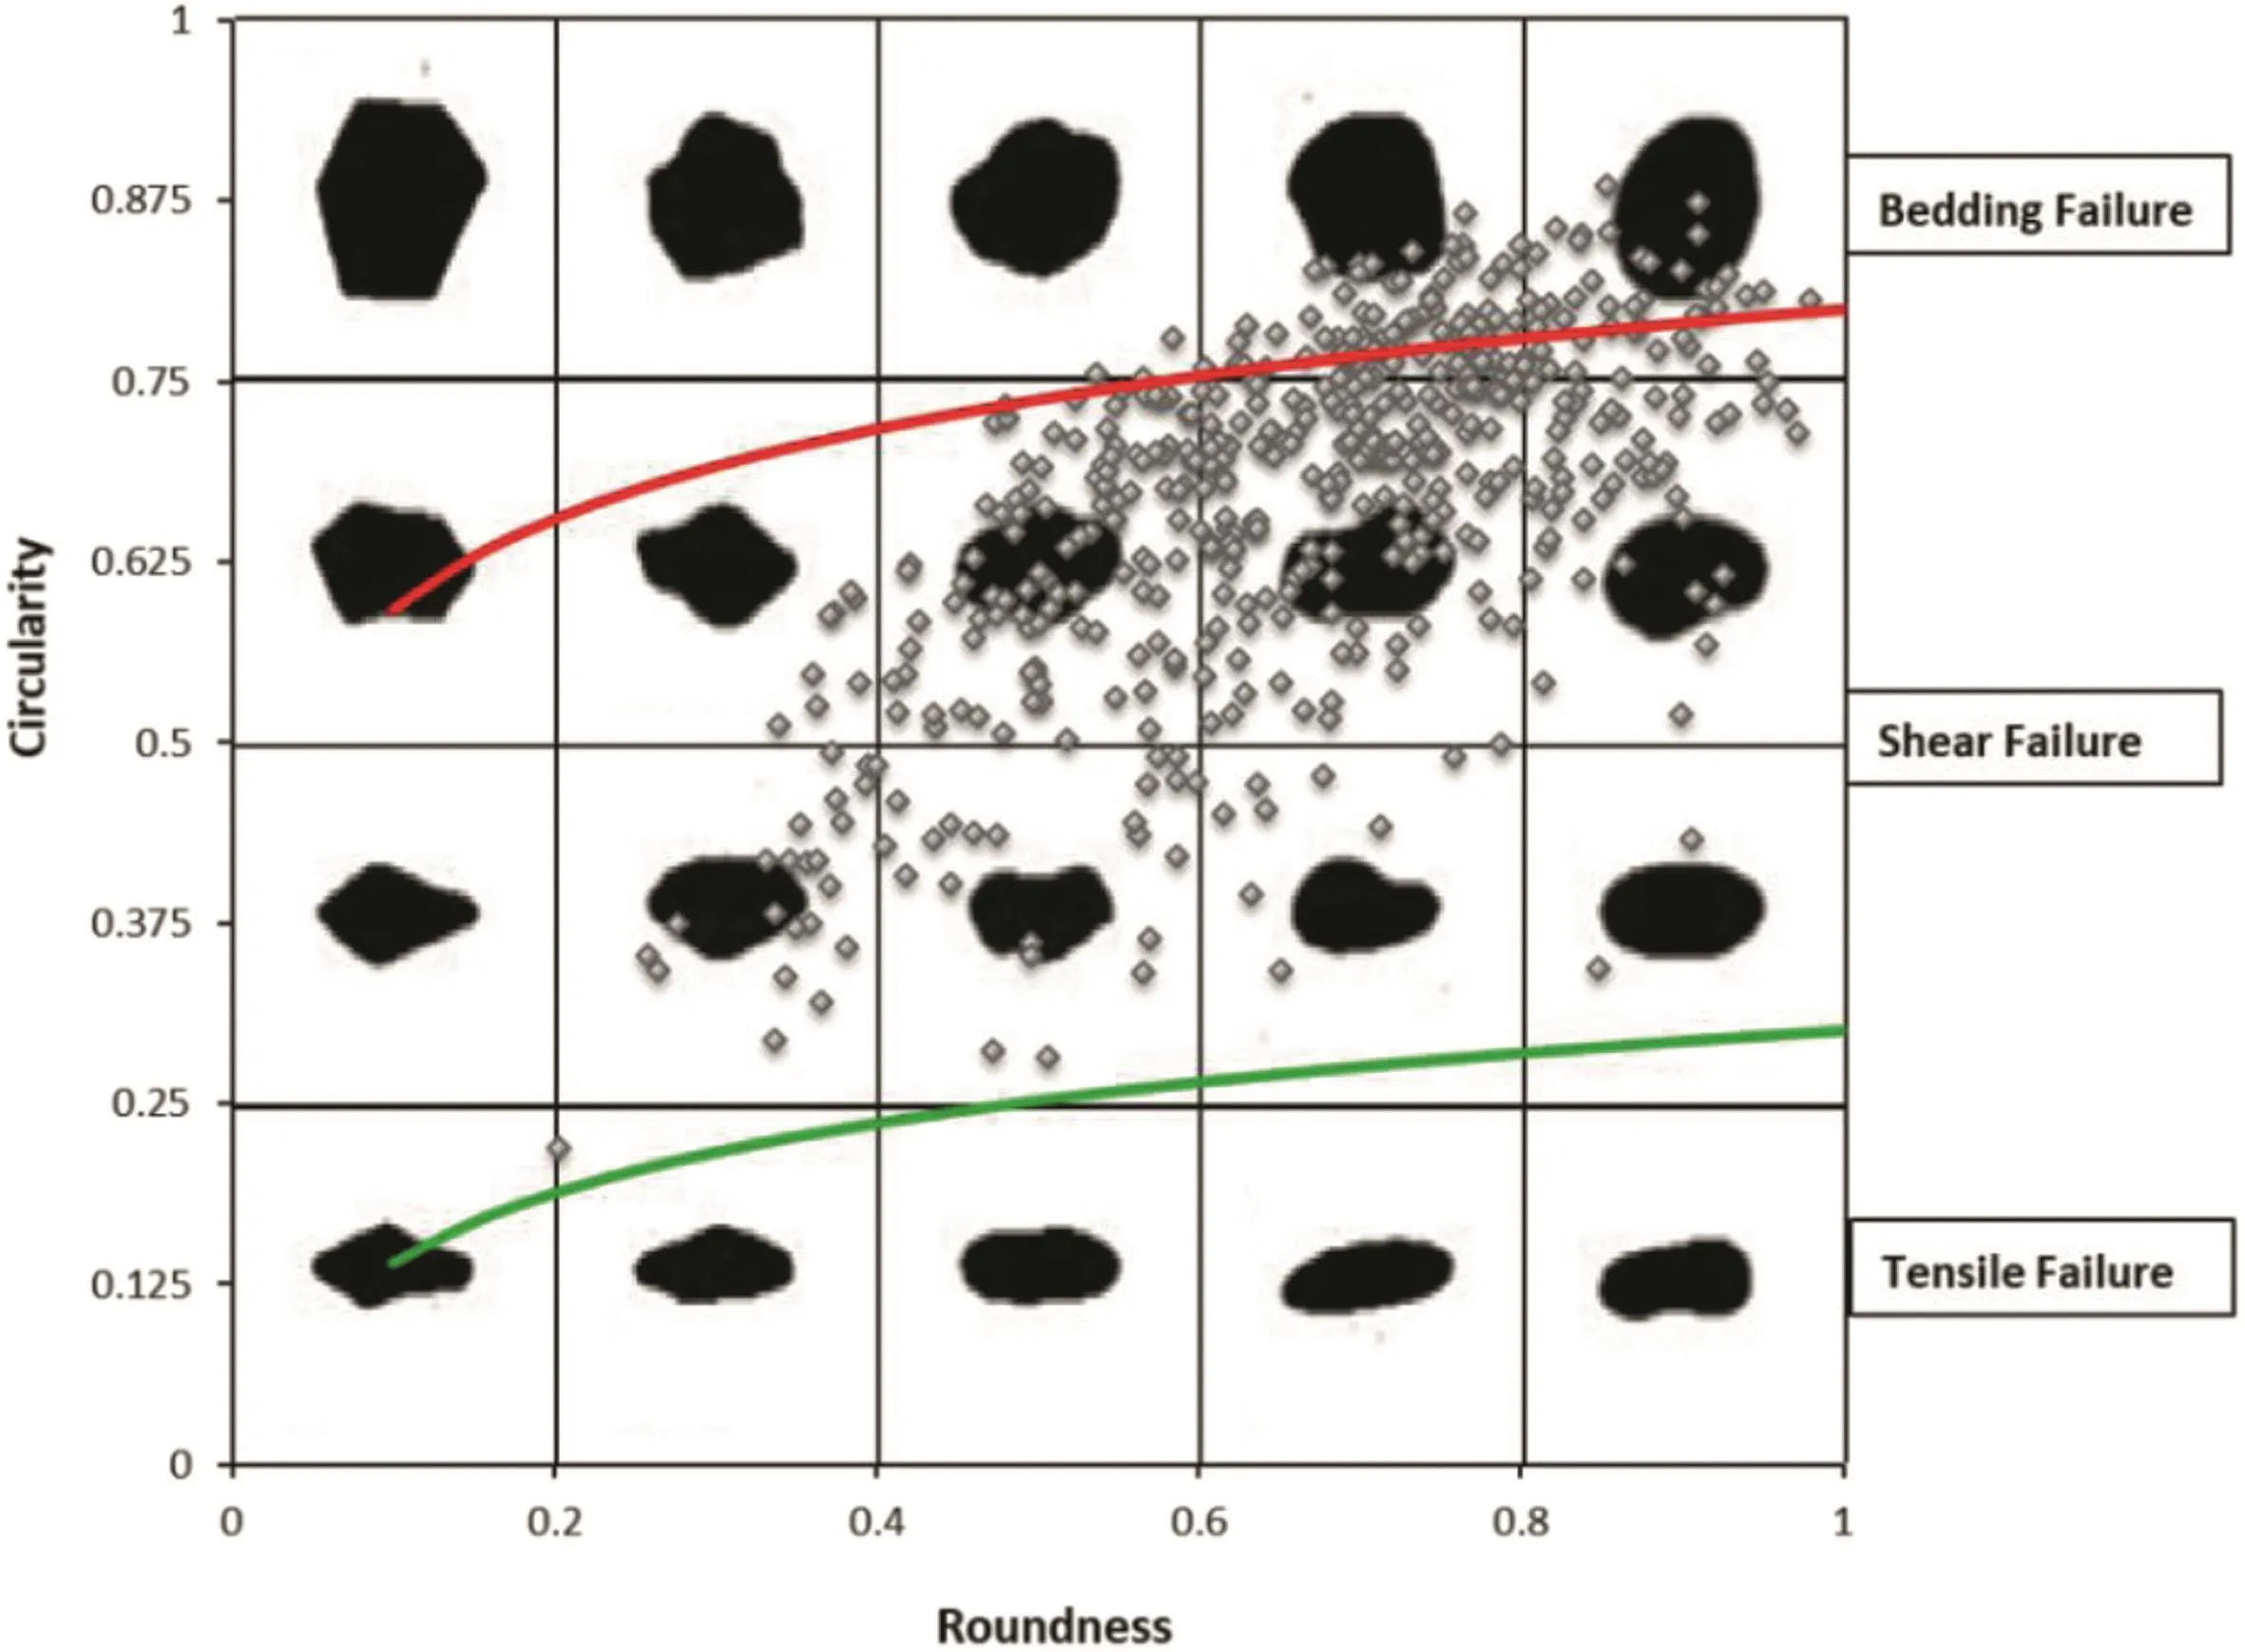
Fig.11.Graphical demonstration of the suggested relationships between failures and caving types.
2.3.4.Further caving interpretations
In this section,the summary of explanations provided earlier was used to generate a list of features for cavings,which might be useful in the characterization of failure types when certain kinds of cavings are observed at shakers.Table 2 gives these general characteristics.
It should be pointed out that the size of cavings at the surface might not be an accurate representation of their original shape due to breaking up induced by different settling velocities and reworking(BP,2008).Reductions of bottom-hole pressure may influence the type of failures on the wellbore wall in strong and weak rocks.It can also affect the kind of failures on wellbore wall in strong and weak rocks,as shown in Fig.5.In weak formations,the breakout produces a mixture of splintery and angular cavings(Halliburton,2014).
Considering these complexities,a flowchart like the one shown in Fig.6 might be useful for taking a corrective action when cavings appear at the surface.
In the next section,a case study from Western Australia is brought to show how caving analyses and image processing can be used to identify the type of wellbore failure during drilling before/without running the wireline logs.
3.Case study well
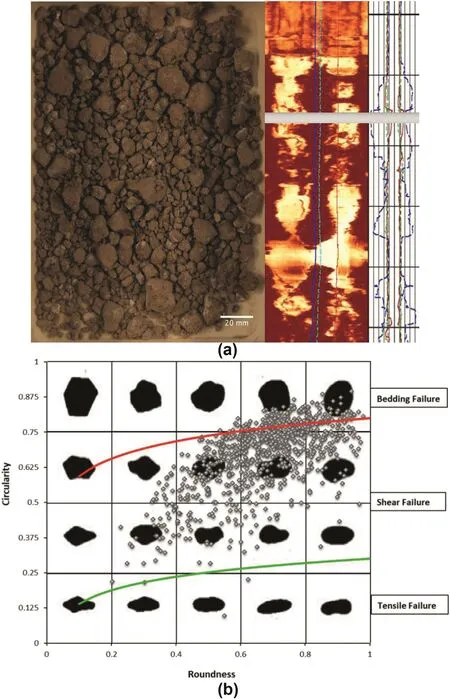
Fig.12.Distribution of cavings in the sample from depth of 1130-1135 m.
The well was drilled in the southern part of Perth Basin,Western Australia.It was drilled to a total depth of 2913.8 m TVDSS and ditch cuttings were collected at various depths.The well mainly lay in sandstone,although traces of claystone and siltstone were detected during drilling.The well completion report indicated that a 12.75′tri-cone bit was used up to a depth of 845.6 m before replacing it with an 8.5′PDC bit for the rest of the operation.The literature review suggested that the conventional PDC cutting produces cuttings with the size of 1-2 mm.According to Austin et al.(2014),solid particles larger than 2-3 mm produced from a PDC bit are often the sign of cavings.Therefore,cuttings collected from sieve No.8(2.36 mm)are considered as cavings here.On the other hand,cuttings generated by a tri-cone bit may range up to 2-3 cm in size depending on the formation hardness,making it difficult to distinguish cavings and cuttings.
This study evaluates the ditch cuttings at different depths of the well.Samples were examined not to be lumped and not to be crushed by finger or hand pressure.This ensures that samples are solid and can be considered as real cavings.Samples collected were dry-sievedusing a 2.36 mm sieve,and the weight of coarse portions was measured as listed in Table 3.
4.Image processing procedure
The image of the coarse portion of samples(cavings)was taken and imported to ImageJ software for processing.This method was to obtain quantitative data from the images including area,circularity,roundness and perimeter together with the minimum and major axis lengths of particles.
Initially,images were cropped to remove any unnecessary areas such as tray sides,identification tag and scales as shown in the left side of Fig.7.Once cropped,the image was scaled as shown in the right side of Fig.7.
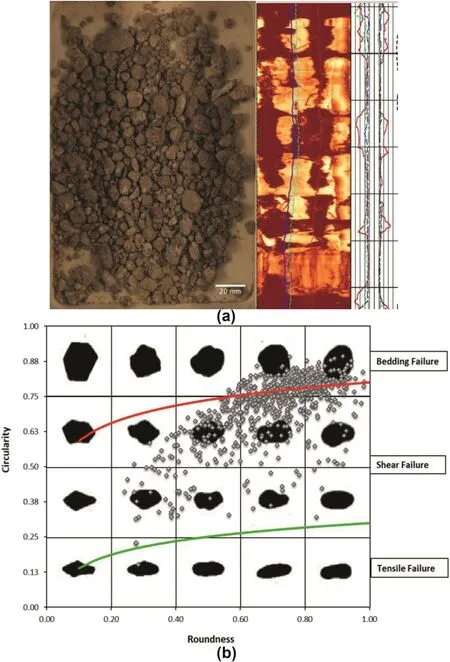
Fig.13.Distribution of cavings in the sample from depth of 1240-1245 m.
To determine individual ditch cuttings,the background of the image was subtracted.However,due to the similar color of ditch cuttings,the background subtraction was not so effective.To resolve this problem,the rolling ball radius was adjusted to maximize the definition of particle outlines.
Further processes and particles’identification were done by transformation to black and white images.Initially,the image was processed using the image threshold.To do so,an image was transformed to an 8-bit gray scale from RGB color before adding threshold values of 140-165 after tries for best visual contrast here.Empty areas of a tray were also manually eliminated.Then,the watershed method was used in each image to identify the particles individually.
It was required to control the identification of particles or segmentation of image by overlaying the original image.Fig.8 shows hairy lines due to noises in the image that could make false particles sizing.Thus,all of these lines within particles were removed.Once the editing was completed,the final images with and without overlay were obtained,as shown in Fig.9.
5.Interpretations
In this stage, results of the analysis for each sample in terms of area,shape descriptor,perimeter and fit eclipse are utilized to classify them.The minimum size of particles was set as 2.36 mm to remove small particles(cuttings),but not cavings.Classification of particles during image processing requires quantitative shape criteria. The plot shown in Fig.10 can be considered as a basis for delineation of cavings and can be developed for classification purposes.
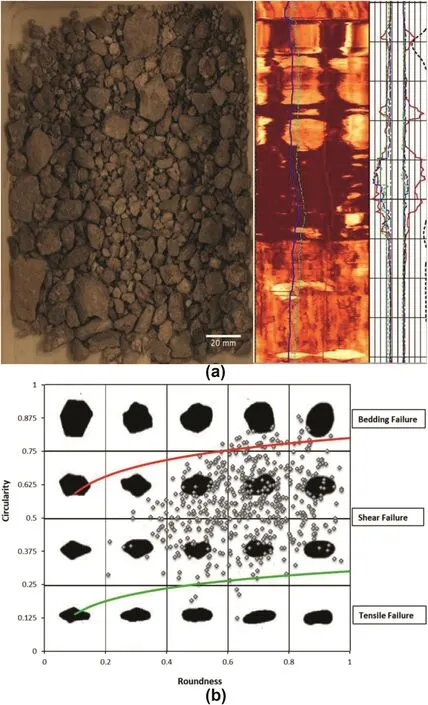
Fig.14.Distribution of cavings in the sample from depth of 1275-1280 m.
In Fig.10, roundness and sphericity are described as roughness and shape of a particle, respectively(Swanson,1981).However,descriptive terms or figures are not suitable for image processing application and definitions are essential.As such,the definitions proposed in ImageJ user’sguide(Ferreira and Rasband,2012)are selected here,where the roundness and circularity(sphericity)are respectively defined as


Circularity and sphericity seem to be similar.They are equal to 1 for perfect sphere and zero for infinitely elongated shape.There is another definition for sphericity by Tobenna(2010)as the ratio between the surface area of a sphere of the same volume and the surface area of the particle of interest.This definition has not been considered here as the images are two-dimensional.
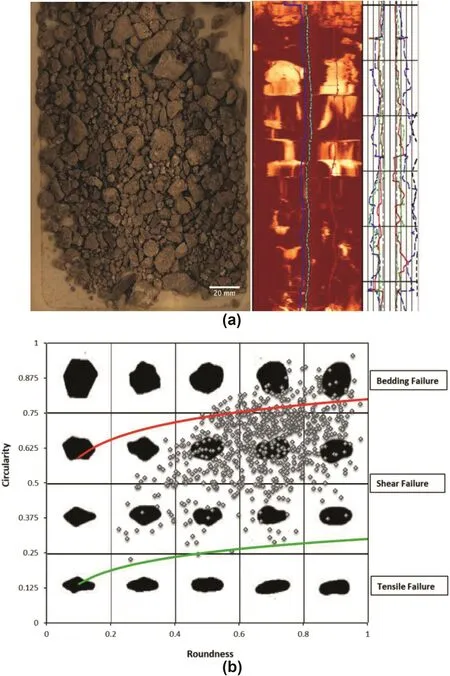
Fig.15.Distribution of cavings in the sample from depth of 1280-1285 m.
In Fig.10,the top row has mean value of 0.9 for sphericity.The shapes of the particles in this row are very close to the descriptions for tabular/blocky cavings.In a similar way,the bottom row has mean sphericity of 0.3,which more fits to descriptions for splintery cavings.Accordingly,the two middle rows seem to be descriptive of angular cavings.With image processing,the area,perimeter and length of major axis for each particle are determined.These inputs are necessary for the calculation of roundness and sphericity.They lead to the location of each particle in Fig.10.
Despite the notes above,this figure alone does not appear to be enough to make distinctions between different cavings.It is prefered to having more clear boundaries based on comparison of caving shape vs.its stress or failure condition as well.Therefore,the boundaries can be used to find out the likely cause of the failures such as tensile(splintery),shear(angular)or bedding failures(tabular/blocky).
The authors examined the scattering and distribution of cavings in Fig.10 for each sample after its image processing.The logarithmic regression curve of sphericity against roundness was determined for all samples.This curve was shifted in up and down directions in the vicinity of the top and bottom rows of Fig.10 to define approximate boundaries.The failure types of each sample were also important to consider the likely dominant cavings.In the next section,stress and failure condition of each sample are presented.
Hence,three zones are suggested by the authors for identification orclassification of cavings,as illustrated in Fig.11.As such,these zones integrate descriptive definitions,quantitive assessments and mechanical analysis exclusively.In addition to these considerations,results of acoustic images(circumferential borehole imaging log(CBIL))and caliper logs corresponding to the depths of samples are examined to include the likelihood of any caving types in adjustment of boundaries.
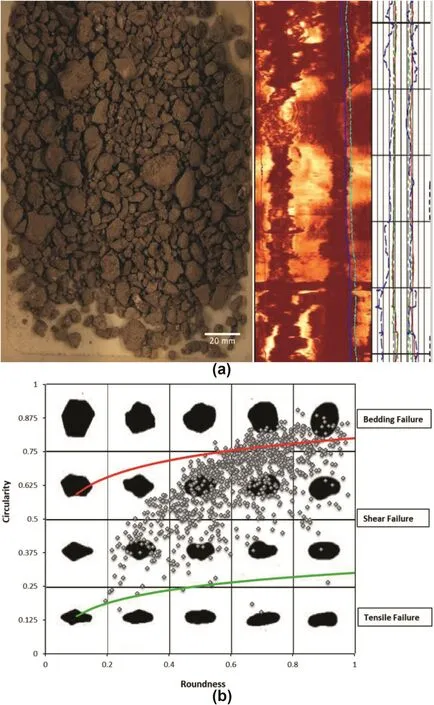
Fig.17.Distribution of cavings in the sample from depth of 1320-1325 m.
The further details of analyses are presented in Figs.12-17.They are to verify the zones suggested in Fig.11.
In Fig.12,shear failure of the wellbore is highlighted by a large number of angular cavings and evidenced by the imagelog showing breakouts.The moderate amount of blocky cavings is the evidence of complete failure of wellbore circumference shown at the bottom of acoustic log.
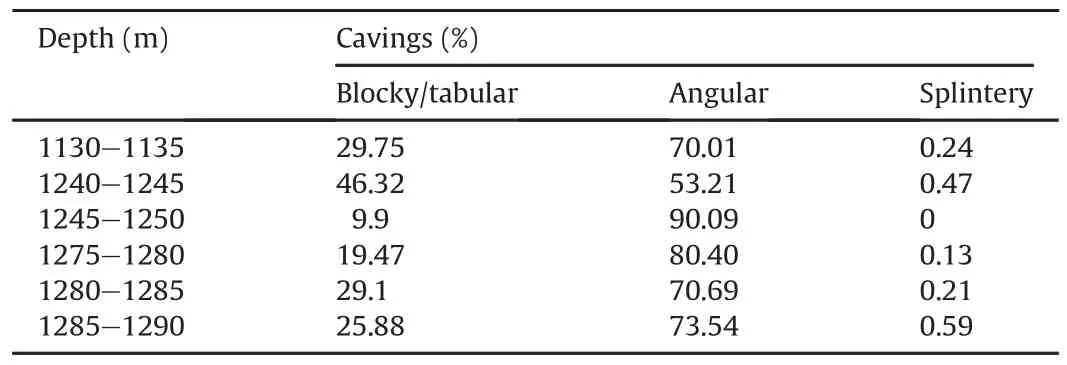
Table 4Distribution of cavings at different depths.

Table 5Failure stress analyses for some depth intervals.
Fig.13 demonstrates the shear failure of the wellbore highlighted by the cavings with angular shapes.There are also signs of cavings coming from bedding failure,which cannot be ignored.The large increase in blocky cavings can be explained by the large bedding failure shown at the top and bottom of the acoustic log.
In Fig.14,the shear failure of wellbore wall is highlighted by cavings with angular shapes.The dark region in the middle of the CBIL might be due to bedding failure,however,after image analysis,a large number of angular cavings are present in the sample tray,suggesting that there are abnormal stresses within that region,leading to massive shear failure.This is an example where acoustic log images may suggest one type of failure,but evidence from caving shapes in conjunction with image analysis describes a different type of failure.
In Fig.15,the image analysis shows that there are massive ditch particles produced from a combination of shear and bedding failures.This is supported by the CBIL image which shows shear failures as well as bedding failure within the wellbore.This demonstrates that drilling was done in underbalanced state resulting in massive wellbore failure.
In Fig.16,the shear failure of the wellbore is highlighted by cavings with angular shapes.The high density of ditch cuttings lying on the transition line between bedding and shear failures is the evidence of multiple types of failure occurring within the wellbore.Understanding this is important to the remedy problem as,although an increase in mud weight may alleviate the issues associated with shear failures,this may arise problems with regard to bedding failures.
In Fig.17,the top of the CBIL suggests a mixture of bedding and shear failures.Shear failure is the dominant mode of breakout and should be remedied as fast as possible by raising mud weight but only by small amounts so as not to induce further bedding failure.Distribution of cavings at different depth intervals is summarized in Table 4.
For failure stress calculations,the wellbore stresses corresponding to each sample and images processed above are examined versus failure criteria to find out the likely type of wellbore instabilities.The failure criterion used here is the modified Mogi-Coulomb criterion(Al-Ajmi and Zimmerman,2005),and results are listed in Table 5.
It seems that the results inTable 5 support and are in agreement with all previous findings in this paper.Shear failures are the main type of wellbore instability in this well and are the dominant root for angular cavings.
6.Conclusions
This study employed the image processing technique to examine the ditch cuttings and to identify the wellbore failure types.This method utilizes the quantitative data derived from size and shape analyses of particles from image processing.A new criterion for the classification of cavings was suggested here according to Fig.11.It is based on the frequency of different particles and integration of descriptive definitions in the literature,stress analyses and image logs(CBIL images)for considered wellbore here.
Applying Fig.11 for a typical case study,it can be considered that angular particles produced from shear failure are roughly 70%-90%of cavings.Accordingly,the remained 10%-30%consists of blocky particles produced from pre-existing fractures or weak planes.These findings are supported by caliper and CBIL image logs.Small traces of splintery particles are also present which indicate the occurrence of tensile failures.However,splintery particles can be ignored as other types are more,and it is important to solve the larger wellbore problems first to reduce costs.
Conflicts of interest
The authors wish to confirm that there are no known conflicts of interest associated with this publication and there has been no significant financial support for this work that could have influenced its outcome.
Acknowledgement
The authors owe their deepest gratitude to the technical team of Perth’s core library for giving the opportunity to investigate ditch cuttings.
 Journal of Rock Mechanics and Geotechnical Engineering2018年5期
- Journal of Rock Mechanics and Geotechnical Engineering的其它文章
- Pullout behavior of polymeric strip in compacted dry granular soil under cyclic tensile load conditions
- A comparative study between gravel and rubber drainage columns for mitigation of liquefaction hazards
- Bearing behavior and failure mechanism of squeezed branch piles
- Experimental evaluation of mechanically stabilized earth walls with recycled crumb rubbers
- Dynamic properties and liquefaction behaviour of cohesive soil in northeast India under staged cyclic loading
- Saturated anisotropic hydraulic conductivity of a compacted lateritic soil
