基于红外热像技术的汽车座椅皮革质量检测
万长青 张新敏


摘 要:针对当前汽车座椅皮革表面质量检测易受光照和皮革颜色影响等问题,笔者提出使用基于红外热像技术的汽车座椅皮革质量检测方法。本文以汽车座椅皮革为研究对象,在加热的功率、时间、角度和距离等因素下,以试件表面温度差异为目标设计均匀实验,以回归分析确定最优的实验参数,并进行迭代阈值分割处理,检测结果表明细节特征清晰。
关键词:红外热像;均匀设计;质量检测
中图分类号:U472.9 文献标识码:A 文章编号:1003-5168(2018)14-0084-02
Decision Method For Re-Design Quality
Coefficients of Waste Machine Tools
WAN Changqing ZHANG Xinmin
(School of Mechanical Engineering, Shenyang University of Technology,Shenyang Liaoning 110870)
Abstract: In view of the problem that the surface quality inspection of the automobile seat leather is easily affected by the light and the color of leather, the author proposes the use of the infrared thermal image technology to detect the quality of the leather in the car seat. This paper took the automobile seat leather as the research object. Under the factors of heating power, time, angle and distance, the uniform experiment was designed for the surface temperature difference of the specimen. The optimal experimental parameters were determined by regression analysis, and the iterative threshold segmentation was carried out. The detection results showed that the details were clear.
Keywords: infrared thermography;uniform design;quality inspection
傳统的汽车座椅皮革表面质量检测主要是靠人工完成的,朱凌云等[1]提出了一种基于视觉显著模型的检测方法;李健等[2]提出了采用改进决策树结合前馈神经网络选择最优的分类属性的方法,大大缩短了检测时间;贺福强等[3]采用小波重构的方法对皮革表面进行了缺陷检测;辛登科等[4]提出了一种可以比较准确地检测出皮革表面缺陷信息的算法。Patricio V等[5]提出了一种湿蓝皮革缺陷分类的自动检测方法。
本文提出一种基于红外热像技术的汽车座椅皮革质量检测方法,用迭代阈值分割算法处理红外热成像,实现汽车座椅皮革的质量检测。
1 实验分析
1.1 均匀实验设计
试件为汽车座椅皮革,实验中所用的红外热像仪采用专业型检测用红外热像Testo890-2。汽车座椅皮革表面温度差的各影响因素及水平见表1。
表1 温度差问题中的因素及水平
[因素 功率/kW 时间/s 距离/m 角度/° L1 0.25 2 0.02 0 L2 0.35 4 0.04 15 L3 0.45 6 0.06 30 L4 0.55 8 0.08 45 L5 0.65 10 0.10 60 L6 0.75 12 0.12 75 L7 0.85 14 0.14 90 ]
本文用均匀设计表[U774]进行实验,结果如表2所示。
1.2 实验结果分析
1.2.1 回归模型的建立。对表2的实验数据用以下模型进行回归分析:
[y=β0+m=1kβmxm+m=1kn=1kβmnxmxn] (1)
表2 均匀实验结果
[序号 功率/kW 时间/s 角度/° 距离/m 温差/℃ 1 0.25 8 60 0.12 0.5 2 0.35 2 30 0.10 0.7 3 0.45 10 0 0.08 1.8 4 0.55 4 75 0.06 1.4 5 0.65 12 45 0.04 2.8 6 0.75 6 15 0.02 2.7 7 0.85 14 90 0.14 3.2 ]
在(1)式中,[β0]、[βm]、[βmn]为回归系数,[x1]、[x2]、[x3]、[x4]分别为加热功率、时间、距离以及角度。
根据均匀实验设计的实验结果,利用均匀设计软件进行回归计算,得到的回归方程如下所示:
[y=-1.007 1+4.202 9x1+0.144 4x2-0.117 4x1×x2+0.023 7x1×x3-0.011 8x3×x4-2.038 2x23] (2)
为确认所选的模型是否合适,需进行回归诊断。进行回归诊断的主要工具是残差e,e=yc-y,回归模型的具体计算结果与实验结果见表3。
表3 回归模型的计算结果与实验结果
[序号 y yc e [(yc-y)/y]×100/% 1 0.800 0.801 0.001 0.125 2 0.400 0.399 -0.001 -0.250 3 1.400 1.409 0.009 0.643 4 1.600 1.607 0.007 0.438 5 2.600 2.603 0.003 0.115 6 2.500 2.499 -0.001 -0.040 7 3.300 3.311 0.011 0.333 ]
图1所示的实验值与回归值之间的关系曲线,直观体现了本文建立的回归方程的合理性。
[a][b
][b
][a][实验值][回归值][3.5
3.0
2.5
2.0
1.5
1.0
0.5][温度差/°C][1 2 3 4 5 6 7 ][实验序号]
图1 回归值与实验值比较
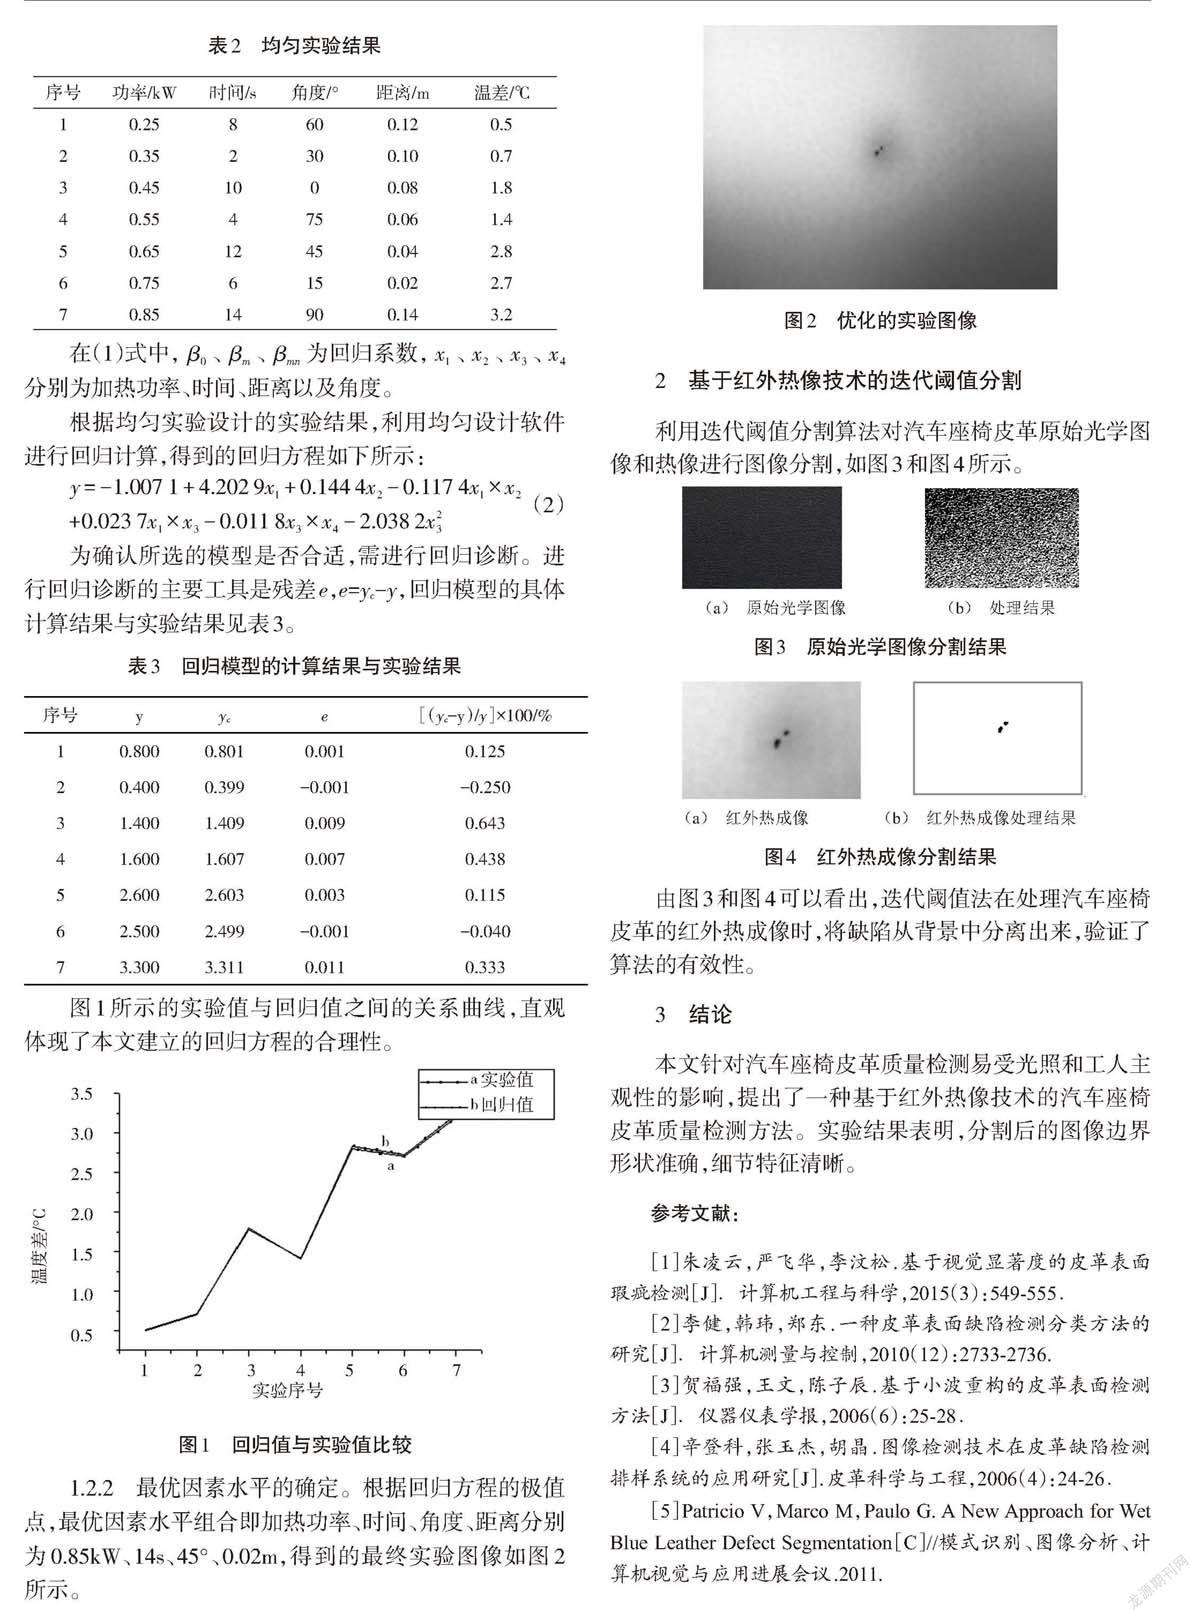
1.2.2 最优因素水平的确定。根据回归方程的极值点,最优因素水平组合即加热功率、时间、角度、距离分别为0.85kW、14s、45°、0.02m,得到的最终实验图像如图2所示。

