Estimates of the Effectiveness for Urban Energy Conservation and Carbon Abatement Policies:The Case of Beijing City,China
Junmei Hu,Gengyuan Liu,2†,Fanxin Meng
1State Key Joint Laboratory of Environment Simulation and Pollution Control,School of Environment,Beijing Normal University,Beijing 100875,China
2Beijing Engineering Research Center for Watershed Environmental Restoration&Integrated Ecological Regulation,Beijing 100875,China
3Research Center for Eco-environmental Engineering,Dongguan University of Technology,Dongguan,523808,China
4School of Environment and Energy,South China University of Technology,Guangzhou,Guangdong,510006,China
Keywords Long-Range Energy Alternatives Planning System(LEAP)model Energy conservation Carbon emission reduction Scenario analysis Beijing city
Abstract Cities play an important role in tackling climate change,as they consume close to 2/3 of the world’s energy and account for more than 70%of global green house gas emissions.To assess the effectiveness of urban energy conservation and carbon mitigation measures,a detailed Long Range Energy Alternatives Planning(LEAP)model is developed and applied to simulate a series of emission reduction measures.The developed LEAP model is also aimed at analyzing how these emission reduction measures change energy consumption and carbon emission from 2016 to 2050.Fifty scenarios were defined to describe the future energy strategies in relation to the development of Beijing city,including a ‘Business as Usual’scenario,42 sub-scenarios,4 sectoral compound scenarios and 3 system compound emission reduction scenarios.The ‘Business as Usual’scenario assumes that the government will do nothing to influence the long-term trends of urban energy demand.The 42 sub-scenarios reflect the effectiveness of singular measure including clean energy substitution,terminal technological innovation,industrial structural adjustment in three energy demand sector as well as external input of power scenario in transformation sector.Each singular measure has three A,B,C three levels,which represent different intensity of the measure.Sectoral compound scenarios show the integrated effectiveness of B-level measures which reflects the strength of the existing policy in each sector.The final effectiveness of all energy conservation and carbon mitigation measures of assorted level are presented in 3 system compound emission reduction scenarios.A further analysis of decoupling relation ship between energy consumption and economy under system compound scenarios is discussed.Results show that,in Beijing under current policy,carbon emission will rebound in 2035 and continue to grow until 2050.If the intensity of each measure are enhanced,the rebound can be avoided.Doing so,Beijing energy consumption and economic growth might become strongly decoupled by 2040.Terminal technological innovation of service industry in building sector,appropriately monitored along its development,is the most effective measure,while the transportation sector has the largest carbon emissions abatement potential.Finally,the currently planned externally transferred green power measure also shows a clear emission reduction potential.
1 Introduction
Curbing global warming and cutting carbon emissions have become the consensus of all Countries in the 21stcentury(Solomon et al.,2009;Moss et al.,2010).Carbon emissions from energy use in cities are the most important sources of greenhouse gases.With high concentrations of both population and economic activities,cities have become the hot spots for energy demand and carbon emissions(Wang et al.,2017;Basosi et al.,2017;Rosenzweig et al.,2018).In China 56%of the population live in urban areas in 2015.Moreover,150 cities accounted for 70%of China’s total CO2emissions in 2010(Liu,2016).Under rapid urbanization,Chinese residents are continually migrating from rural to urban areas.In the next two decades urban population could reach 1 billion(Bai et al.,2014).This puts tremendous pressure on energy demand and CO2emissions.Thus,Chinese cities will play a greater role in the future in supporting their Country to achieve its international and national climate goals.
Reducing carbon emissions from regulations,policies,and plans is an important part of current carbon emissions reductions in China.Scientific evaluation and analysis to assess the emission reduction potential of various measures is the basis for improving the quality of policy making(Lei et al.,2017;Liu,2016;Liu et al.,2013;Wang et al.,2017;Zhang et al.,2017).A better understanding of the effectiveness of city-level measures will help to devise a much needed integrated management framework,as well as to design and implement policies for addressing urban development,energy,and climate change concerns collectively(Su et al.,2012;Chen et al.,2017).
A large amount of existing research on urban CO2emissions modeling and projection have been done(Wang and Liu,2017;Miao,2017;Wang et al.,2017;Wang and Li,2017;Singh and Kennedy,2015).Previous CO2modeling approaches included regression models,IO model,SD model,MARKAL model,and LEAP model.Among these approaches,Long-Range Energy Alternatives Planning System(LEAP)model is the most popular way to evaluate the future energy consumption and CO2emissions due to its powerful accounting ability,which allows for an analysis rich in technological specifications and end-use details and allows the user flexibility in setting modeling parameters and data structure(Lin et al.,2010;Yu et al.,2015;Lin et al.,2018).
However,most of these studies are concentrated on one or several sectors,while having a generally larger scale of research.From the perspective of the overall urban scale,relatively few researches on energy conservation and emission reduction potential for all sectors are conducted.Handayani et al.(2017)developed and analyse four scenarios of the Java-Bali power system expansion from the base year 2015 through to 2030 using LEAP.Based on LEAP model,Kachoee et al.(2018)simulate the electricity supply and demand in Iran for the next three decades in business as usual,low-carbon and renewable energy scenarios based on various possible policies.Awopone et al.(2017)used Schwartz’s Scenario Methodology and LEAP model to examine the current electrical generation expansion plan of Ghana and compares it with proposed expansion pathways with higher penetration of Renewable Energy Technologies.Yang et al.(2017)employed a LEAP model to simulate six energy sectors-related GHG emissions in a pilot low-carbon Ningbo city,China.Fan et al.(2017)took Beijing’s public transport as an example,applying the LEAP model to analyze the energy demand and the main greenhouse gas(GHG)emissions under different scenarios during the period 2016 to 2030.Chang et al.(2017)conducted a regional power generation system modelling and optimization framework using LEAP,focusing on analysis of capacity additions for different power generation technologies,as well as energy inputs,reduction co-bene?ts and system costs in Shanghai.Besides,the detailed design of the scenarios makes this study different from other studies.
Most of the LEAP-model-based studies only set up compound scenarios and did not set multiple intensities for selection.In this study,there are a large number of scenarios and they are divided into three levels of A,B,C,which can better simulate the effects of policies.This study consists of five steps:(a)collecting information on local urban policies and measurements;(b)designing the corresponding scenarios;(c)constructing and applying the LEAP model to generate and analyze a reliable future trend of energy demands and carbon emissions in the Beijing city area from 2015 to 2050,under fifty scenarios;(d)assessing the effectiveness of various measures aimed at energy savings and carbon emission reductions;and finally(e)discussing implementation of current measures,future reduction measures,and implications for other cities.The results can provide valuable input for Beijing’s future energy planning and policy making,and it may provide some general insights on the effectiveness of urban-level energy conservation and carbon reduction for other cities as well.
2 Methodology
2.1 Model structure
This study,based on the Green Resources and Energy Analysis Tool(GREAT)framework of the Berkeley China Energy Research Institute,develops a LEAP-Beijing carbon emission scenario analysis framework,as shown in Fig.1.The framework includes four modules:Key Assumption,Demand,Transformation,and Resources.
The model considers the energy consumption and transformation sector,covering all major primary and secondary energy sources used in Beijing.The analysis spans from 2015 to 2050,considering year 2015 as the base year.The driving factors of the model include economic growth,population growth,industrial restructuring,technological progress,energy efficiency improvement and energy structure adjustment.It includes four end-use sectors:agriculture,industry,building(including energy consumption for construction activities and energy use for buildings),and transportation.According to the characteristics of each sector’s energy requirements and the availability of corresponding statistics,its sub-sectors,terminal equipment and fuel types are included in the scenario analysis.
The LEAP model we established lays the energy consumption generated by the service industry and people’s daily lives under the same directory of the building sector which is different from other studies.The above two types of activities all belong to the energy consumption of human activity.This setting is convenient to set the parameters for further scenario analyses involving residential and commercial buildings under planning.In addition,the energy transformation system in the model consists of two parts:power generation and heating,including only its conversion process,and the distribution of electricity and heat transport is included in the production and supply of electric power,gas and water part of the industry.
2.2 Calculation of energy consumption
For the energy sector,LEAP can model the energy consumption,conversion and supply under given scenarios which are represented by specific economic and technological development.
The total energy consumption is the aggregation of two parts: final energy demand and energy consumption of conversion process,as shown in Equation(1):

where EC is the total energy consumption,ED and ET are energy demand for end-use sectors and energy consumption of energy conversion processes,respectively.The secondary energy consumed for final energy demand is converted from primary energy.Thus,to avoid double counting,only the latter one is accounted.
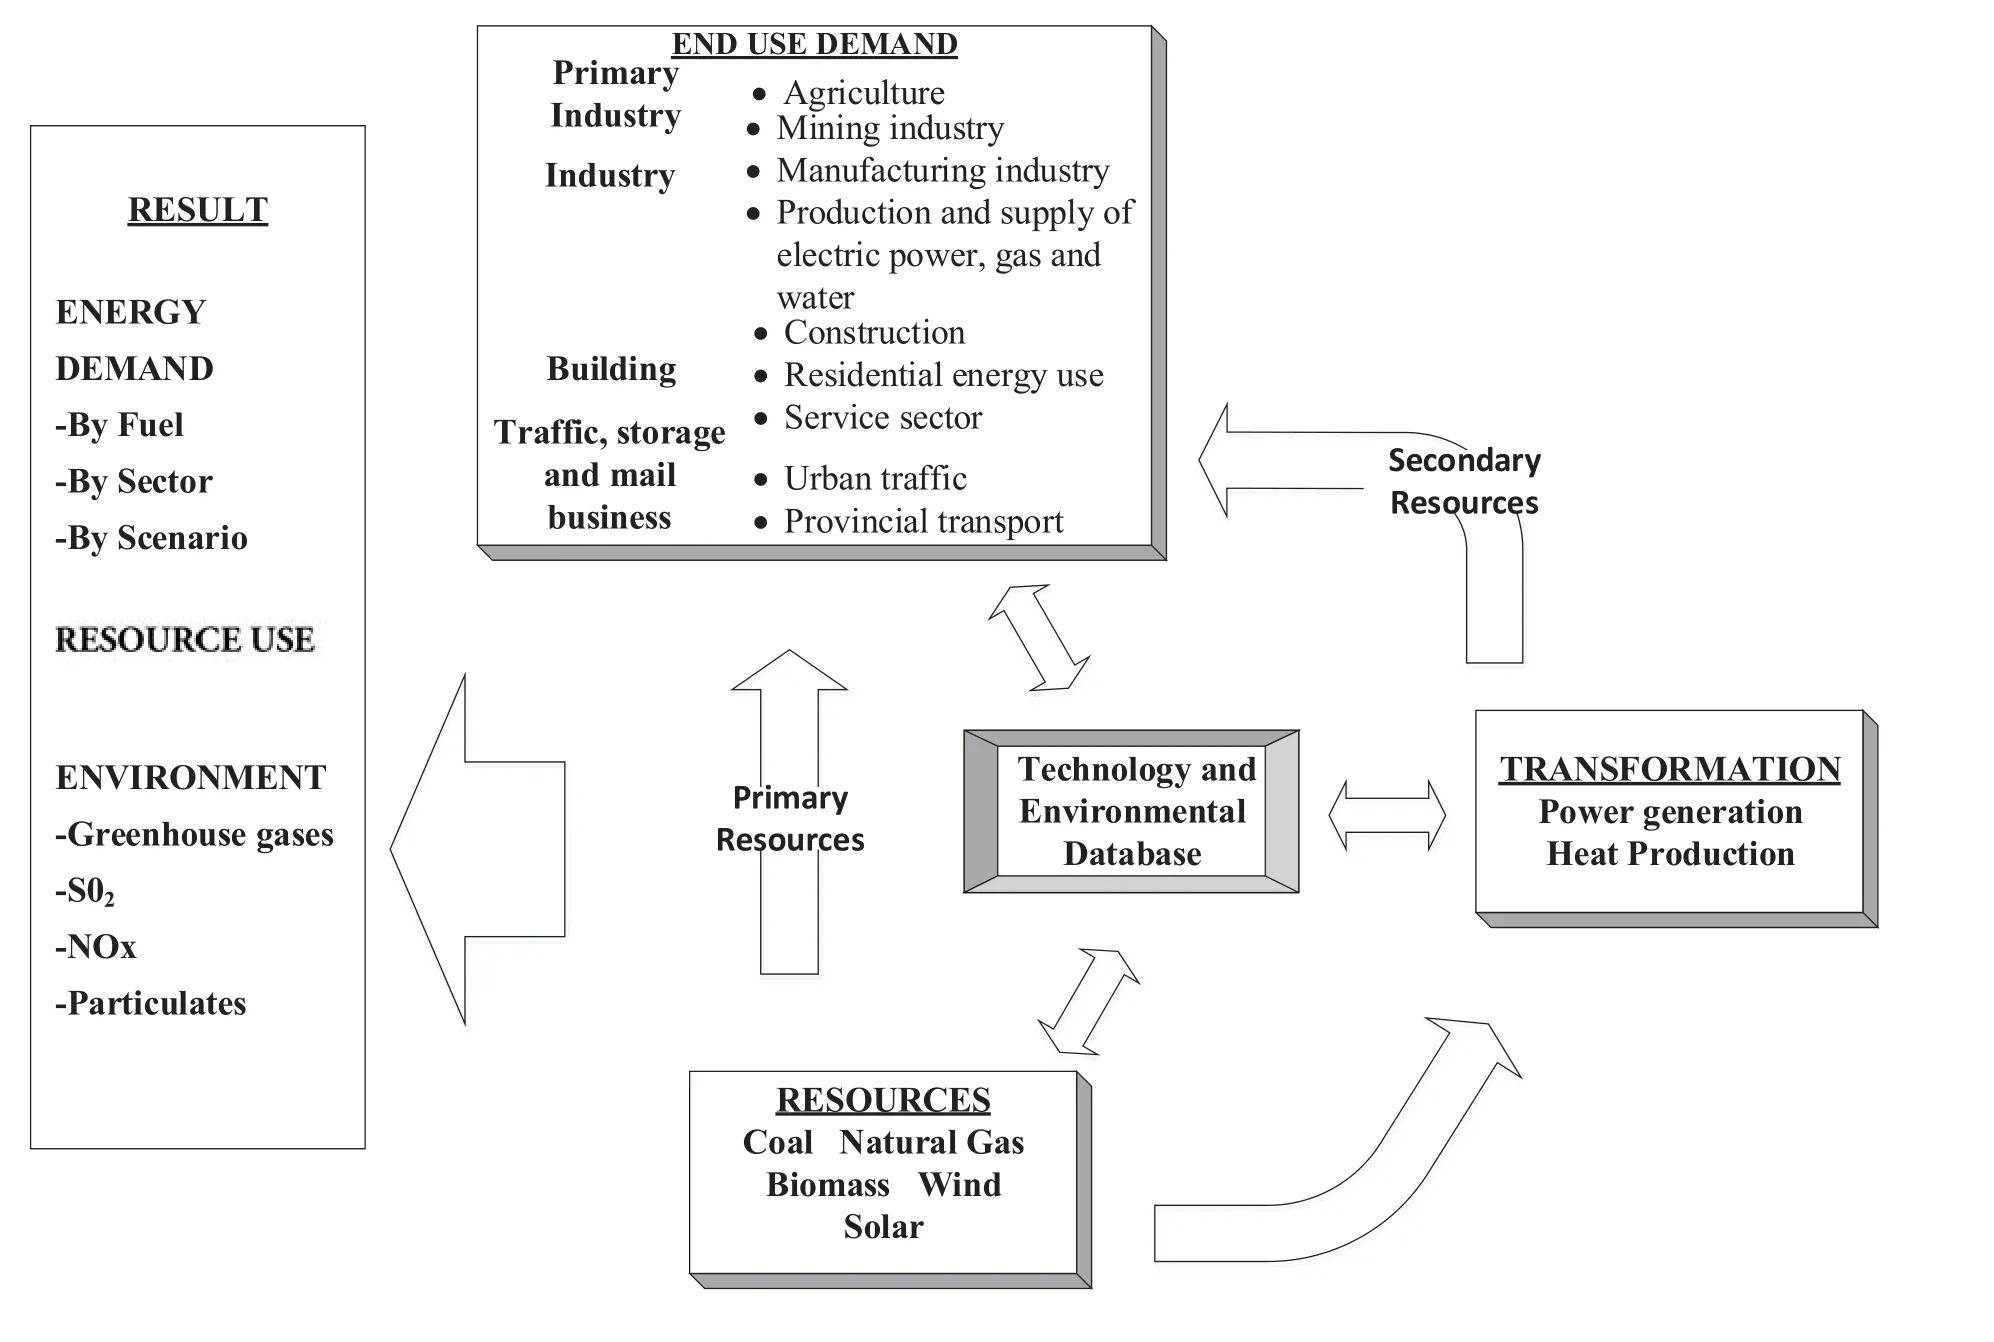
Fig.1 The overall structure of LEAP-Beijing.
The final energy demand module(ED)is generally disaggregated in a hierarchical tree of sectors and subsectors depending on data requirements,in which energy demand of these sectors are calculated from the products of activity level and energy intensity:

where AL is the activity level,EI is the energy intensity,i is sectors,j is the subsectors,and k is the type of fuel.Activity level refers to the measure of certain energy-related activities,which might include social and economic indexes such as population,GDP,number of energy users,area of land use,and others.
The energy conversion module(ET)describes how primary energy is converted into secondary energy form.The required primary energy for conversion is the function of electricity or heat generated and the conversion efficiency,of which the former is the products of installed capacity and maximum availability of the generator under the constraint of dispatch rules,and latter is the rate of the production of secondary energy and energy consumption for conversion:

where ETP is the production of secondary energy in conversion process,θis the conversion efficiency,l is the specific power plant,m and n are the type of energy consumed and produced in the conversion process respectively.
2.3 Calculation of carbon emissions
Paralleling the two components of energy consumption(i.e.:energy demand and energy transformation),also carbon emissions have two parts:emissions from energy demand and emissions from transformation.
Carbon emissions from energy demand can be calculated as follows:

where ED Emission is the GHG emissions,EFi;j;kis the GHG emission factor from fuel type k through subsector j from sector i,and EFi;j;kis drawn from statistics,the LEAP technical database.
Carbon emissions from energy transformation are calculated as follows:

where ET Emission is the GHG emissions,ETP is the energy transformation product,em;n;tis the emissions factor of producing unit secondary fuel type n from fuel type m through equipment t,and EFm;n;tis drawn from statistics,the LEAP technical database.
3 Case study
3.1 Study area and data source
Beijing is located in the North of China Plain.It is the world’s most populous capital city,having a total permanent resident population of 21.705 million in year 2015 within its municipality.The population density was about 1,323 inhabitants per square kilometer.Beijing’s gross domestic product(GDP)reached 2.3 trillion yuan in 2015,up 6.8%from 2014.Its GDP per capita was 106,034 yuan,6.9%higher than 2014.The rapid economic growth and urbanization generated rising energy consumption and carbon emissions in Beijing city.In particular,Beijing total energy consumption in 2015 was 68.5 million tons of coal equivalent,with a total electricity consumption of 95.3 billion kilowatt-hours.In 2015,Beijing’s total amount of energy-related carbon emissions were 73.1 million tons of CO2-equivalents.
Beijing has enacted the comprehensive planning for low-carbon development and energy saving.It is shown in “Beijing Energy Saving and Climate Change Planning in the 13thFive-year Period”that Beijing’s total amount of energy consumption should be controlled within 76.51 million tons of coal equivalent by 2020,while energy consumption per unit of GDP should decrease 17%compared with the value in 2015.Since 2015,the“13thFive-Year Plan”series of plans and the “Beijing Overall Planning(2016-2035)”have been promulgated.The strategy of gut the city of all functions unrelated to its status as national capital has provided new impetus and opportunities for energy conservation and emission reduction.Under a clear normalization of the transformation and development of the new normal,Beijing’s emission reduction path should change compared to the past.However,new emission reduction paths need to be clarified.This case study aims to use Beijing as an example to analyze the current situation of energy consumption and carbon emissions in this city and to predict the energy consumption and carbon emissions in Beijing over the next 30 years.Afterwards,through scenario analysis,the implementation of mitigation measures was simulated to explore the emission reduction paths and low-carbon development models of cities.
The “energy use”sub-sector data used in this study come from the Beijing Statistical Yearbook(2015).For driver variables(Gross Domestic Product of every sector,population and urbanization rate,etc.).Technical variables(energy efficiency for certain processes or terminals,the promotion rate of different fuels and the proportion of more efficient and low efficiency technology in the total activity level)are determined by the following documents:Environmental Protection and Ecological Construction Planning during“the 13thFive-Year Plan”in Beijing;Beijing Overall Planning(2016-2035);Energy Development Plan during “the 13thFive-Year Plan”in Beijing”;Energy Saving and Climate Change Responding Planning in Beijing during the “13thFive-Year”period;Civilian Building Energy-saving Development Plan in the “13thFive-Year”Period in Beijing;Traffic development and construction plan during the “13thFive-Year”period in Beijing;Beijing’s industrial transformation and upgrading plan in the “13thFive-Year”period;Major Infrastructure Development Plan during the “13thFive-year Plan”Period in Beijing;etc.The specific parameter settings in each scenario can be found in the Appendix.
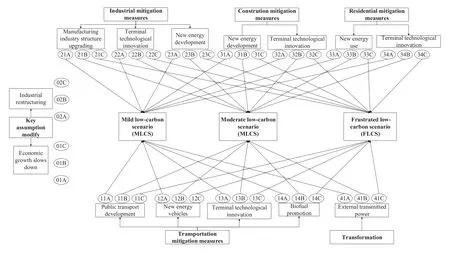
Fig.2 All scenarios setting in LEAP-Beijing.
The emission factors used in this study come directly from LEAP’s Technology and environmental database,which is based on the IPCC National Greenhouse Gas Inventories guidelines.
3.2 Scenario settings
In this study,a business as usual scenario,42 sub-scenarios,four sectoral compound scenarios and three systems of compound emission reduction scenarios,for a total of 50 scenarios,are built up.There are three levels of A,B and C in the sub-scenarios,of which the measures of level B represent the strength of the policy implemented in the current planning document.The parameter settings are derived from government planning.A-level measures represent lighter-level measures,and C-level measures represent measures that are further strengthened under the existing plans.The upper limit is set with reference to relevant research and other urban development status.Sectoral compound scenarios include industrial emission reduction measures,building emission reduction measures,and traffic-type measures.They are the result of the superposition of Level B measures in the same sector.The four system complex scenarios are a superposition of the same level of measures in 42 sub-contexts.Mild low-carbon scenario includes all A-level scenarios,Moderate low-carbon scenario includes all B-level scenarios,and Frustrated low-carbon scenario considers all C-level scenarios.The correspondence between all scenarios is shown in the figure below.
In the process of scenario analysis,a qualitative analysis of the macroeconomic and social factors,that affect energy demand,and the possible evolutionary trends in the future were developed.We quantified population development,industrial structure and sector structure on the basis of the above analysis.For the set scenario,this paper simulates the adjustment of sector structure,energy consumption structure adjustment and possible technological progress under different scenarios,trying to analyze the approach and the attainable degree of energy development in Beijing.By setting these parameters for each module under different scenarios,theenergy consumption and carbon emission paths of various sectors in Beijing under different emission reduction policies and measures can be analyzed.Key Assumption parameter settings are shown in Tables 1 and 2.

Table 1 Beijing’s economic growth rates in different development stages.

Table 2 The change in the structure of three industries in future Beijing.
3.2.1 Economic growth
Based on “Beijing 13thFive-year Planning Outline”,“Beijing Urban Mater Plan(2016-2035)”and their previous studies,the predictions of national economic growth rate made by some domestic experts and the suggestions from Beijing Municipal Commission of Development and Reform were absorbed to draw the conclusion that Beijing’s economic growth would slow down gradually.The economic growth rates set in different development stages are shown in Table 1.
3.2.2 Population
In the light of “Beijing 13thFive-year Planning Outline”and “Beijing Urban Mater Plan(2016-2035)”,the growth rate of Beijing’s population will witness a slightly dropping trend.At the end of 2015,Beijing’s permanent resident population was 21.705 million.Then,the population grew up to around 22 million in 2017 and should reach 23 million in 2020.Afterwards it is foreseen to be stable for a quite long time.
3.2.3 Industrial structure
The change in the structure of three industries,as shown in Table 2,in future Beijing refers to the research findings in Liu(2016)and the historical trend during 2005-2015.
Other parameter settings and their correspondence with the policies are shown in the Appendix Table A1.
4 Results&analysis
4.1 Total energy consumption
Figure 3 shows the changes in energy consumption over time in the Business As Usual scenario and three system compound scenarios.
Total energy consumption growth,except than for the Frustrated low-carbon scenario,which will reach its peak point in 2025,will steadily increase until 2050.With different growth rates in four scenarios,the energy consumption,under the baseline scenario,in 2050 reaches 208.62 Mtce,with an average annual growth rate of 2.97%,which is the highest of all scenarios.Duetoa series of energy conservation and emission reduction policy measures,the total energy consumption under the Mild low-carbon scenario,Moderate low-carbon scenario and Frustrated low-carbon scenario will grow at a slower pace.The average growth rates are 1.42%,0.88%,and 0.30%.As time goes on,the gap between the baseline scenario and other three scenarios,as well as the gap among the three complex scenarios,increases in terms of energy consumption.In 2020,the emission reduction ratios of the three composite emission reduction scenarios should reach 8.7%,10.9%,and 13.9%,respectively.This proportion might increase to 30.5%,36.0%and 42.0%in 2035.By 2050,the proportion of emission reductions should rise to 46.1%,52.9%,60.3%.The results show that current policies or even lighter ones can effectively reduce the city’s dependence on energy in the future.However,if Beijing wants to achieve peak point of energy consumption as soon as possible,the intensity of policies should be further adjusted.
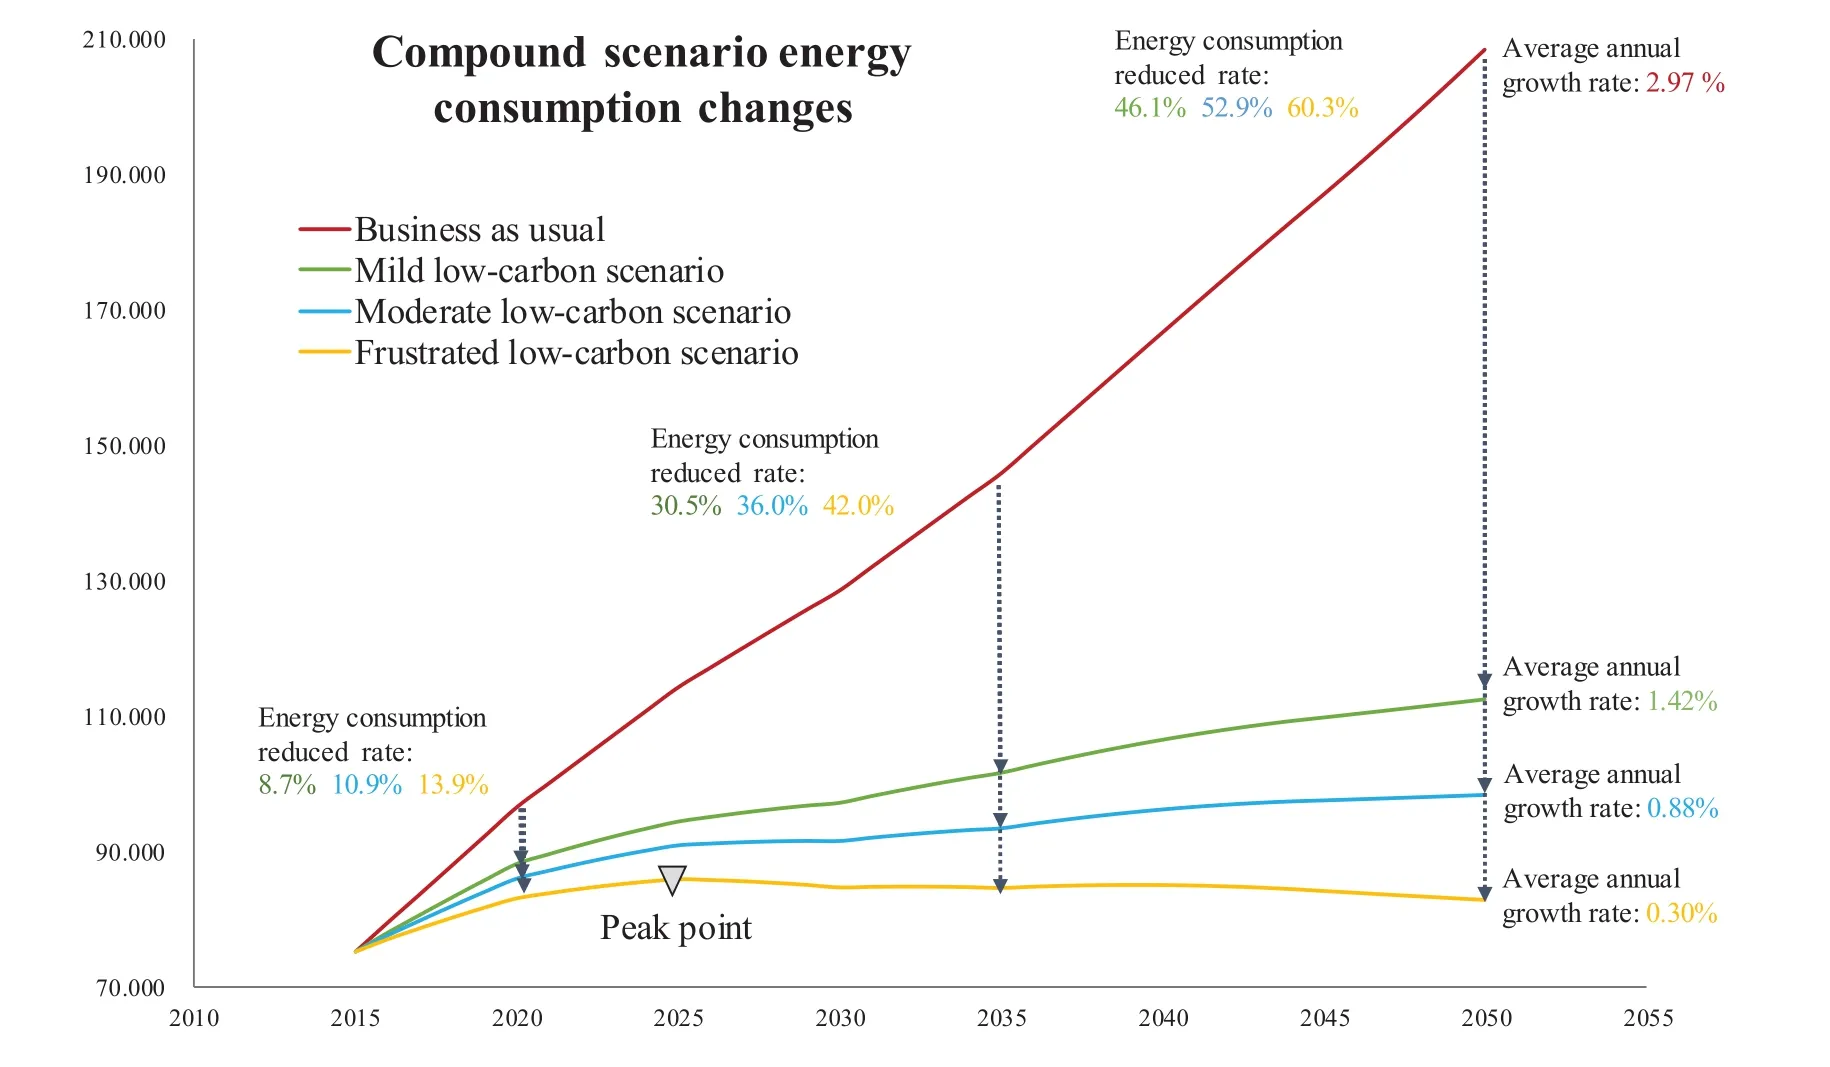
Fig.3 Compound scenarios energy consumption changes.
4.2 Reduction potential of energy consumption
The overall energy saving potential of various sectors,as well as the dispersion degree of sub-scenarios,can be obtained from Table 3.The table lists the energy consumption of each sub-scenario under the three important time nodes of 2020,2035,and 2050.The sub-scenarios,that change the key assumption,have a strong degree of differentiation.Among them,measures to slow down the economic growth show better emission reduction effects.According to the current economic growth control policy,the emission reduction ratio in 2020 will be 1.61%,rising to 6.85%and 12.34%in 2035 and 2050 respectively.If the economic growth rate is further slowed down,the emission reduction ratio can almost be twice of the current policy.For the policy of adjusting the industrial structure,its emission reduction effect is less than 3%,indicating that under the circumstance of constant economic development,the adjustment of industrial structure has little effect on energy conservation.
For the compound scenarios of the sectors,the contribution of the construction sector is the largest.Compared with the baseline scenario of the same year,the energy saving ratio in the year 2035 is 20.41%,and it rises to 30.37%in 2050.The highest contribution rate is from Building terminal technology development.This type of policy achieves energy conservation by reducing the intensity of energy consumption in energy use terminal operations.This fact proves that the service industry has become the top emission reduction direction now and even in the future.
The industrial sector follows the construction one.In 2020,the reduction rate should reach 4.60%.However,unlike the building sector,the growth rate of emission reduction is relatively slow in subsequent years.The ratios of energy saving in 2035 and 2050 are 11.69%and 18.03%respectively.In particular,the industrial sector is still one of most relevant sectors for reducing emissions in the future.Finally,it is the traffic sector.In threenode years,the energy saving ratio of this sector is below 5%,and the sub-situation energy consumption curve is also relatively concentrated,which proves that there is still greater emission reduction potential in the future.
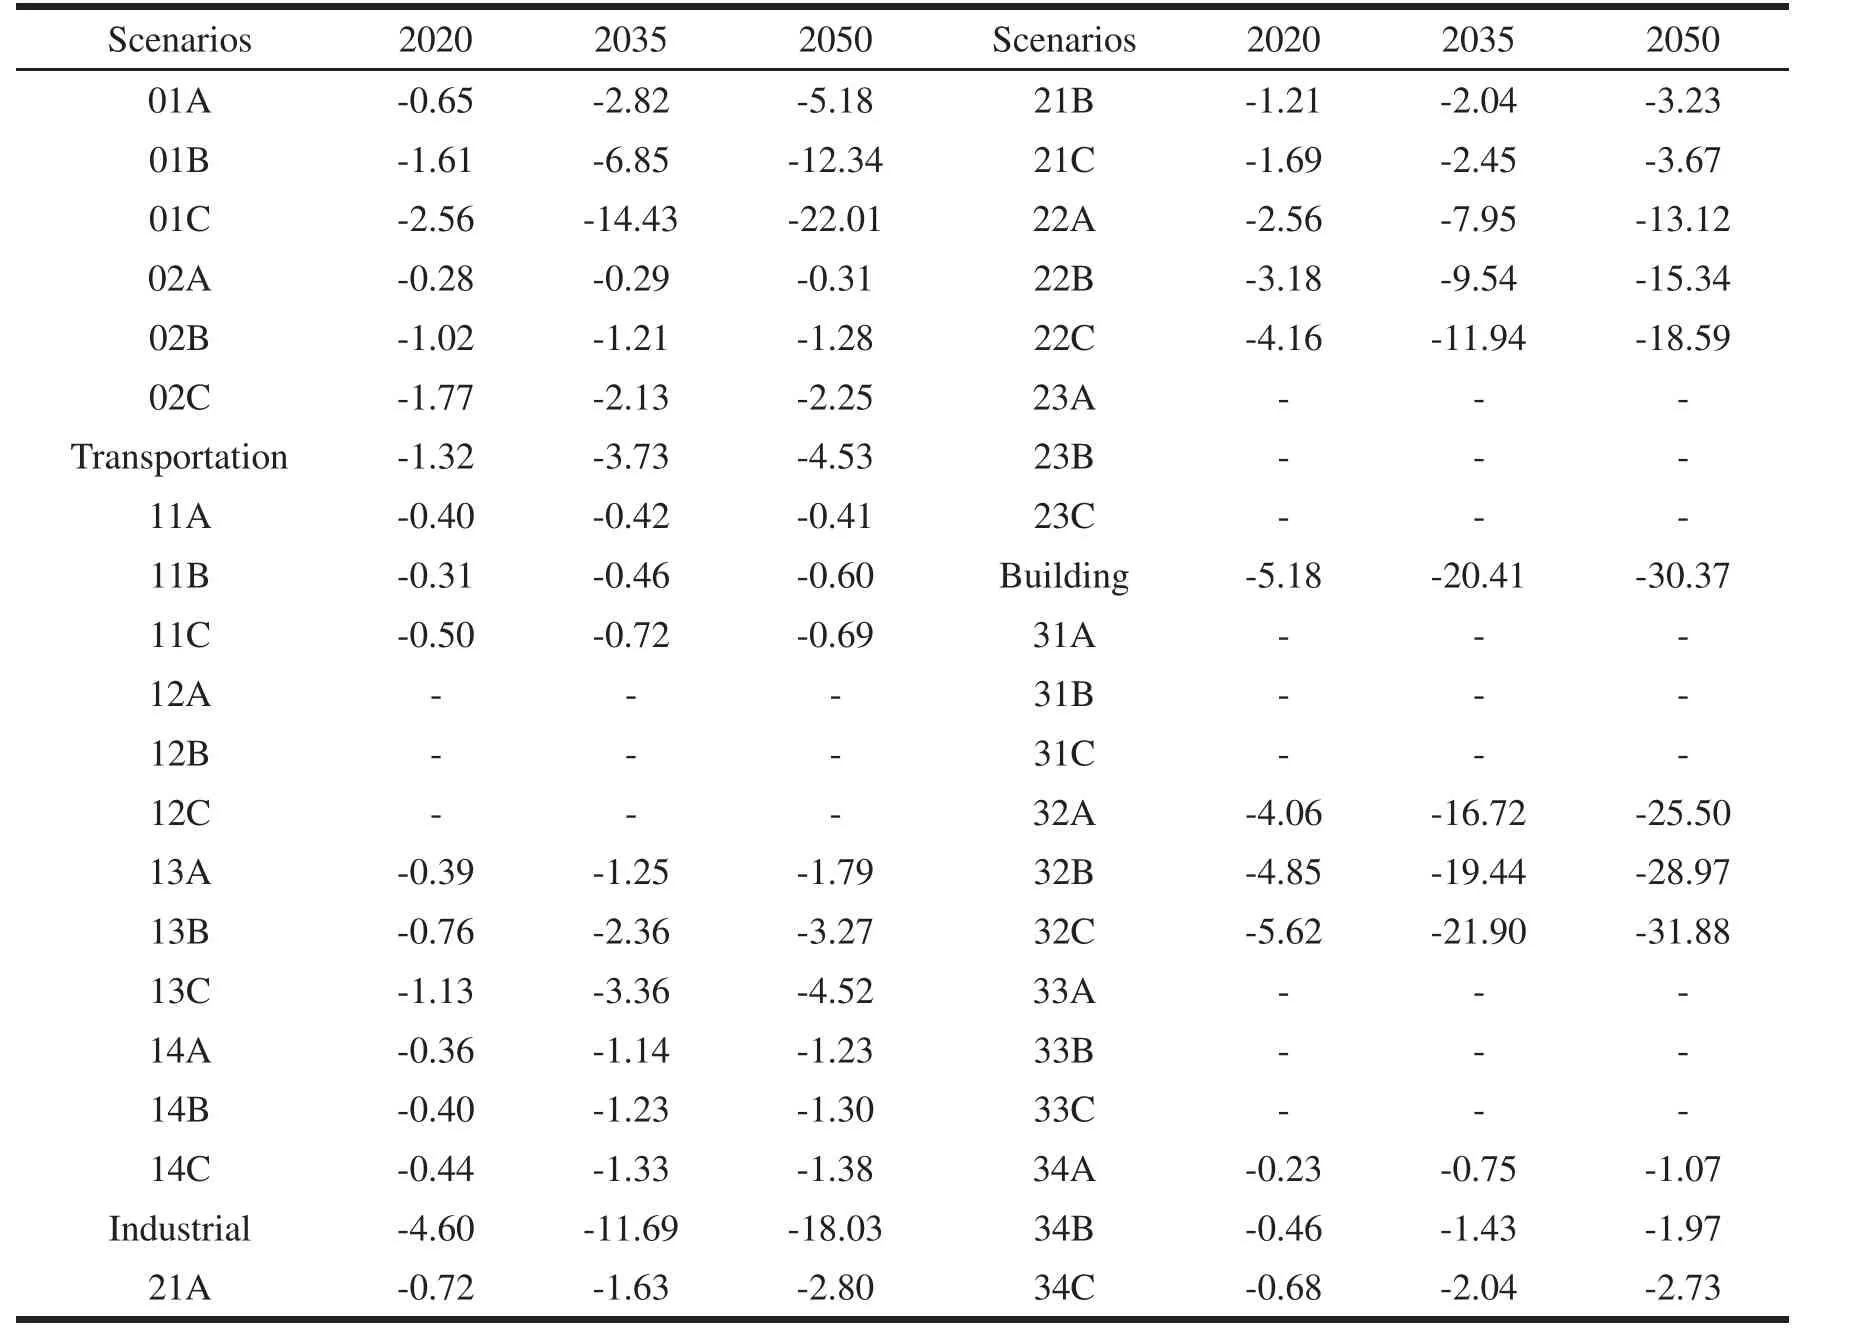
Table 3 Sub-scenarios energy consumption changes.
4.3 The decoupling relationship between energy consumption and economy
In the development process of Beijing,economic growth relied much on energy consumption.In the future,the government hopes to change the mode of economic development,achieving a decoupling of economic development from energy consumption.This goal has also been reflected in the planning.Calculations have been done to check the relationship of economic development assumption and energy consumption result in our model.According to the study of Tapio(2005),the decoupling relationship between energy consumption and economy can be calculated through the value of Tapio index(as shown in Equation(6),the elastic coefficient of economic growth and energy consumption)to determine the relationship between energy consumption and economy.

where e(E,GDP)is the decoupling level of Beijing’s energy consumption and CO2emissions.Different e(E,GDP)values indicate different decoupling statuses.
The decoupling statuses can be categorized into three categories,and then further divided into eight subcategories,as presented in Figure 4.In order not to over interpret slight changes as significant,the±20%variation of the elasticity values around 1.0 is here still regarded as coupling.Hence,0.8 and 1.2 are two important numbers for setting the boundary of decoupling statues.
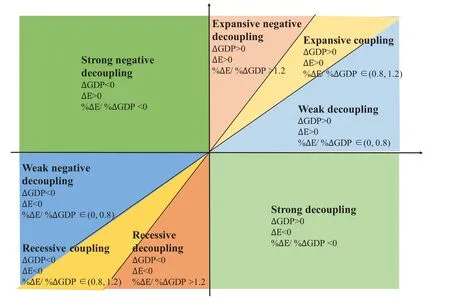
Fig.4 The degrees of coupling and decoupling of energy consumption(ΔE)from economic growth(ΔGDP).
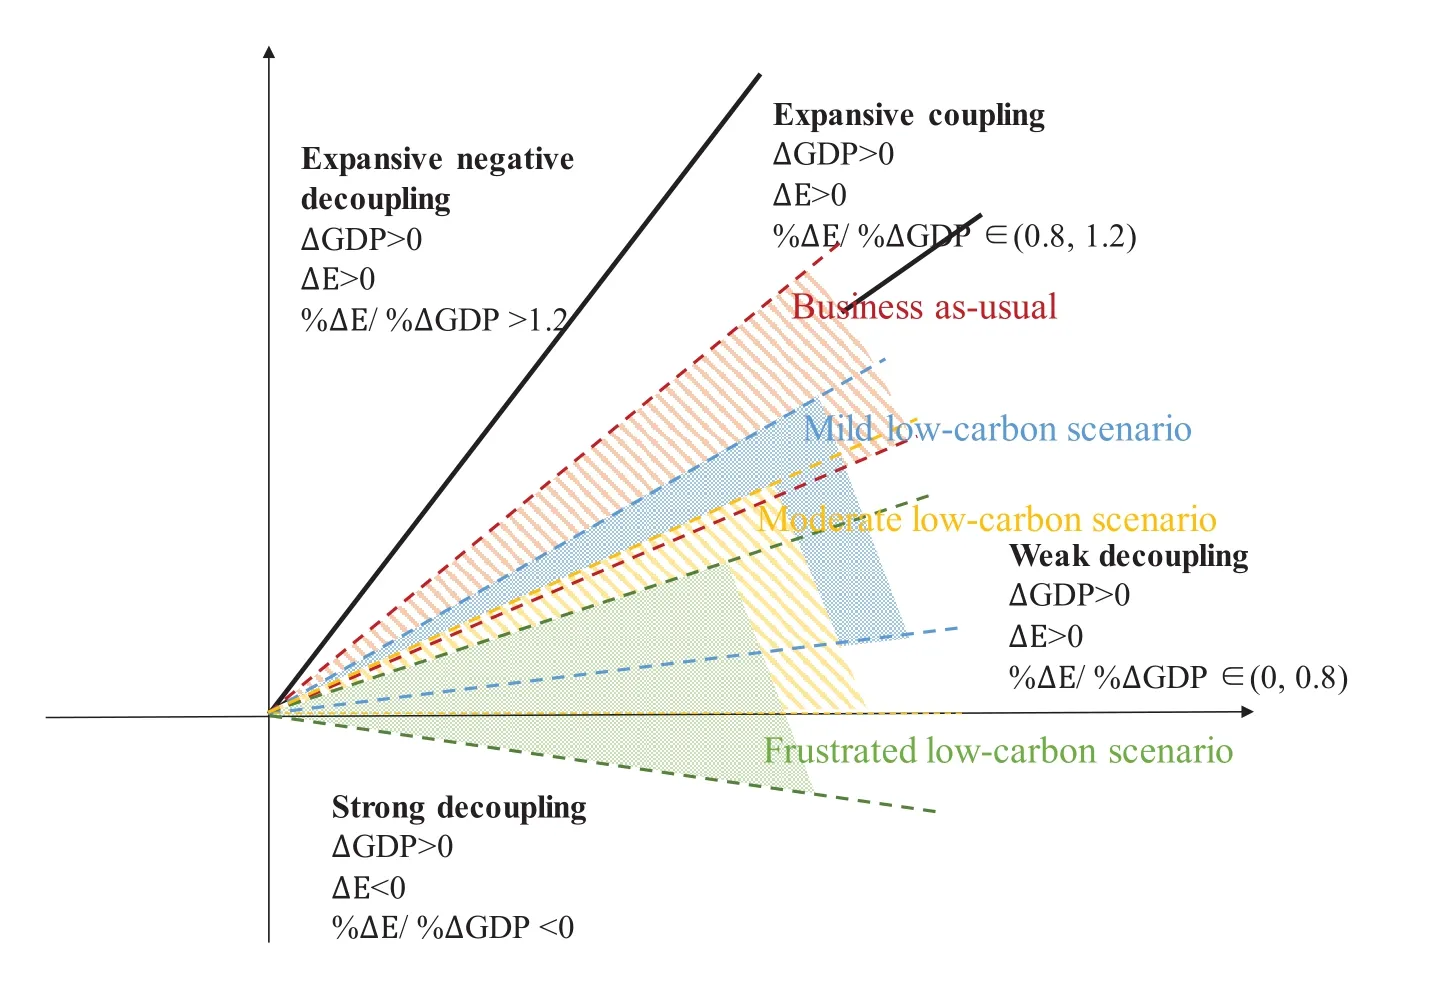
Fig.5 Decoupling situations under compound scenarios.
Figure 5 represents the value of Tapio index of energy consumption and GDP under different scenarios in Beijing.The value of the index changes over time from 2015 to 2050.The range of values corresponds to the shade of different colors in the figure.The area in red in the figure represents the range of values of the decoupling coefficient in the baseline scenario.Blue,yellow,and green are Mild low-carbon scenarios,Moderate low-carbon scenarios,and Frustrated low-carbon scenarios,respectively.Two black rays represent the critical value of different decoupling states.
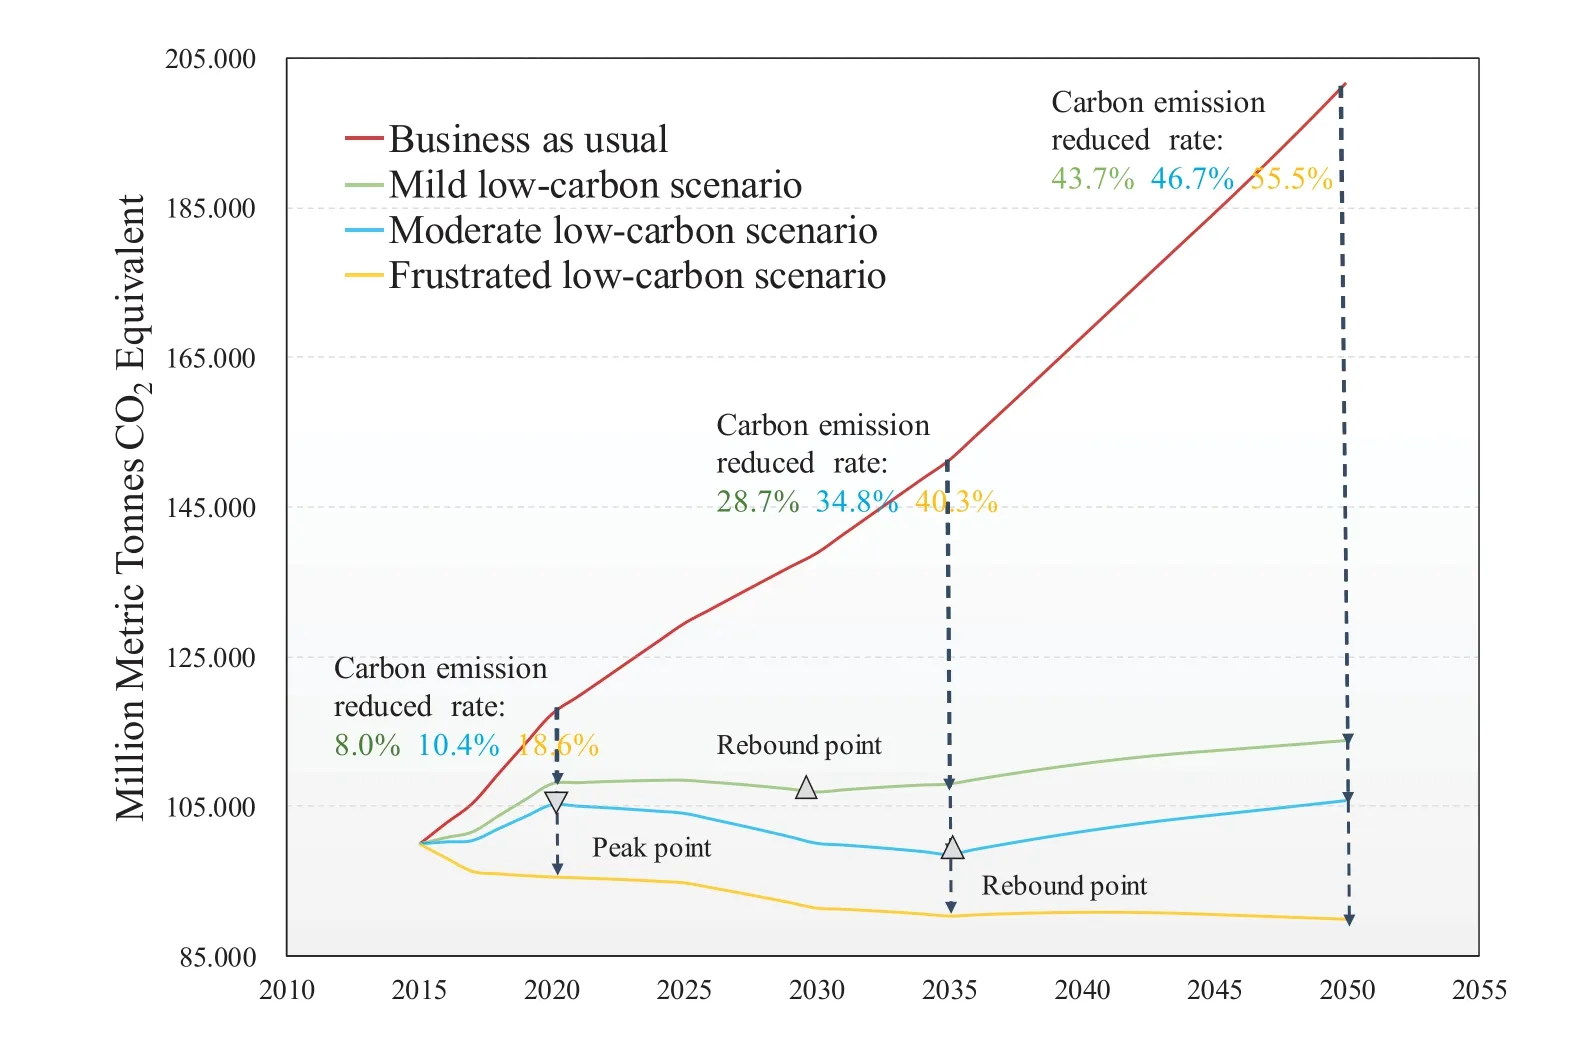
Fig.6 Compound scenarios carbon emission changes.
Under the Business As Usual scenario,the energy consumption elasticity coefficient ranges from 0.466-0.886,of which the average elasticity coefficient is greater than 0.8 in 2015-2020 and 2040-2050,indicating that economic development will still rely heavily on energy.Under Mild low-carbon scenario and Moderate low-carbon scenario,after 2025 the elastic coefficient value has stabilized below 0.3,and the whole is in a weak decoupling state.Finally,under the Frustrated low-carbon scenario,the elastic coefficient of the elastic coefficient in 2025-2030 and 2040-2050 is less than zero,and it is in a strong decoupling state.This means that under the high-intensity policy scenario,Beijing will achieve strong separation between stable economic growth and energy consumption.
4.4 Total carbon emissions
From the perspective of compound scenario carbon emissions,the three low-carbon scenarios do reduce carbon emissions compared to the baseline scenario.However,the trend of the three curves is different.As shown in Figure 6,the carbon emissions under the Mild low-carbon scenario have been relatively flat,falling after a brief peak in 2025,and steadily rising since 2029.Under Moderate low-carbon scenario,although its energy consumption has continued to rise after 2015,its carbon emissions reaches an instant peak point in 2020 and falls down since then but return to grow in 2035 and continue to grow until 2050.Total carbon emissions will reach 105.73 million metric tonnes,which is 46.7%of the baseline scenario.This shows that even after the current policy adjustment or lighter-level policy control,Beijing’s carbon emissions are still likely to rebound after a peak point.It indicate that the abatement benefits brought about by other policies still cannot offset the pulling effect of economic growth on emissions.Under different strengths of the policy set,the timing of carbon emissions rebound in Beijing is also different.If Beijing wants to avoid such a rebound in carbon emissions,further adjustments is required.In Frustrated low-carbon scenario,carbon emissions continue to decline without a rebound,and its carbon emissions are predicted to be 55.5%of the baseline scenario by 2050,reducing carbon emissions by more than half.
4.5 Reduction potential of carbon emissions
The four figures contained in Figure 7 show the carbon emissions of Beijing in the next 35 years under 36 subscenarios.The purple lines in the last three graphs of Figure 7 represent the compound scenarios of three sectors.As mentioned above,they are obtained by superimposing B-level scenarios of different policies.
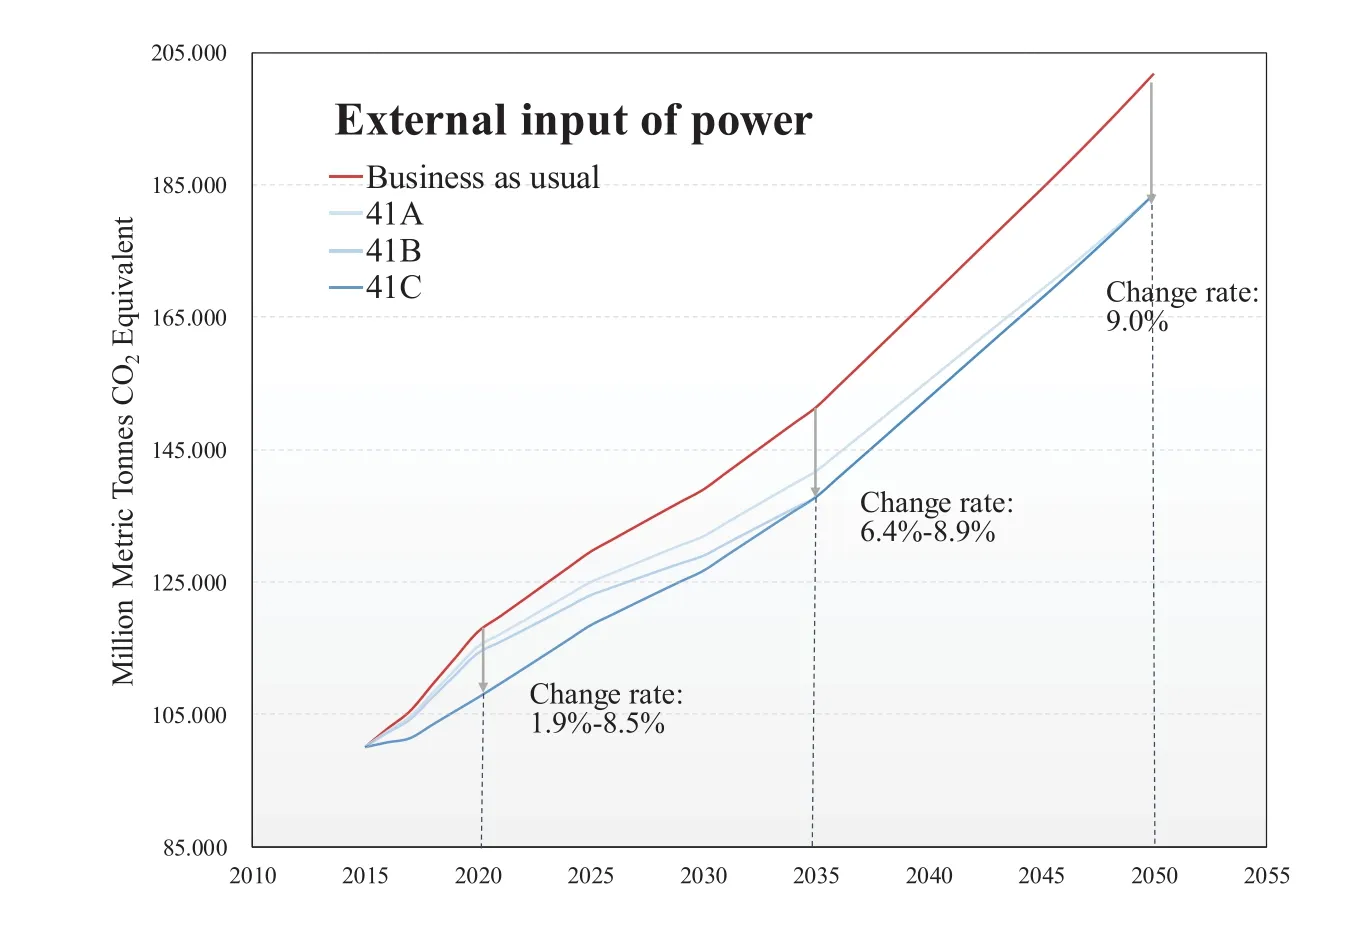
Fig.7 Carbon emission change in external input of power scenario(41A-41C).
For different types of sub-scenarios,the differences of emission reduction effects among policies increase with time.In the top-left graph of Figure 7,for the scenarios of changing key assumption,the two major subscenarios show differences.In the scenarios of economic growth slowdown,the impact of adjusting intensity of GDP growth on the model results is quite different.The carbon emission reduction is between 13.66%and 3.21%of the 2050 baseline scenario.The industrial structure adjustment measures brought about by the emission reduction effect is relatively small and more concentrated,the proportion of emission reduction between 0.28%-2.54%.
The second figure shows the carbon emissions scenario of the transportation sector.From the coverage of sectoral emission reduction effects in the sector,compared with other sectors,the distribution of transportation emission reduction sub-scenarios is more concentrated and uniform.In 2035,the esteemed amount of carbon emission reductions is 0.3%to 6.5%with respect to the baseline scenario for the same year.The innovation of automotive engine technology is one of the policies with the greatest potential for emission reduction.Together with the decline in energy intensity,this could further regulate the amount of carbon emissions.
The reduction in carbon emissions from industrial emission reduction measures is between 0.6%and 9.9%of the 2035 baseline scenario.What needs to be emphasized is that within the building and transportation sector,even if the intensity of policy implementation is increased,the effect of a single measure of emission reduction is still not as good as that of the current policy.However,under the scenario of the manufacturing industry technology development(22C),the effect of emission reduction exceeds that of the compound industrial sector.Such policies worth further research and analysis.
The sub-scenarios of building emission reduction measures are more evenly distributed.In 2035,the emission reduction in the same year was between 0.5%and 9.7%.If compared with the emission reductions in the industrial sector,the potential of the building sector is not as good.However,as mentioned above,the energy saving potential of the construction sector is greater than that of the industrial sector.It has been proved that for the industrial sector,the adjustment of the energy structure is an important reason for achieving emission reductions.Scenarios 23A,23B,and 23C have significant emission reduction effects,which con firmed this point of view again in sub-situation analysis of the industrial sector.
Scenarios for the newly proposed external green electricity policy are also included in this study.Results show that the currently planned externally-controlled green power measures have excellent emission reduction effects compared to other measures before 2030.However,their emission reduction effect is weaker than that of industry after 2035.Under the current policy intensity,from 2015 to 2050,the external green power policy can reduce 378.30 million metric tonnes CO2equivalent cumulatively,while the new airport and other major infras-tructure construction at the same time new carbon emissions is 370.27 million metric tonnes CO2equivalent.Under the strategic background of the coordinated development of Beijing,Tianjin,and Hebei,the reduction of carbon emissions from the transfer of green electricity measures can completely offset the additional energy consumption of major infrastructure projects such as the new airport.
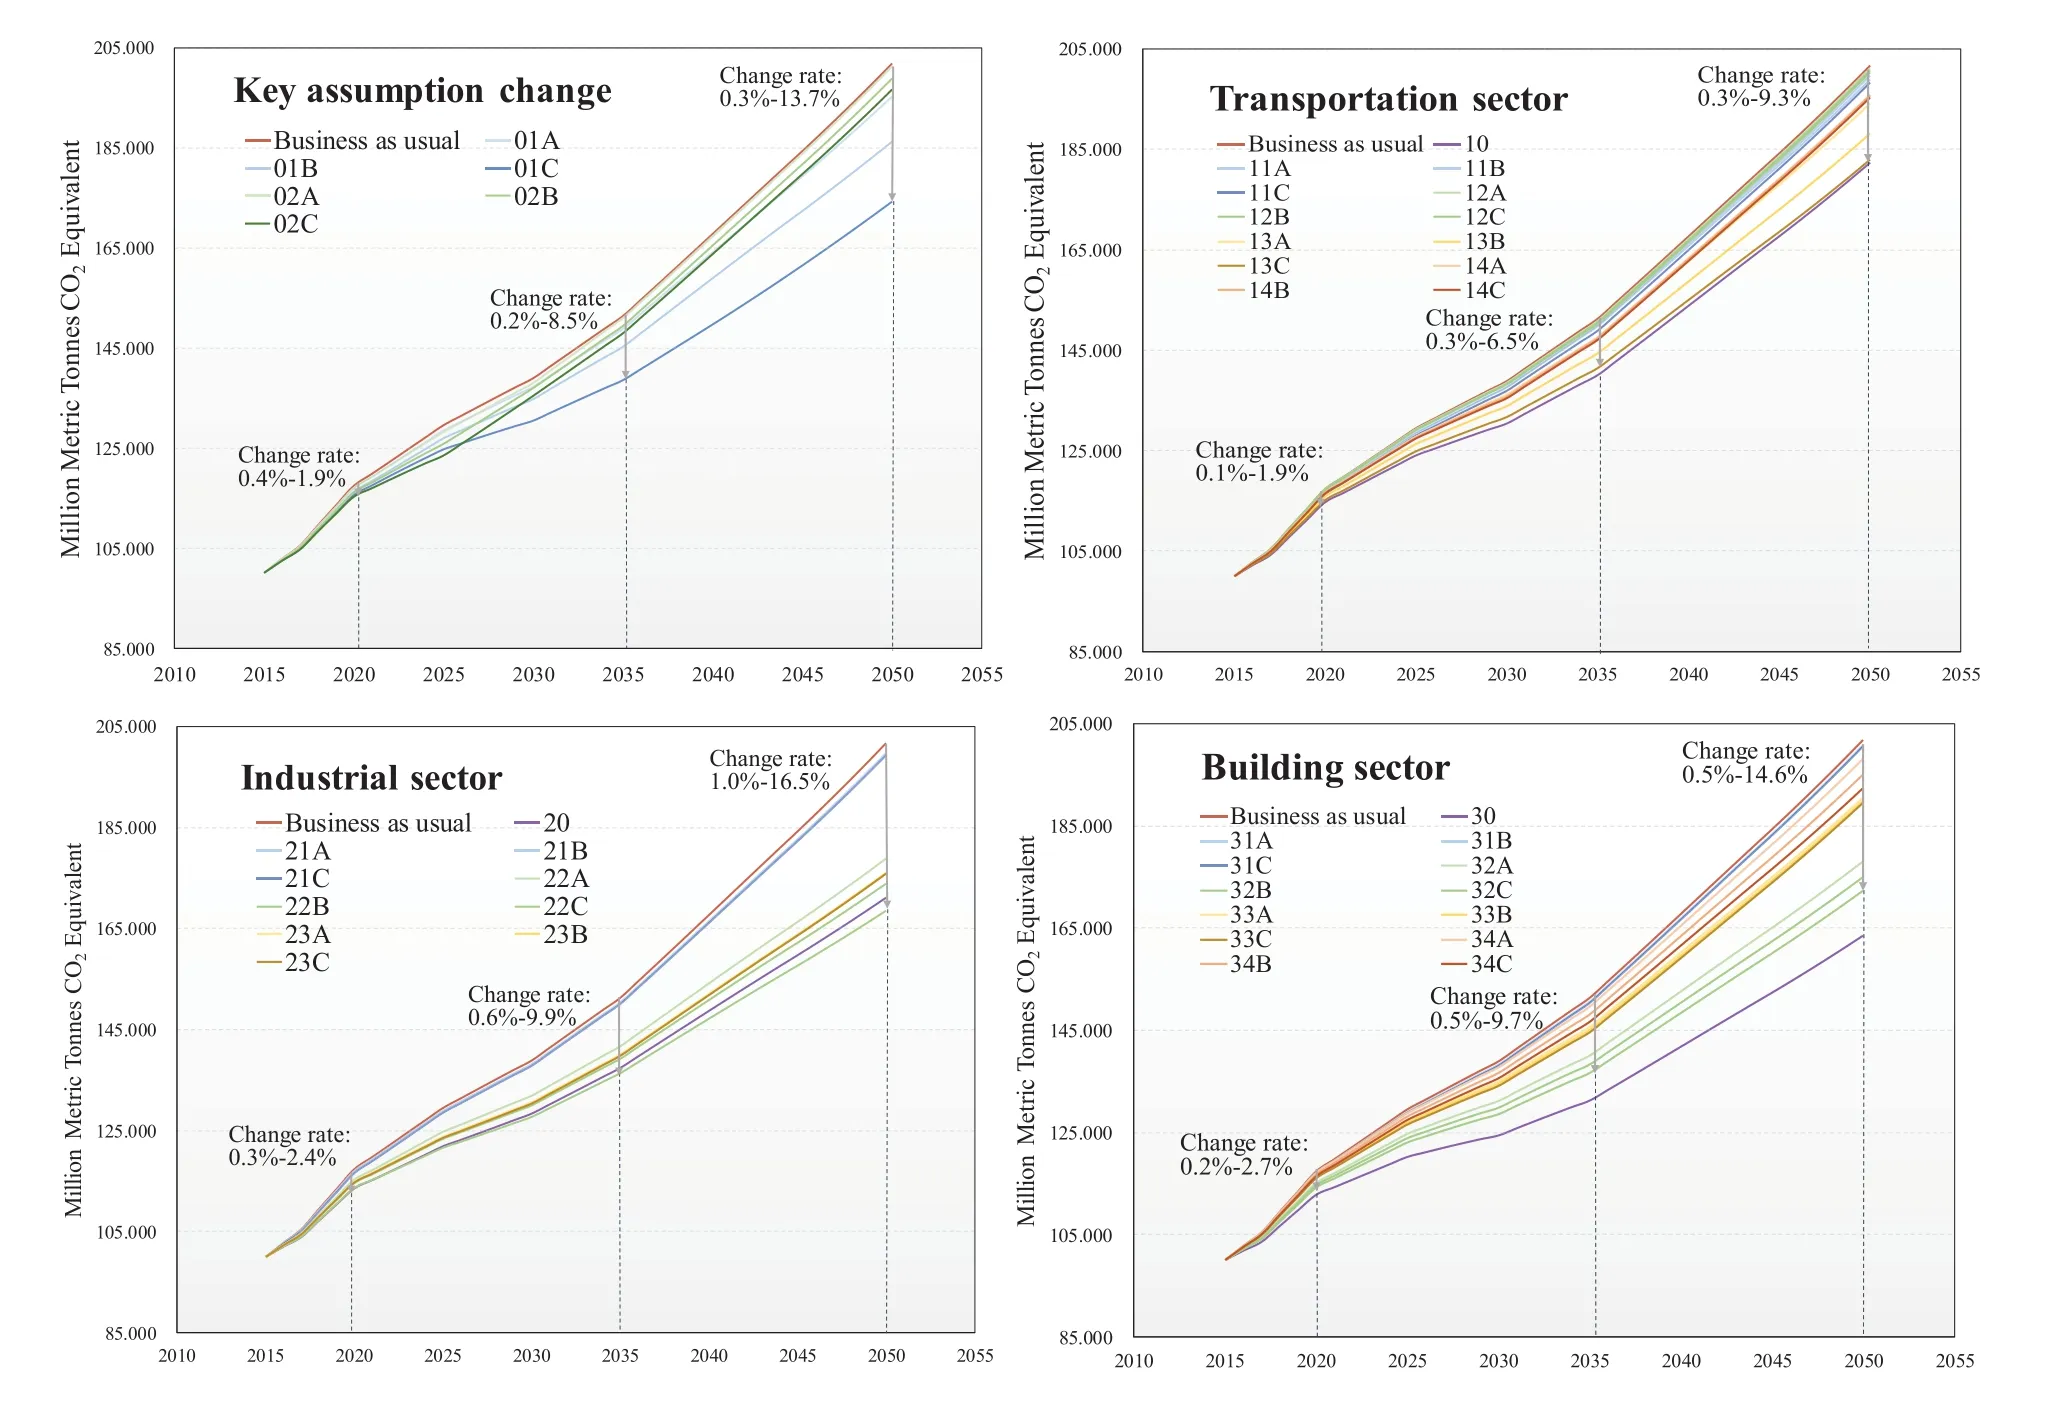
Fig.8 Carbon emission change in sub-scenarios.
5 Discussion
Under the pressure of huge emission reductions and the need to build an international city,Beijing is facing new opportunities and challenges.In this study,carbon emissions and energy consumption of Beijing in different scenarios over the next 35 years are simulated.From the results,the three composite scenarios have better emission reduction effects,effectively slowed the pressure on energy supply in Beijing,and also played a positive role in controlling carbon emissions.Based on different intensity settings,the three curves vary with time.It worth noting that Beijing’s carbon emissions should reach a maximum value by 2020 under the current policy intensity as showed in Moderate low-carbon scenario,but will continue to rebound and continue to grow form 2035 until 2050.This phenomenon may be due to the continuous and rapid growth of the economy.
The Frustrated low-carbon scenario was set up to discuss better emission reduction routes in Beijing.There is no rebound in carbon emissions under this scenario.Despite this,the future of low-carbon development in Beijing still faces many obstacles.On one hand,the setting of parameters in the Frustrated low-carbon scenario refers to the current status of foreign cities,such as Singapore,Tokyo and London.Since different cities have different stages of development,resource endowments,emissions structure and development orientation,they have obvious different regional characteristics.Therefore,it may be irrational to directly refer to the development status of other cities.In the model,plans were made to increase clean energy such as natural gas and electricity,and reduce the proportion of coal consumption which might be optimistic.However,due to restrictions on the supply of natural resources and import and export restrictions,there is a lot of pressure on the supply system,especially with respect to natural gas and electricity.This fact poses a certain security threat to the city.This issue also worth of further study and discussion.
On the other hand,the construction of low-carbon cities requires a lot of capital investment.For example,the average marginal abatement cost of CO2emissions for China’s thermal power sector is 316.51 Yuan/ton(Peng et al.,2018).According to the “Annual Report of Beijing Carbon Market 2017”,the average price of carbon quotas in Beijing is 49.95 Yuan/ton.If calculated at this level,the city may need trillions of yuan in funding to be able to achieve the commitment defined in the“Enhanced actions on climate change:Chinese intended nationally determined contributions”,which fix a cut of GDP carbon dioxide emissions,by 2030,to 60%-65%of year 2005.Therefore,funds will also limit the construction of low-carbon cities.
Future research,if combined with the abatement costs and the impact of the abatement measures on the economy,will help the choice of emission reduction paths better.In particular,along with a continuous process of models qualitative improvement and results verification,it will be important to directly monitor the emissions of critical sectors in most polluted areas of the city in order to check and improve their environmental performance.For such a purpose,innovative hierarchical approaches,integrating the use of different remote and proximal sensing platforms for intensive observation and short-term forecasts,can be applied(Casazza et al.,2013;Gargiulo et al.,2013;Casazza,2015;Errico et al.,2015;Casazza et al.,2016;Lega and Endreny,2016;Casazza et al.,2018).Finally,with the progress of the coordinated development among Beijing,Tianjin and Hebei,the interaction between Beijing and other cities should become more frequent.Consequently,resources and energy should be allocated to a larger area and a greater extent.Therefore,the research results on Beijing carbon emissions still have certain limitations.This is why future research should focus more on the coordinated development of this region.
6 Conclusions
In this study,50 alternative scenarios were conceived,using the LEAP modeling tool,to represent different development pathways of Beijing’s energy future from 2015 to 2050.Results show that government policies will have a significant impact on energy consumption and carbon emission.The main conclusions of this study are:
(1)Under the business as usual scenario,total energy demand in Beijing is expected to reach 208.62 Mtce in 2050,2.8 times the 2015 level.Total carbon emissions reach 201.75 Mt-C,which is 2.0 times with respect to 2015.Without control,future energy supply systems and carbon reductions will be under tremendous pressure.Under the moderate low-carbon scenario,the carbon emission curve will drop first and then rise after 2020.Ultimately,its energy consumption will be reduced to 98.30 Mtce by 2050 and carbon emissions will be reduced to 105.73 million metric tonnes(52.9%and 55.5%decrease with respect to the baseline scenario).If the current policy measures will be well-implemented,they will play a major role in energy conservation and emission reduction for Beijing.However,carbon emission rebounded in this scenario at the point of 2035.If carbon emissions steady decline is expected,there is still a necessity to adjust current policies.In the Frustrated low carbon scenario,Beijing’s total energy demand is expected to reach 82.79 Mtcein 2050,adrop of 60.3%.Carbon emissions will be 55.5%lower than the baseline scenario,and the total carbon emissions continued to decline,effectively restraining the increase in total energy consumption and total carbon emissions,and successfully achieving the decoupling of energy consumption from the economy.
(2)From a sectorial perspective,the construction sector has become the focus for emission reduction in Beijing.Within the construction sector,the operational energy consumption of buildings,especially commercial buildings,has dominated.The industrial sector has a significant reduction effect in the early years of the forecast year,but the effect of emission reduction after 2035 is not as good as that of the construction sector.Beijing is developing into an international transportation hub and trade center.The energy demand of Beijing’s transportation sector may increase in the future,while the transportation sector has shown great potential in energy conservation and emission reduction,which should not be ignored.
(3)The future of low-carbon development in Beijing still faces many challenges.In Beijing,where energy consumption is huge and energy is heavily dependent on the outside world,there is a great potential safety risk in the supply system.How to solve the problem of stable energy supply in the process of clean energy promotion will be the focus of the next step.At the same time,in order to achieve low carbon goals,Beijing will invest a lot of money,as well as human resources,in the development of advanced energy technologies,the construction of clean and efficient energy supply systems,and the construction of infrastructure.The cost of capital will become a major constraint to the city’s low-carbon development.
Acknowledgements
This work is supported by Sino-Italian Cooperation of China Natural Science Foundation(CNSC,grant No.7171101135)and the Italian Ministry of Foreign Affairs and International Cooperation(MAECI,High Relevance Bilateral Projects),National Natural Science Foundation of China(Grant No.41471466,71673029),China Postdoctoral Science Foundation(2017M622701)and Research Start-Up Funds of DGUT(GC300501-15).
 Journal of Environmental Accounting and Management2018年3期
- Journal of Environmental Accounting and Management的其它文章
- Impact of Climate Change Disclosure on Financial Performance:An Analysis of Indian Firms
- The Evaluation of Forest Cultural Value Based on WTP:A Case Study in Diebu County of Gansu Province in China
- Audit Judgment Performance:The Effect of Performance Incentives,Obedience Pressures and Ethical Perceptions
- A Simulation Approach to Understanding The Effect of Mimicry on Prey’s Flourishing When Predators Decline Due to Environmental Disturbance
- Optimization of the Gram Staining Method Based on Superparamagnetic Magnetic Nanobeads
- Modeling of a Small Scale Wind Turbine for Water Pumping Process:Case Study
