HPLC Fingerprinting and Spectrum-antitumor Effect Relationship for Discrim ination between Mylabris phalerata Pallas and Mylabris cichorii Linnaeus
Jian-Yong Zhang,Qi-Hong Chen,Xian Pei,Rong Yan,Can-Can Duan,Yun Liu,Xiao-Fei Li*
1School of Pharmacy,Zunyi Medical university,Zunyi,China,2Key Laboratory of Basic Pharmacology of Ministry of Education and Joint International Research Laboratory of Ethnomedicine of Ministry of Education,Zunyi Medical University,Zunyi,Guizhou,China.3School of Basic Medical Sciences,Zunyi Medical university,Zunyi,China,
4Guizhou Provincial College-based Key Lab for Tumor Prevention and Treatment with Distinctive Medicines,Zunyi Medical university,Zunyi,China.
Abstract Objective:Evaluation of discrim ination between two Mylabris Species based on HPLC fingerprinting and spectrum-antitumor effect relationship.M ethods:In this study,a simple and efficient high-performance liquid chromatography(HPLC)method integrating with chemometric analysis and spectrum-antitumor effect relationship was developed for discrim ination between two species of Mylabris:Mylabris phalerata Pallas(MP)and Mylabris cichorii Linnaeus(MC).Results:In the fingerprint analysis,14 characteristic peaks were selected to assess the differences between MP and MC using the sim ilarity and pattern recognition analysis using PCA and OPLS-DA.The HPLC chromatograms of samples from 10 regions of China showed differences between MP and MC,and 7 characteristic chemical markers were found.In the spectrum-antitumor effect relationship analysis,4 activity markers played a vital role in decreasing the IC50 and might be the antitumor components of Mylabris by grey relational analysis and multivariate linear regression analysis.The chemometric analysis in combination with spectrum-effect relationship results indicated that peaks 2(cytosine),4(unknown)and 14(unknown)were important differential markers for distinguishing the two species of Mylabris.Conclusion:The method is applicable,credible and more efficient to discriminate MP and MC,and will offer a new way for facilitating quality control of insect medicines.
Keywords:HPLC,Fingerprinting,Spectrum-antitumor effect,Mylabris,Discrim ination
Background
Mylabris,called banmao in China,has been used as a traditional Chinese medicine(TCM)for treating furuncle,deep-rooted ulcers and abdominal mass,and is an important antitumor agent.In addition,it is widely used in Europe as folk medicine[1].The major active constituent of Mylabris is cantharidin,which is an effective antitumor compound[2].Modern pharmacological studies have demonstrated that Mylabris possesses multiple activities,and is highly valued for the treatment of tumors because of its dual anticancer properties and the ability to increase the number of leucocytes[3-4].At present,Mylabris is widely used in some clinical anti-carcinoma TCM prescriptions in China,such asAidi injection and Compound banmao capsule.
According to the Pharmacopoeia of the People’s Republic of China(2015 version),Mylabris is defined as dried body of Mylabris phalerata Pallas(MP)and Mylabris cichorii Linnaeus(MC),which differ in their botanical characteristics,population dynam ics and ecology[5-6].Mylabris is also a highly toxic drug.Since the drugs available in China are usually a mixture of MP and MC,it is necessary to identify the chem ical and activity differences between the two species.
Since TCMs contain numerous known and unknown ingredients,quantitative profile analysis of their chemical constituents poses a significant challenge.High-performance liquid chromatography(HPLC)fingerprinting plays an important role in the quality control(QC)of TCM because of its overall profile characteristics of most compounds in a complex system.Furthermore,fingerprinting analysis of TCMs has good reproducibility and stability for species authentication and quality evaluation,and is accepted by the World Health Organization,the State Food and Drug Administration of China(SFDA)and the European Medicines Evaluation Agency(EMEA).Recently,chemometric analysis combining HPLC fingerprinting has been developed for QC and discrim inating different complex natural sources[7].However,it is ineffective to discrim inate the differences in TCM s since it cannot reflect the active constituent differences,which is more important for clinical use.So far,spectrum-antitumor effect relationship approaches have been used to successfully identify the bioactive constituents of TCM s[8].HPLC fingerprinting combined with chemometric analysis and spectrum-antitumor effect relationship will better elucidate the difference of multiple sources of TCM s.
Recently some methods have been reported for determining the content of cantharidin,which can be used to determine the quality of Mylabris[9].Some chromatographic finger printings were also applied for QC[10-11].Only one study utilized a method involving a gradient elution of the water-soluble compounds of Mylabris based on HPLC.Meanwhile,only ten samples were used,and no MC samples[12].To the best of our knowledge,discrim inating MP and MC based on chem ical composition and activity has not been studied before.
This study aimed to develop a simple and efficient method to discrim inate two species of Mylabris using HPLC fingerprinting combined with chemometric analysis and spectrum-antitumor effect relationship,which will provide a basis for the QC of Mylabris.This method could also be applied for identifying the QC marker of other TCM s.
Materials and methods
In total,20 batches of Mylabris phalerata Pallas(MP)and Mylabris cichorii Linnaeus(MC)were collected from different provinces of China(Table1),and identified by our prof Xiao-Fei Li.The voucher specimens were deposited in our labs.
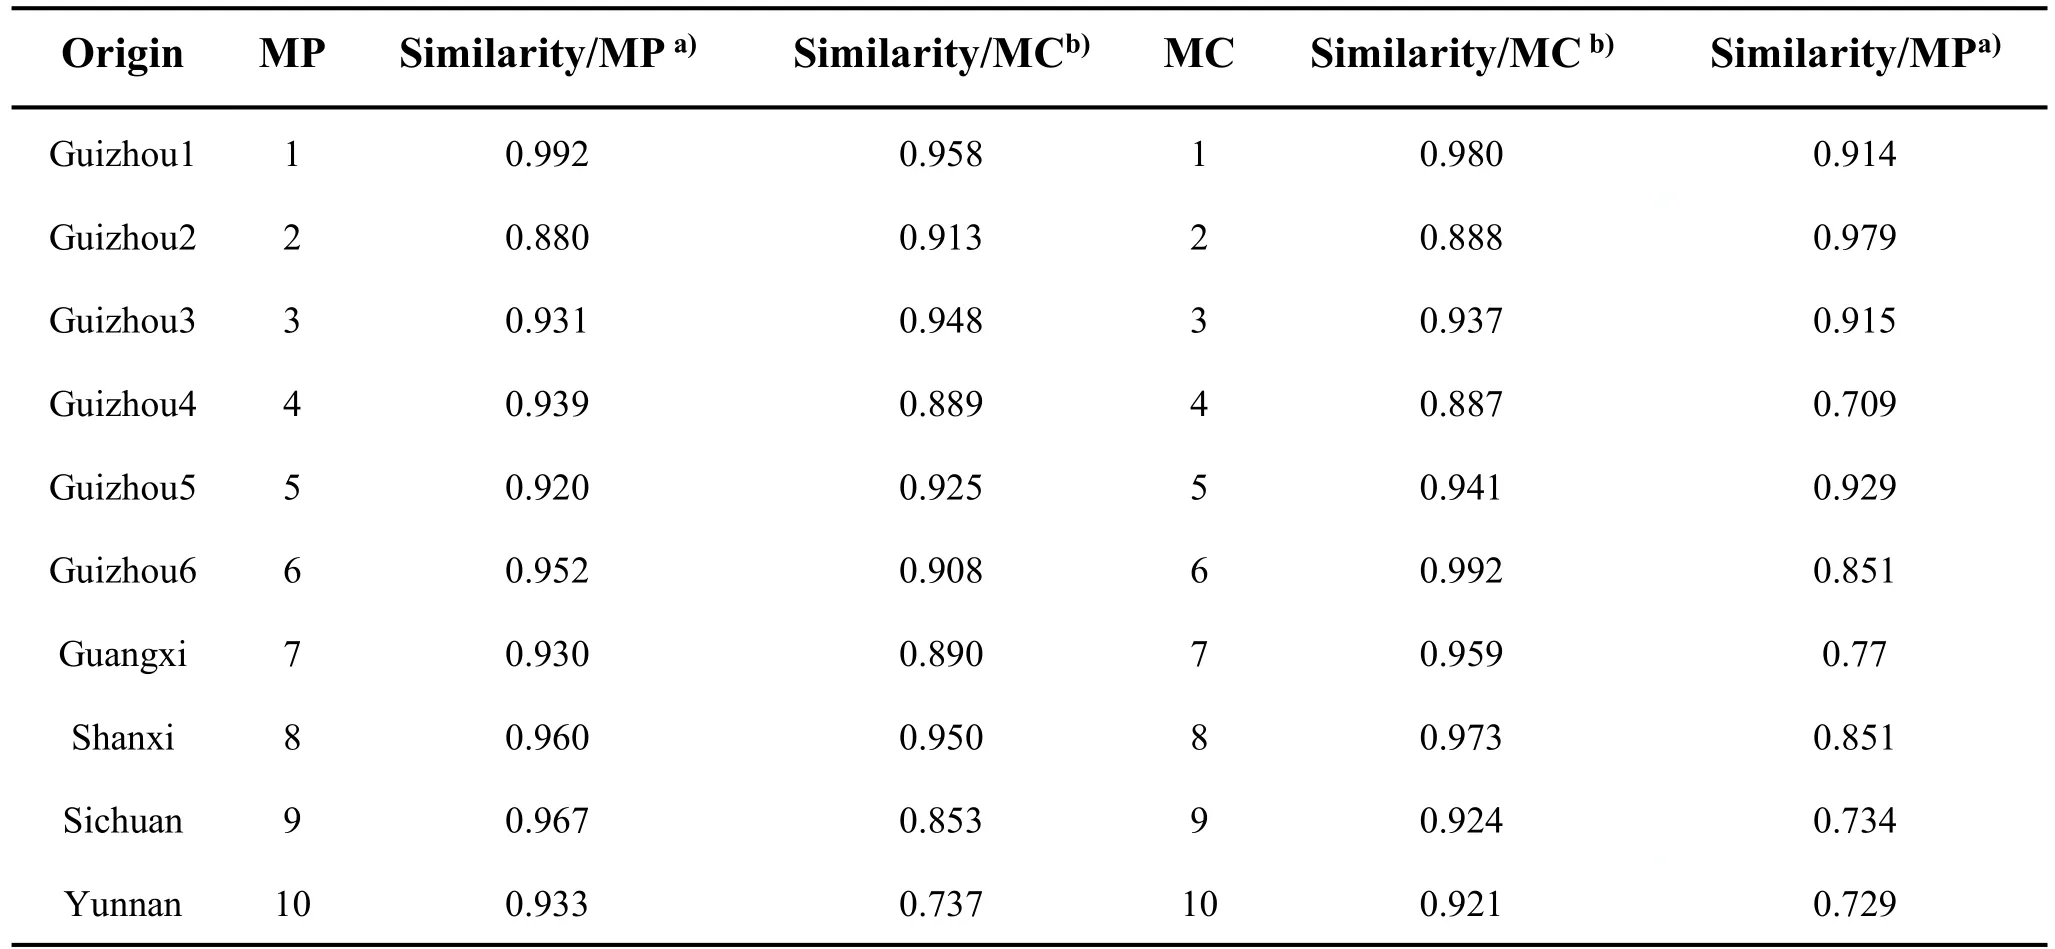
Table 1 The origin and fingerprint sim ilarities of all samples
The reference standard cytosine,uridine,guanosine and adenosine were purchased from ChengduPush Bio-technology Co.,Ltd.(Chengdu,China).
HPLC grade acetonitrile and methanol were purchased from Thermofisher scientific(Fairlawn,NJ,USA).Watson’s pure water was used throughout the study.Other chemicals and solvents were of analytical grade and obtained from A laddin Reagent(Shanghai,China),Chengdu Kelong Reagent(Chengdu,China)and Siaopharm Chem ical Reagent(Beijing,China).
Apparatus and chromatographic conditions
The HPLC analysis was conducted using an Agilent 1260 infinity HPLC system at 30°C on a Phenimenex Synergl Polar-RP80(4.6 mm ×250 mm,5 μm)for fingerprinting.A linear gradient elution with eluents A(water/glacial acetic acid,100:1,v/v)and B(methanol)was used for separation.The gradient program was developed as follows:0-1 min,3.0-4.6%B;1-9 min,4.6-6.8%B;9-25 min,6.8-51.0%B;25-30 min,51.0-100%.The flow rate of the mobile phase was 1.0 mL/m in.The chromatogram was monitored at 254 nm.A fter a 15 min equilibration period,10 μL of samples were used for injection.
Sam p le preparation
The dried samples were crushed into powder,and 2.5 g of each powdered sample was extracted twice with 50 mL of 75%ethanol by reflux for 1.5 hour each time.The extracted sample was mixed and concentrated under reduced pressure to 20 mL.The mixture was then precipitated with 80 mL water for 24 hour under 4°C.Subsequently,the extract was centrifuged at 3000 g min-1for 10 min to separate the supernatant.The supernatant was concentrated under reduced pressure to 25 mL.Finally,the supernatant was filtered through a 0.22 μm Millipore film before HPLC analysis.
M ethodo logy validation
The HPLC method was validated for precision,reproducibility and stability(0 h,2 h,4 h,8 h,12 h,24 h).The validation was estimated based on the retention time(RT)and peak area(PA).Finally,chemical fingerprints of 20 batches of Mylabris were established to identify the integrated chemical characteristics of multiple compounds.Some chemometric techniques were introduced on the chemical fingerprint for analysis.
Fingerprint sim ilarity analysis
The total peak profiles of all samples were integrated and exported as*.AIA format files for further processing.The*.AIA files were imported to the sim ilarity evaluation system for chromatographic fingerprint of TCM(Versition 2012;Comm ittee for the Pharmacopoeia of PR China,China)to compare the differences between the two species.
Pattern recognition analysis
Differences between two species of the peak areas were evaluated for statistical significance using unpaired Student’s t-test.A p value less than 0.05 was considered statistically significant.As a classic unsupervised method,principal component analysis(PCA)is widely applied for statistical data analysis.Instead of using many variables,PCA takes a small number of PCs without losing much information,and score plots are then visualized for free separation of observations.In this study,PCA was conducted on the normalized peak areas of each component in the HPLC fingerprints using the SIMCA-P+14.0 software(Umetrics,Umea,Sweden)to find the discrim ination between the two species of Mylabris.
For a more preferred discrim ination between the two Mylabris species,a supervised method of orthogonal partial least squares discrim inant analysis(OPLS-DA)was applied to analyze the differences on the normalized peak areas of each component in the HPLC fingerprints.The VIP value is a weighted sum of squares of the OPLS weights,reflecting the relative contribution of each X variable to the model.The variables with VIP>1,together with S-plot were considered to be influential for the separation of samples in the score plots generated from OPLS-DA analysis.Then,the characteristic chem ical markers for discrim ination were obtained.
Spectrum-antitumor effect relationship analysis
To explore the antitumor effect peak area for Mylabris samples integrated with fingerprint data,and compare the differences between the two species,the correlation between the peak of fingerprint and anti-tumor effects were studied.Two methods combining grey relational analysis and multivariate linear regression analysis(MLRA)were applied by SPSS19.0(IBM,USA)and GM 6.0 soft(Grey Systems Theory Institution,NUAA,China).The anti-tumor test was carried out by our published methods[12],human hepatocellular carcinoma cell line HepG2 cells was maintained in RPM I1640 medium supplemented with 10%fetal bovine serum.The cells were grown in a hum idified atmosphere containing 5%CO2at 37°C.SRB method was used for assessing the proliferation for anti-tumor activities,then the IC50of HepG2cells was calculated,finally the IC50and normalized peak areas was used for chemometric analysis.Then,the chracteristic activity markers of Mylabris were got.
Results and Discussion
Optim ization of extract conditions
For sufficient extraction of water-solute compounds from Mylabris,the extraction system was optimized.Ultrasonic and refluxing showed that these compounds could be optimally extracted by refluxing.
Optim ization of HPLC method
To obtain maximal chromatographic peaks to describe the overall feature of the herb,the composition of chromatographic column,mobile phase,and detection wavelengths(200,254,265and278nm)were investigated.The results showed that Phenimenex Synergl Polar-RP80 column,water(containing 1%glacial acetic acid)and methanol,and 254 nm were the best conditions for Mylabris HPLC analysis(Figure 1),the structure of 4 standard substances is showed in Figure 2.
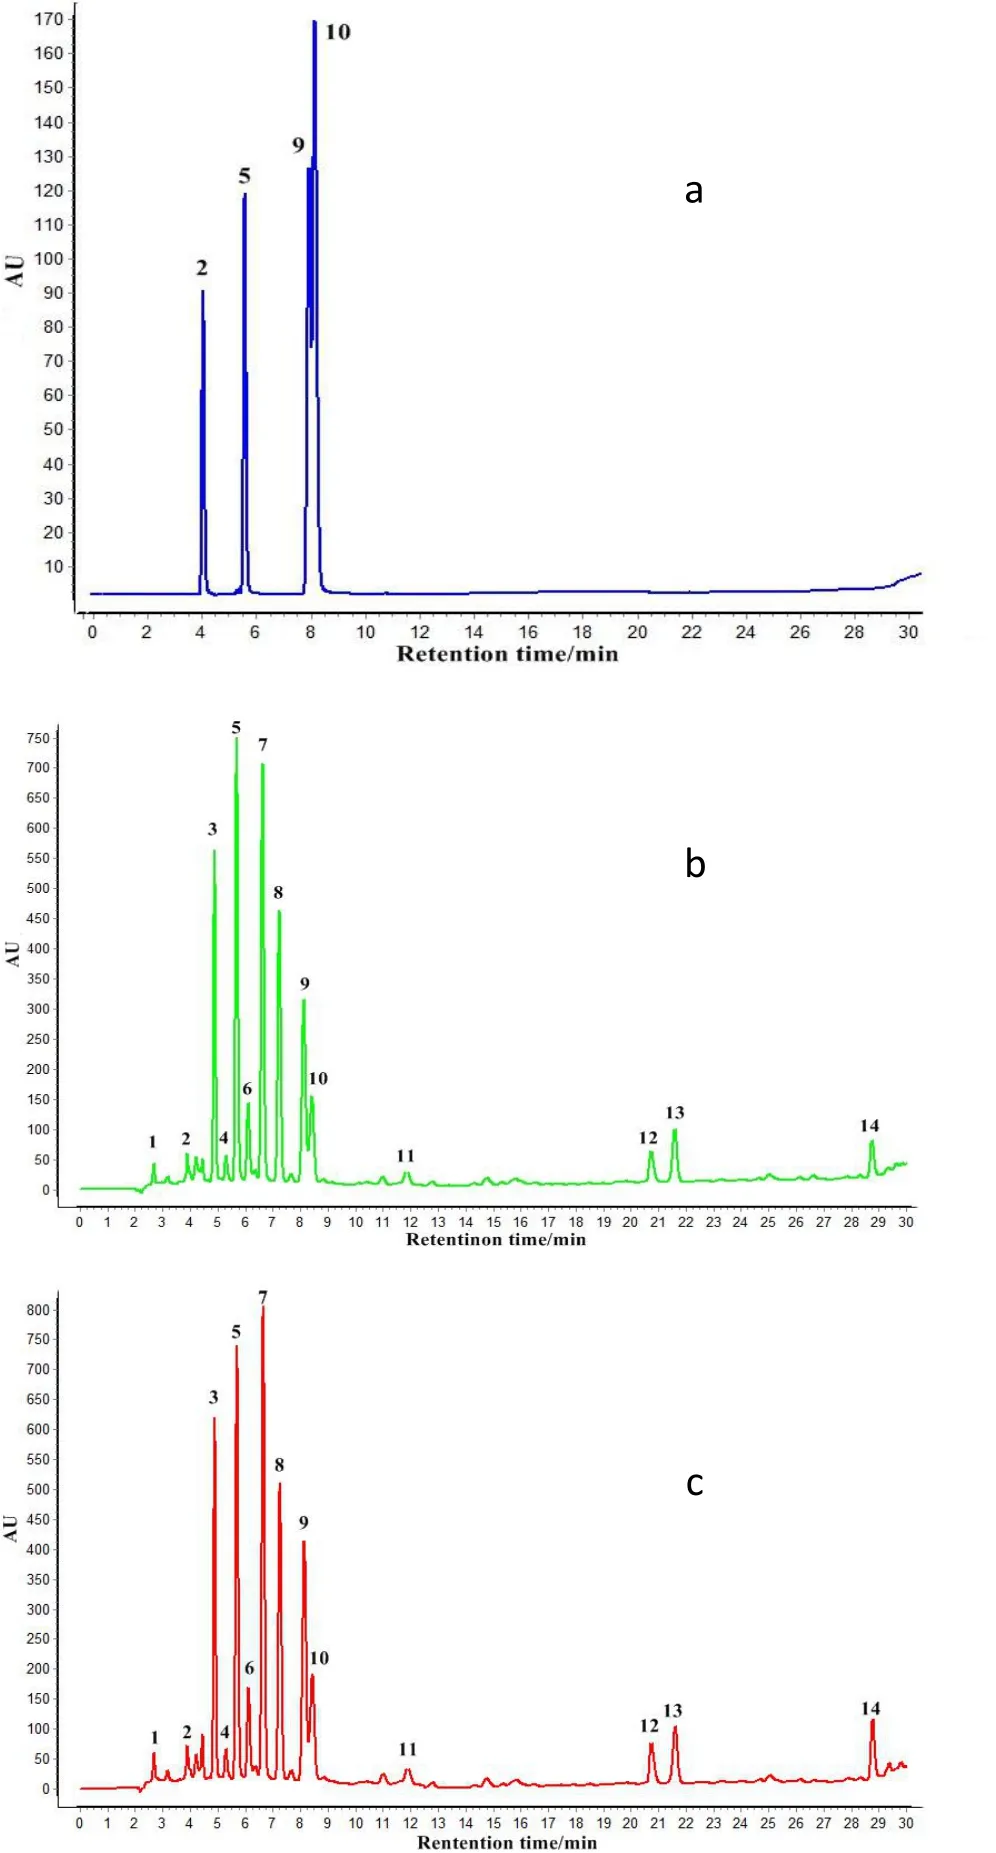
Figure 1 The chromatographic fingerprints of(a)four standards;(b)Mylabris phalerata Pallas(MP)and(c)Mylabris cichorii Linnaeus(MC);(2)cytosine,(5)uridine,(9)guanosine and(10)adenosine.
M ethod validation
In this study,14 peaks were well separated and used as“common peaks”.The precision,repeatability,and stability were based on the retention time(RT)and peak area(PA).The RSD values of RT and PA for precision(n=6)did not exceed 0.2 and 4%,respectively;The RSD values of RA and PA for repeatability(n=6)were below 0.2 and 4%,respectively,and the RSD values for stability(0-24 h)were less than 0.4 and 5%,respectively,which indicated that the samples were stable within 24 h.These results illustrated that the quality of the studied samples and HPLC method were stable and well controlled.
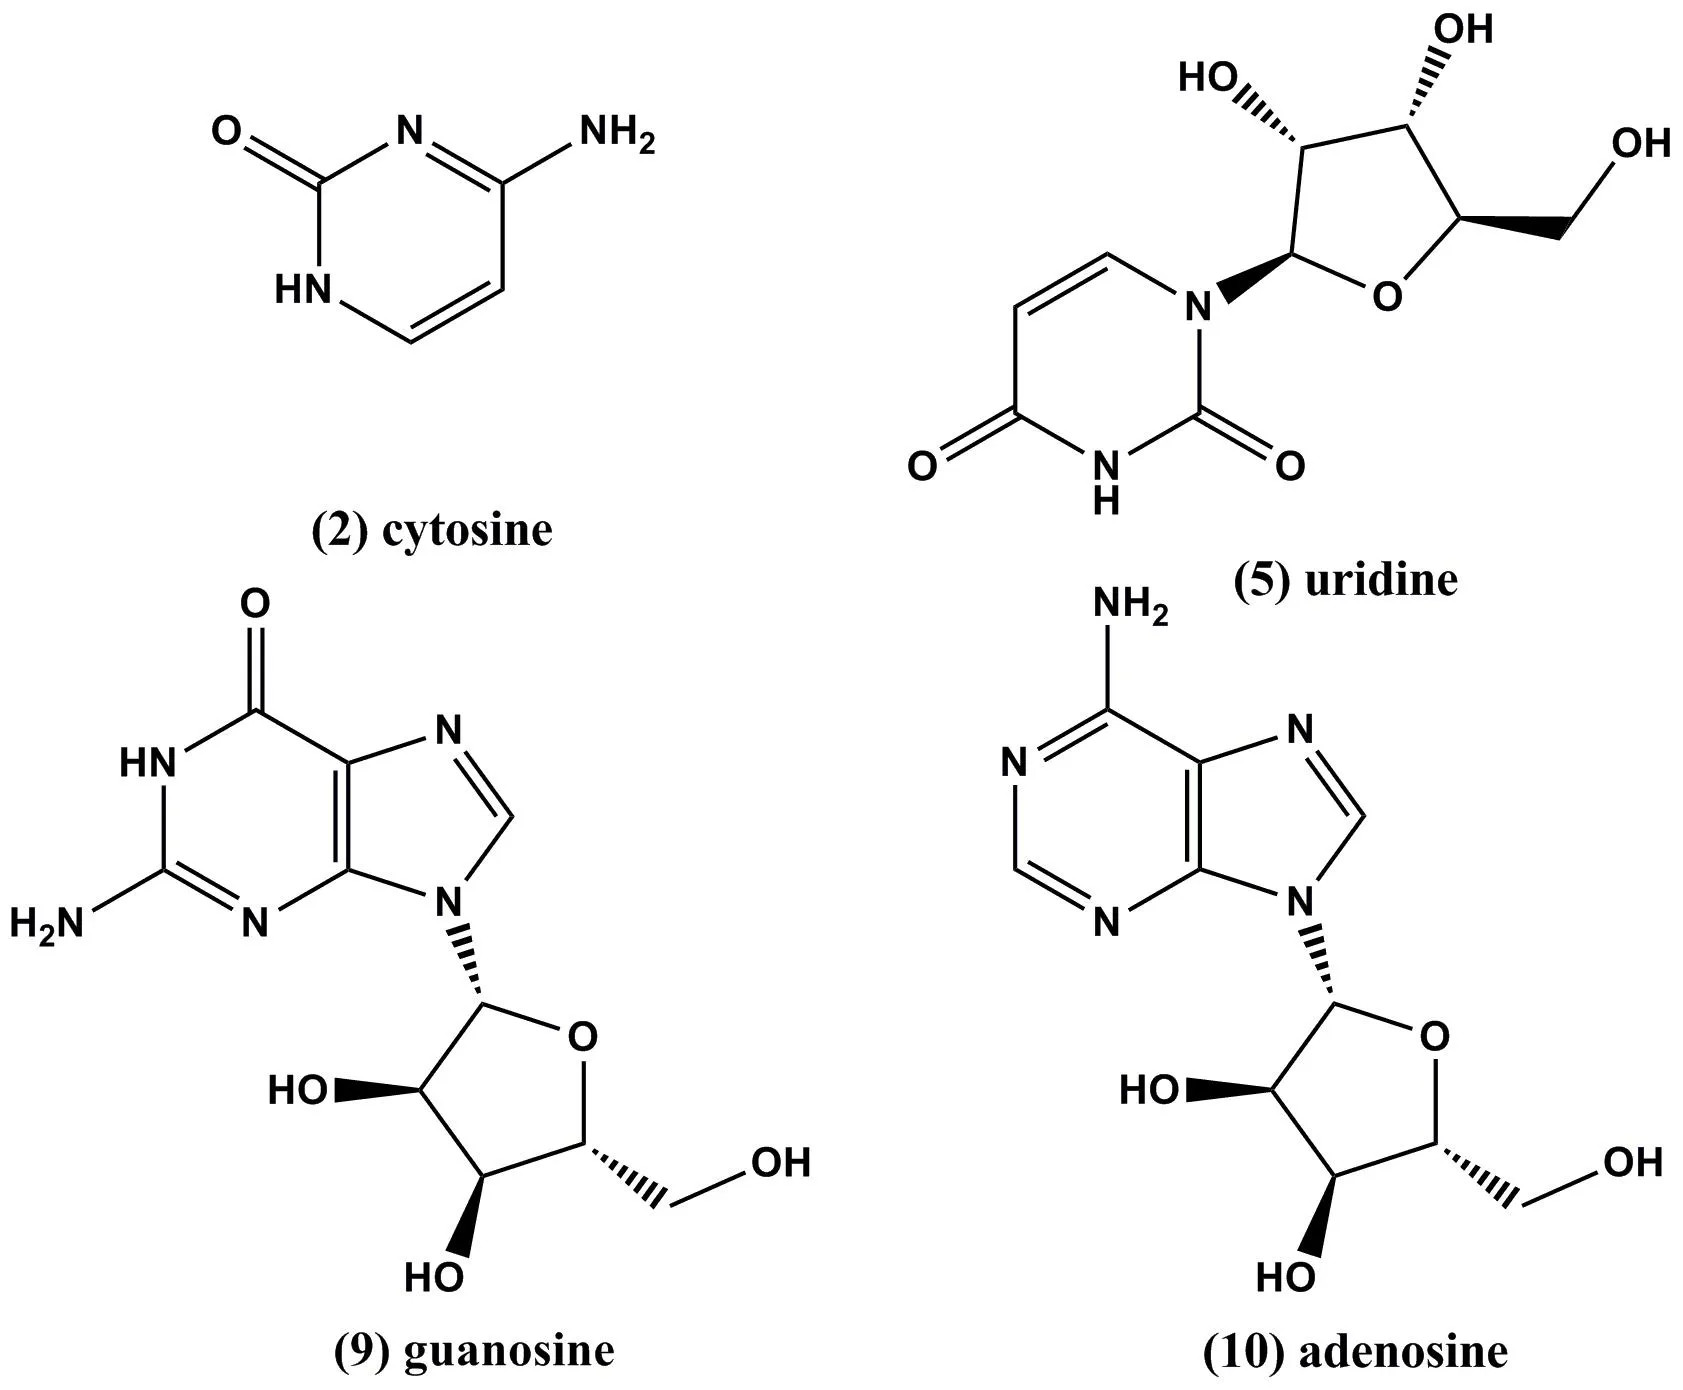
Figure 2 The structure of four reference compounds in mylabris;(2)cytosine,(5)uridine,(9)guanosine and(10)adenosine.
Fingerprint sim ilarity evaluation
The fingerprint sim ilarity analysis was used to evaluate the sim ilarity of HPLC peaks.The sim ilarities of MP and MC were calculated by the reference HPLC fingerprint,respectively.As shown in Table 1,except for two MP samples(from Guizhou2 and Guizhou5)with lower sim ilarities(0.880 and 0.920,respectively),other samples of MP were>0.930.The sim ilarities of MC samples were>0.921 except for MC samples(from Guizhou2 and Guizhou4),whose sim ilarities were 0.888 and 0.887,respectively.These data indicated that the quality of Mylabris within one species was stable.However,the sim ilarities of only three MP samples compared with the reference HPLC fingerprint were>0.930;and the sim ilarities of only two MC samples compared with the reference HPLC fingerprint were>0.921.These results showed that the two species of Mylabris were considerable variation in some peak areas.
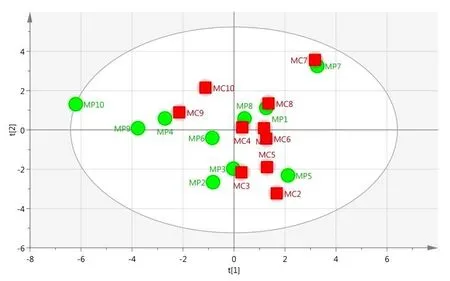
Figure 3 PCA score plot of Mylabris phalerata Pallas and Mylabris cichorii Linnaeus(R2X=0.618,Q2=2.236).
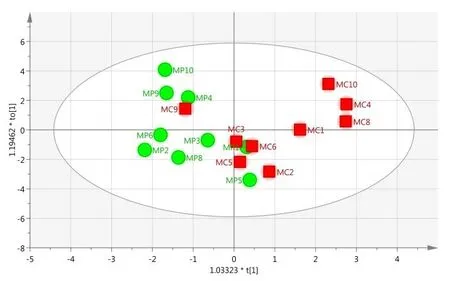
Figure 4 OLS-DA score plot of Mylabris phalerata Pallas and Mylabris cichorii Linnaeus.
Discrim ination of MP and MC by pattern recognition analysis
For global analysis of the difference,PCA was used to find the quality variation of the samples from the two species of Mylabris.Figure3shows that the two-dimensional PCA model was constructed by first two PCs,which included approximately 61.8%of the original data.The score plot showed that the MP and MC samples could not be separated by PCA.To understand the differences between MP and MC,an OPLS-DA model was established.As shown in Figure 4,the Mylabris samples could be classified into two groups with R2X=0.502,R2Y=0.492 and Q2=0.0769 as compared to the PCA model.These results showed that the OPLS-DA model was more suitable than the PCA model for distinct separation of the test samples based on their different components.From S-plot of OPLS-DA,peak markers including peaks 1,2,4,7,9,12 and 14 between MP and MC could be found(Figure 5).Based on VIP>1,the peaks 1,2,4,7,9,12 and 14 might be the most significant variables in discrim inating between the two species(Figure 6).The peak group(1,2,4,7,9,12 and 14)may play a vital role in distinguishing between MP and MC as characteristic chemical markers.
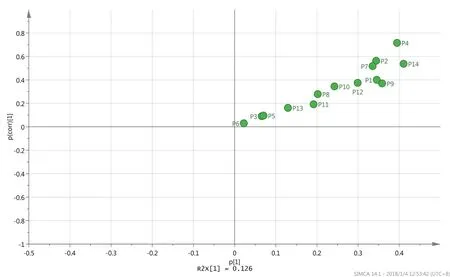
Figure 5 S-plot from the OLS-DA model of Mylabris phalerata Pallas and Mylabris cichorii Linnaeus.

Table 2 Relative Grey Correlative Degree(RGCE)of the peaks on antitumor effect
Spectrum-effect relationship by grey relational analysis
To further evaluate the relationship between the variations of normalized peak area and IC50,grey relational analysis(GRA)was performed.The influence rank by normalized peak area was P13>P14>P3>P2>P12>P4>P9>P1>P10>P7>P6>P8>P5>P11 as shown in Table 2.The results indicated that the top-6 peak including peaks 13,14,12,2,3 and 4 were the main influencing factors for the antitumor effect based on the standard of Relative Grey correlative degree(RGCE)>0.75.
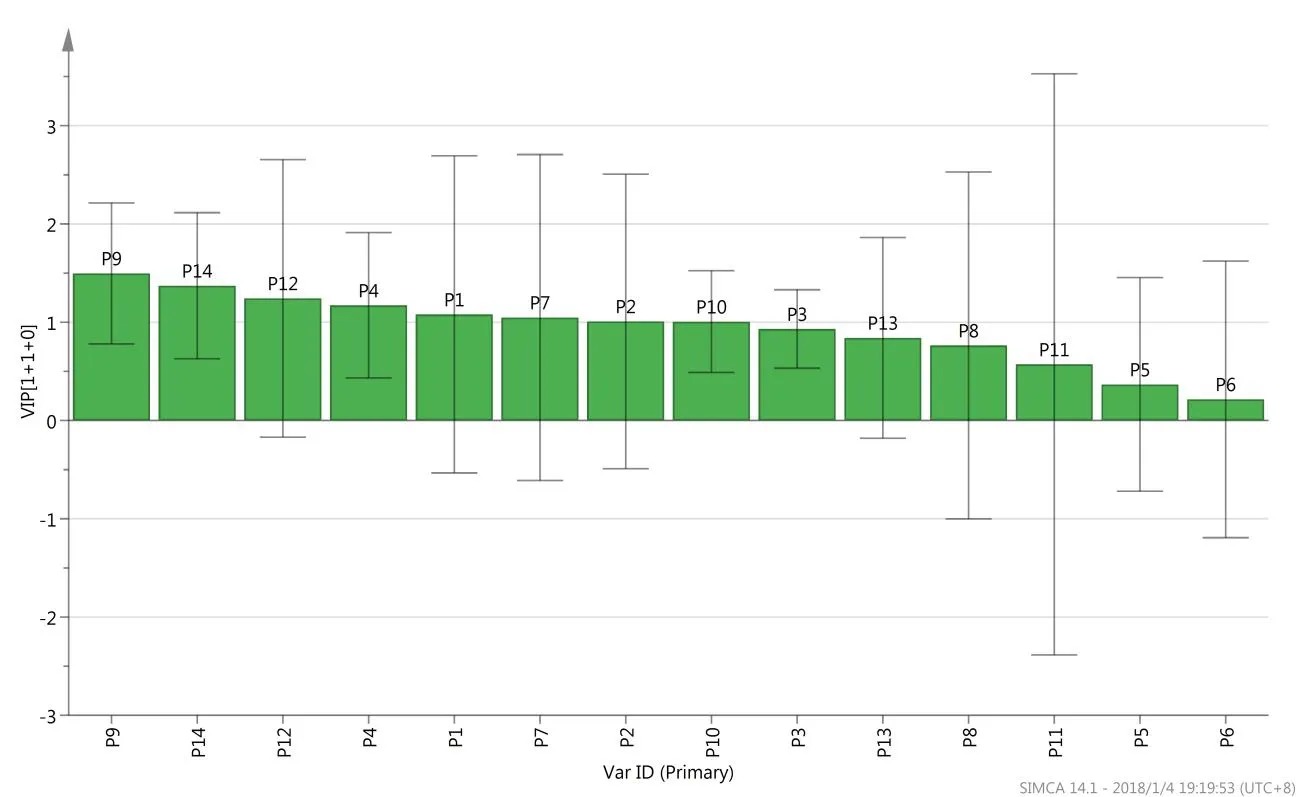
Fig 6 VIP plot from the OLS-DA model of Mylabris phalerata Pallas and Mylabris cichorii Linnaeus.
Spectrum-effect relationship by MLRA
MLRA model is the most common modeling method for deducing the relationship complexity between two or more variables and a response that was built by the following formula:

Where Y is the estimated value and represents the response;Xnan independent variable,b0the intercept and bnthe regression coefficient for Xn.In this study,MLRA was applied to establish the fingerprint-efficacy relationship between the values of the peak areas in HPLC fingerprints and the IC50of anti-HepG2,and then find the possible antitumor components.The collineation of data was found by a common MLRA model,which is unsuitable to explore the correlation between Y(IC50)and X(PA).A PCA MLRA model was used to study the fingerprints-effect relationship,and the first six PCs with cumulative variance contribution rate:91.068%were selected for analysis.Finally,the following equation was established according to the SPSS output and the PCs:

Where R represents the regression coefficient;p represents the statistical significance.P<0.05 means that the PCA MLRA model show significant statistical significance.So this equation showed that the antitumor activity was closely correlated with 14 peaks in the HPLC fingerprints,particularly P A2,P A4,P A6,P A8,P A11 and P A14 with negative correlation,thus indicating that these peaks 2,4,6,8,11 and 14 significantly influenced the IC50of anti-HepG2.
Integrating Analysis of Two Mylabris Species
The experiment showed that the HPLC fingerprinting could be used for reflecting the chemical characteristics of Mylabris.The sim ilarity algorithms,PCA and OPLS-DA were applied to find the difference between MC and MP.The peak group(1,2,4,7,9,12 and 14)was defined as characteristic chemical markers.
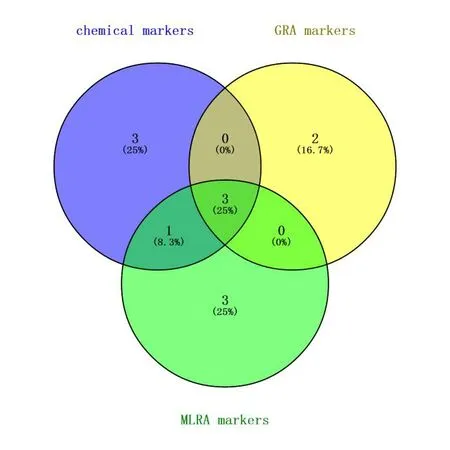
Figure 7 The Venn diagram for integrating analysis of two Mylabris species
In addition,both GRA and MLRA proved to be satisfactory method for further discrim inating.Integrating the GRA and MLRA analysis results,peaks 2,4 and 14 as activity markers of Mylabris should be responsible for anti-tumor effect,which may be pharmacodynam icmaterial basis of Mylabris.
The important differential markers were defined for the peak with characteristic chem ical and activity marker property.So,between MC and MP on HPLC fingerprints after spectrum-effect relationship analysis,the peak 2(cytosine),4(unknown)and14(unknown)were important differential markers for the differences between MP and MC as showed in Figure 7.
Conclusion
Conclusively,in the present research,a HPLC method was proposed for chemical fingerprinting of MP and MC.By combining HPLC fingerprinting,PCA,and spectrum-effect relationship analysis such as GAS and MLRA,the chemical and pharmacological properties of two close species of Mylabris could be discrim inated.This indicated that compounds from the peaks 2(cytosine),4(unknown)and 14(unknown)as important differential markers played dom inant roles in distinguishing between MP and MC.The structure of peaks 4 and 14 should be identified by others technology.The method of HPLC fingerprinting combined with statistical,chemometric analysis and spectrum-effect relationship analysis was demonstrated to be efficient in discovering marker components or for promotion of QC of herbal medicines.
 TMR Modern Herbal Medicine2018年1期
- TMR Modern Herbal Medicine的其它文章
- Go with the flow,emerge as the times require and propel the modernization of traditional Chinese medicine to a new era
- Mangiferin ameliorates hyperglycemia by inhibiting oxidation and α-glucosidase activity
- Explore the direct and/or the synergistic antihypertensive effects of wind-dispelling herbs involving Fangfeng and Baizhi on hypertensive rats with liver-yang hyperactivity based on vasoactive substances
- External application of Chinese medicine formula combined with analgesic drugs to treat lung squamous cell carcinoma pain:A case study with mixed methods
- Perspectives in app lication of biosensors for the modernization of traditional Chinese medicine
- Swallow anything and everything,seek difference and truth-The consideration on development of post-modern Chinese medicine
