Characterisation of pH decline and meat color development of beef carcasses during the early postmortem period in a Chinese beef cattle abattoir
ZHANG Yi-min, David L. Hopkins, , ZHAO Xiao-xiao, Remy van de Ven, MAO Yan-wei, ZHU Li-xian,HAN Guang-xing, LUO Xin
1 College of Food Science and Engineering, Shandong Agricultural University, Tai’an 271018, P.R.China
2 NSW Department of Primary Industries, Centre for Red Meat and Sheep Development, Cowra 2794, Australia
3 NSW Department of Primary Industries, Orange Agricultural Institute, Forest Road, Orange 2800, Australia
4 Sishui Xinlv Food Co., Ltd., Jining 273200, P.R.China
1. Introduction
When the Meat Standards Australia (MSA) beef grading system was established, one of the initial specifications was the concept of an ideal pH/temperature window during chilling. This was such that to ‘hit’ the window the pH had to be above 6 if the muscle temperature was above 35°C and below 6 if the muscle temperature was below 12°C(Thompson 2002).
The target “window” was based on the classical studies of Locker and Hagyard (1963), which demonstrated that pre-rigor muscle would shorten more if exposed to high or low temperatures. It is important to establish the form of this relationship under specific processing situations to optimize meat quality. China is one of the largest beef producers and consumers in the world, yet there is little information on the quality of the beef and none on the optimal pH decline rates during rigor onset. On this basis, a study was undertaken to derive the relationship between pH and temperature in order to determine the compliance with the “window” for cattle carcasses processed in a typical beef cattle abattoir in China.
Also, dark-cutting beef with a limited pH decline rate usually exhibits a relatively dark color and has lower consumer acceptance (Holdstock et al. 2014; English et al.2016). In this study, dark-cutting beef is defined as ultimate pH (pHu)≥6.10, which is the pH threshold for dark-cutting beef in China (Du et al. 2009). Hughes et al. (2014) and Murray (1989) investigated beef color at grading (from 14 to 31 h postmortem), and found grading at an early time produced a higher incidence of dark-cutting beef. However,the interaction of the development of the high pHu condition and the color changes during rigor development, especially earlier than 14 h postmortem, have not been fully explored.Therefore, this study also investigated the effects of pH on beef color, either as pH declines during rigor onset, or when the ultimate level is reached.
2. Materials and methods
2.1. Animals
For the study, 97 Chinese crossbred yellow cattle(Luxi×Simmental, castrate, 18–24 months) were randomly selected on the slaughter line from a local abattoir. All the carcasses ((273.5±38.3) kg) were routinely chilled at (1±1)°C from 45 min postmortem for 24 h.
2.2. Carcass temperature and pH measurements
Carcass temperature and pH were measured in three positions (1, 12th/13th ribs to 1st/2nd lumbar vertebrae; 2,1st/2nd to 3rd/4th lumbar vertebrae; 3, 3rd/4th to 5th/6th lumbar vertebrae) in the M. longissimus lumborum (LL) of right side of the carcasses. The first measurement was undertaken at 45 min, and then every hour from 2–12 h postmortem with a final measurement at 24 h postmortem,using a digital thermometer (DM6801A, Shenzhen Victor Hi-Tech Co., Ltd., China) and a portable pH meter with temperature compensation (Senven2Go-S2, Mettler-Toledo,Switzerland).
2.3. Meat color measurements
The left side of each carcass was cut between 12th/13th ribs at 45 min and one steak (2 cm thick) was excised immediately, then additional rib steaks were removed at 3, 6,12 and 24 h postmortem, from the cranial to caudal direction.Samples were grouped based on the pH values at 24 h postmortem (normal: 5.40–5.79; intermediate: 5.80–6.10;dark-cutting: pH≥6.10).
L*, a* and b* values of each beef steak were measured with a X-Rite spectrophotometer (Model SP62, 8 mm diameter aperture, Illuminant A, 10° observer; X-Rite,Incorporated, Grand Rapids, USA). Chroma and hue were calculated as chroma=(a*2+b*2)1/2and hue=arctan(b*/a*).At least six scans were taken per steak on the cut after blooming (20 min) developed.
2.4. Statistical analysis
A hierarchical model was applied to compare the differences in pH or temperature trends over time for the three positions within LL muscle. The model included uncorrelated random effects for random time effects (FTime); Position×FTime,Carcass×FTimeand Carcass×Position interaction effects;and random error. The approach used to model the pH vs.temperature across carcasses was as for the pH trends over time model, with time replaced by temperature. Each of these models is related to the modeling approach reported by van de Ven et al. (2014). The spline models were fitted using asreml (Butler 2009) under R (R Core Team 2015).To derive the Temp@pH6 (temperature when pH dropped to 6.0), pH data for 6 carcasses in the dark-cutting group and 4 carcasses with initial pH below 6.0 were excluded,since the pH decline curves of those carcasses could not pass through pH 6.0.
The pH decline and color data analysis for the 18 selected carcasses (6 per pHu group) were processed using MIXED procedure (SAS, ver. 9.0, SAS Institute, Cary, NC, USA,2006), based on a split-plot design. For the whole plot,carcasses served as a block. Each block was assigned to 1 of 3 subplots: ultimate pH (5.40–5.79; 5.80–6.10;pH≥6.10). Within each subplot, steaks from each animal were assigned to 5 postmortem times (45 min, 3 h, 6 h, 12 h and 24 h) as described above. pHu group, postmortem time and their interaction were fitted as fixed effects, and block as a random effect. The means were compared using the PDIFF approach. Statistical significance was set at P<0.05.
3. Results and discussion
3.1. Position effects on average pH and temperature
Results showed a position effect (P<0.01) on pH and temperature. The pH at positions 2 and 3 was estimated to be 0.014 and 0.018 less than that of position 1, while the difference between positions 2 and 3 was not significant. It is not unexpected to detect slight variation in the pH within muscle. Location effects on some beef traits, such as pH and color have been reported previously (Lee et al. 2008;Apple et al. 2014).
The temperature at both positions 2 and 3 was higher(0.2°C) than at position 1 soon after slaughter. And the difference between positions 3 and 1 increased for approximately the first 7 h to attain a maximum difference(0.45°C). The difference then decreased and it took more than 20 h to reach a similar temperature to that at position 1. Given that the subcutaneous fat level increases across the LL from the cranial to the caudal position (Hopkins et al. 1993) and the differential rate at which the produced heat dissipated (Jacobs and Hopkins 2014), the higher temperature in the LL at position 3 is not surprising.Although it showed there were some variations on pH and temperature among muscle positions, in the following study,those variations were not considered, as those differences were quite small.
3.2. pH/Temperature window
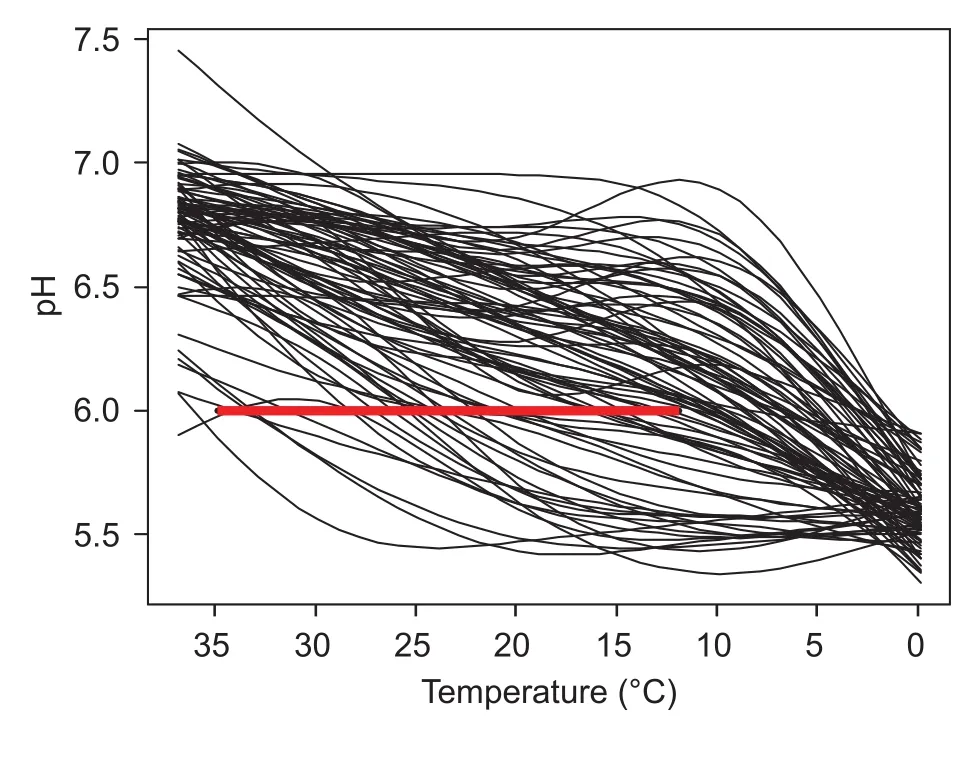
A natural cubic spline model was used to determine the relationship between pH/temperature and the results for each carcass are shown in Fig. 1.
The predicted pH at temperature 12°C (pH@Temp12°C),and the temperature at which pH first drops below 6.0(Temp@pH6) were estimated for position 1. The average pH@Temp12°C was 6.09 (SD=0.39), and the average Temp@pH 6 was 11.8°C, ranging from 1.4 to 36.1°C. Only 33.3% of the tested carcasses hit the ideal pH/temperature window defined by MSA, and specifically, only 6.9%carcasses hit the window at the range of temperature from 14 to 19°C. For the majority (65.5%) of the carcasses, the rate of pH decline was too slow, such that when the pH declined to 6.0, the temperature was below 12°C.

Fig. 1 pH/Temperature declines based on the pH and temperature data (position 1) obtained at 45 min, 3 h, 6 h,12 h and 24 h for 87 beef carcasses. All the lines were fitted by a spline model. The solid red line indicates the ideal pHTemperature window defined as temperature at pH 6.0 in the M. longissimus lumborum (LL)<35°C and >12°C. Position 1 is 12th/13th ribs to 1st/2nd lumbar vertebrae in LL muscle.
pH/Temperature decline during the early post-mortem period is an important determinant of beef quality (Thompson 2002). If the temperature is too high (above 35°C) when pH drops to 6.0, heat toughening will occur because the calpains are denatured or inactivated (Kim et al. 2012).Cold shortening is a well understood issue (Bendall 1951),to result from a slow rate of pH decline, and which can result in tough meat. A slow rate of pH decline was evident in the present study and as such methods (i.e., electrical stimulation) to accelerate the pH decline, are urgently required for industry implementation (Hwang et al. 2003).However stimulation needs to be carefully applied so as to avoid overstimulation (Hamoen et al. 2013).
3.3. Color development of three ultimate pH groups
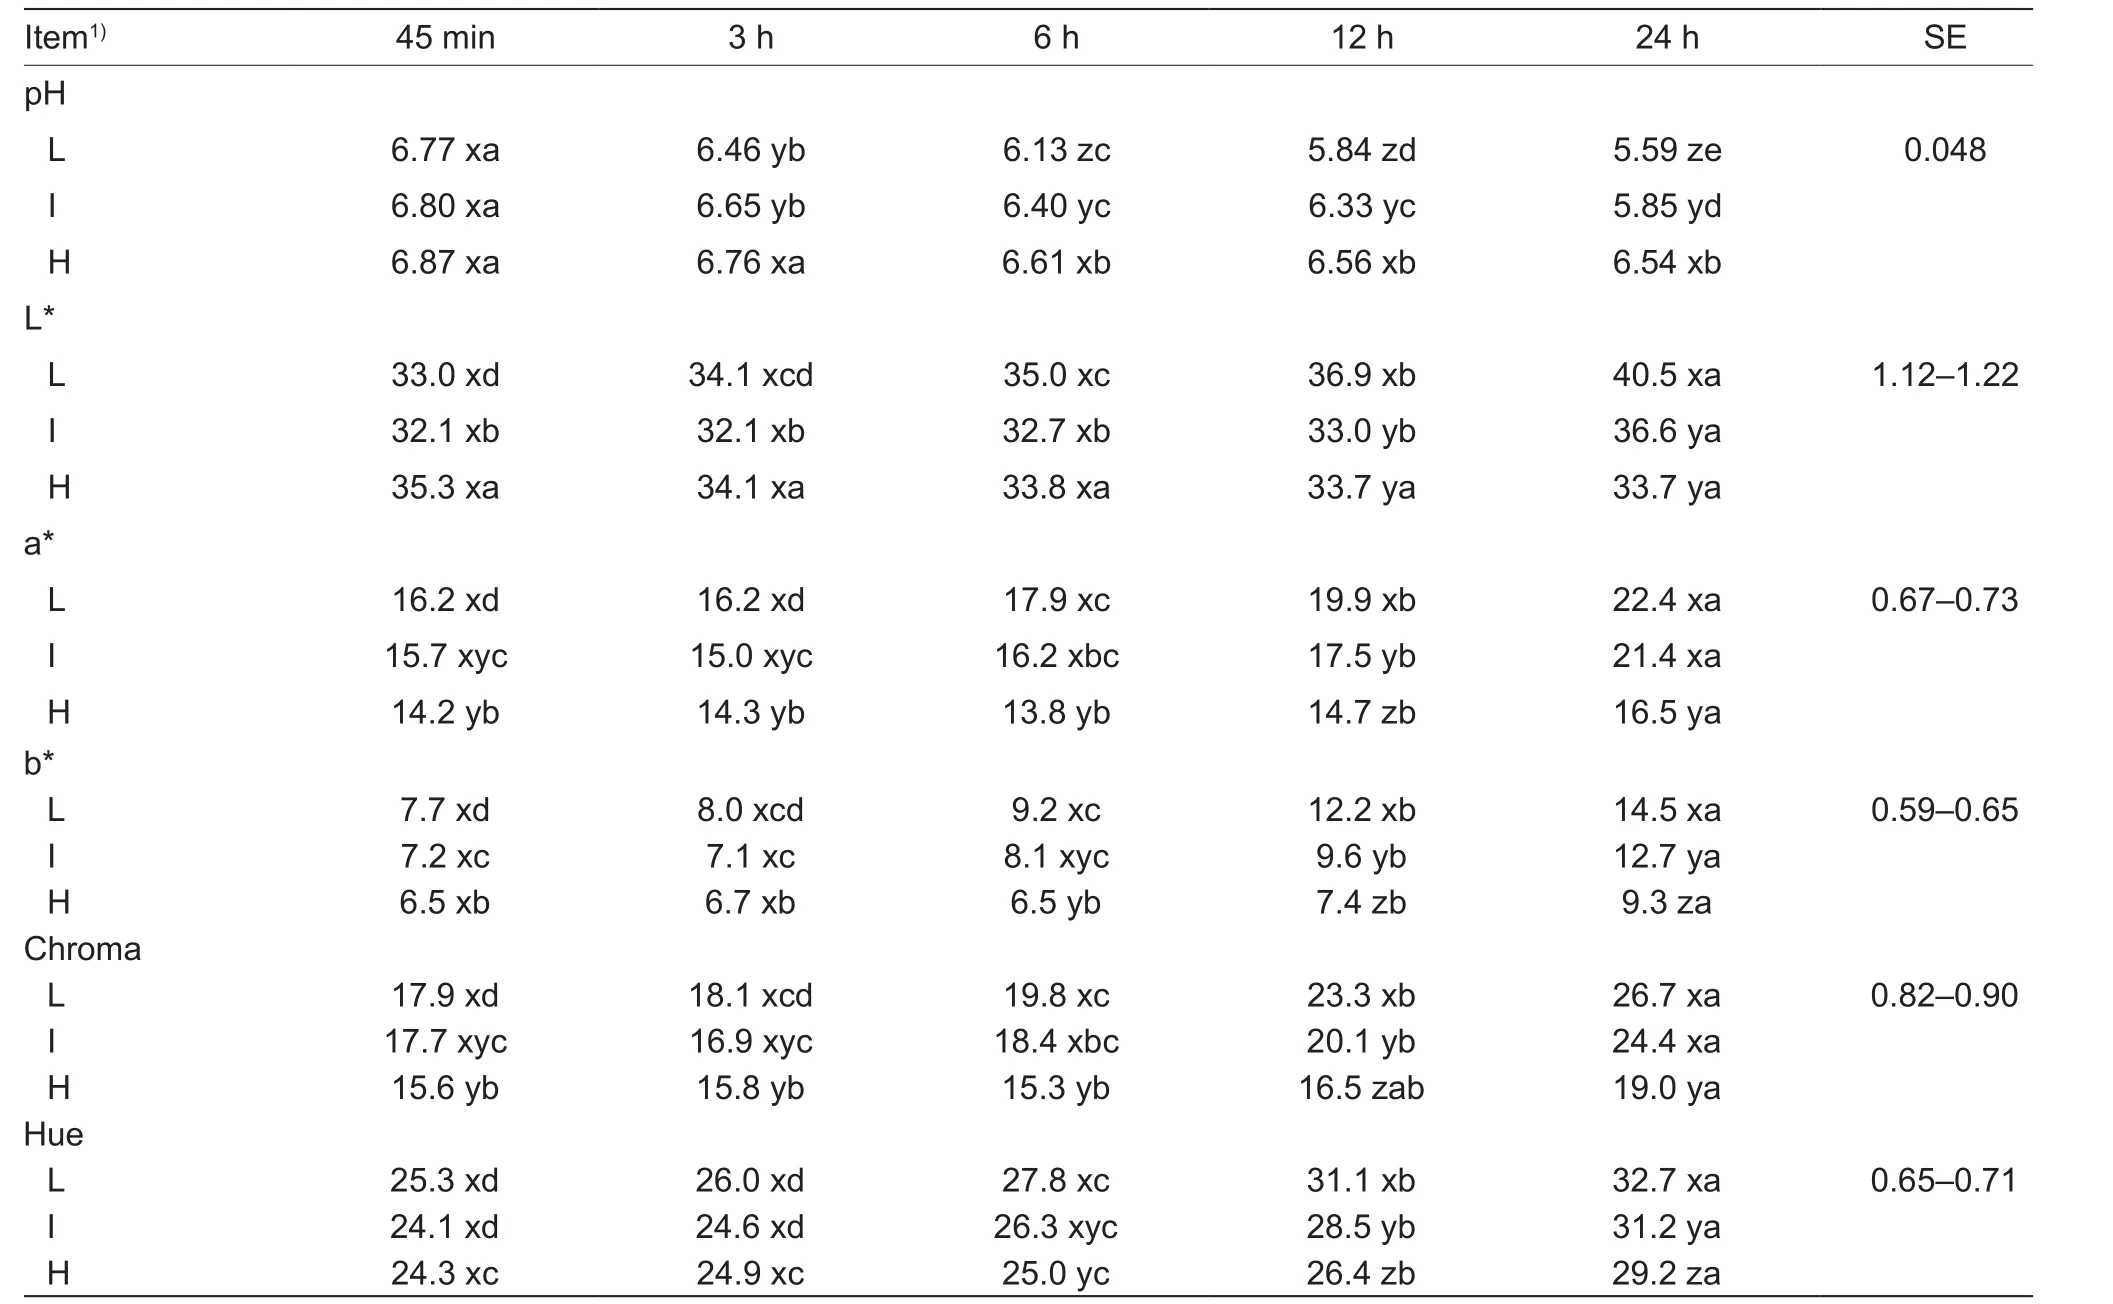
As expected, the pH in the normal pH group (5.40–5.79)exhibited the greatest decline, and the decline extent was smaller in the intermediate pHu group (5.80–6.09), while the absolute pH decline was least in the dark-cutting group(pH≥6.10), declining from 6.87 to 6.54 (Table 1).
The interaction of pHu and postmortem time had significant (P<0.05) effects on a*, b*, chroma and hue. a*and chroma of the dark-cutting group exhibited a lower level than the other two groups across the whole chilling time,due to the higher pH value than other groups.
All the color values of three pHu groups exhibited an increasing trend as postmortem time extended, except L*values of the dark-cutting group. The greatest increase in L*, a*, b*, chroma and hue values was seen in the normal pHu group over time. This indicates the normal beef was becoming lighter and redder, with higher color intensity(saturation) in line with a faster pH decline. The extent of the color increase of intermediate pHu beef was less than normal pHu beef. Meanwhile, a*, b*, chroma values of darkcutting beef remained near the initial levels for up to 12 h postmortem and this indicates that dark-cutting beef might be detected or predicted during the early postmortem time based on low initial a*, b* and chroma values.
There are few studies which have monitored the color changes during rigor onset. Hughes et al. (2014) and Murray (1989) investigated the color values at grading,and the grading time was 14 to 31 h after death. The color development was closely related to pH values, as shown,the normal pHu beef with a constant pH decline exhibited a constant color increase, while the dark-cutting beef with limited pH decline showed minimal color changes.The pH effect on beef redness is likely related to oxygen consumption. Immediately after slaughter, mitochondria remain capable of consuming oxygen if supplied withappropriate substrates. But with the pH decline during rigor, mitochondrial activity gradually decreases, allowing oxymyoglobin levels to increase, thus causing a much redder color. Typically, dark-cutting beef exhibits lower oxymyoglobin than normal pHu beef and this is evident with the greater mitochondria abundance in severe dark-cutting beef compared with normal pH beef (McKeith et al. 2016).

Table 1 pH value, CIE L*, a*, b*, chroma and hue value of beef during the early postmortem period according to pHu grouping
4. Conclusion
The Temp@pH6 obtained in this study could well reflect the average situation in China, with a high incidence of slow pH declines suggesting a significant potential for the occurrence of cold shortening. There is a need to introduce effective electrical stimulation systems into beef abattoirs in China, but this needs to be validated across the industry with measurement of other important traits such as shear force,sarcomere length, etc. The color of high pHu beef started at lower levels than normal meat very early postmortem,while its stable color properties within 12 h postmortem potentially allows early detection of dark-cutting before the ultimate pH is reached.
Acknowledgements
This work was supported by the Shandong Province Natural Science Fund, China (ZR2015CQ013), the earmarked fund for China Agriculture Research System (beef) (CARS-37),the General Financial Grant from the China Postdoctoral Science Foundation (2016M592229), the Special Fund for Innovation Team of Modern Agricultural Industrial Technology System in Shandong Province (SDAIT-09-09)and the funds of Shandong “Double Tops” Program, China(SYL2017XTTD12).
Apple J K, Machete J B, Stackhouse R J, Johnson T M, Keys C A, Yancey J W S. 2014. Color stability and tenderness variations within the gluteus medius from beef top sirloin butts. Meat Science, 96, 56–64.
Bendall J R. 1951. The shortening of rabbit muscles during rigor mortis; relation to the breakdown of adenosine triphosphate and creatine phosphate to muscular contraction.The Journal of Physiology, 14, 71–88.
Butler D. 2009. ASReml: ASReml fits the linear mixed model.R package version 3.0. [2009-01-05]. http://www.vsni.co.uk
Du Y, Zhang J, Hu T, Luo X. 2009. Effect of pre-slaughter conditions on beef quality. Scientia Agricultura Sinica, 42,3625–3632. (in Chinese)
English A R, Wills K M, Harsh B N, Mafi G G, VanOverbeke D L,Ramanathan R. 2016. Effects of aging on the fundamental color chemistry of dark-cutting beef. Journal of Animal Science, 94, 4040–4048.
Hamoen J R, Vollebregt H M, van der Sman R G M. 2013.Prediction of the time evolution of pH in meat. Food Chemistry, 141, 2363–2372.
Holdstock J, Aalhus J L, Uttaro B A, López-Campos Ó, Larsen I L, Bruce H L. 2014. The impact of ultimate pH on muscle characteristics and sensory attributes of the longissimus thoracis within the dark cutting (Canada B4) beef carcass grade. Meat Science, 98, 842–849.
Hopkins D L, Brooks A A, Johnston A R. 1993. Factors affecting subcutaneous fat depth at two sites on beef carcasses.Australian Journal of Experimental Agriculture, 33, 129–133.
Hughes J M, Kearney G, Warner R D. 2014. Improving beef meat colour scores at carcass grading. Animal Production Science, 54, 422.
Hwang I H, Devine C E, Hopkins D L. 2003. The biochemical and physical effects of electrical stimulation on beef and sheep meat tenderness. Meat Science, 65, 677–691.
Jacob R H, Hopkins D L. 2014. Techniques to reduce the temperature of beef muscle early in the postmortem period- A review. Animal Production Science, 54, 482–493.
Kim Y H B, Stuart A, Nygaard G, Rosenvold K. 2012. High pre-rigor temperature limits the ageing potential of beef that is not completely overcome by electrical stimulation and muscle restraining. Meat Science, 91, 62–68.
Lee M S, Yancey J W S, Apple J K, Sawyer J T, Baublits R T. 2008. Within-muscle variation in color and pH of beef semimembranosus. Journal of Muscle Foods, 19, 62–73.
Locker R H, Hagyard C J. 1963. A cold shortening effect in beef muscles. Journal of the Science of Food and Agriculture,14, 787–793.
McKeith R O, King D A, Grayson A L, Shackelford S D,Gehring K B, Savell J W, Wheeler T L. 2016. Mitochondrial abundance and efficiency contribute to lean color of dark cutting beef. Meat Science, 116, 165–173.
Murray A C. 1989. Factors affecting beef color at time of grading.Canadian Journal of Animal Science, 69, 347–355.
R Core Team. 2015. R: A language and environment for statistical computing. R Foundation for Statistical Computing, Vienna, Austria. [2015-01-12]. http://www.R-project.org/
Thompson J. 2002. Managing meat tenderness. Meat Science,62, 295–308.
van de Ven R J, Pearce K L, Hopkins D L. 2014. Post-mortem modelling of pH and temperature in related lamb carcases.Meat Science, 96, 1034–1039.
 Journal of Integrative Agriculture2018年7期
- Journal of Integrative Agriculture的其它文章
- Multi-mycotoxin exposure and risk assessments for Chinese consumption of nuts and dried fruits
- Effects of constant and stage-specific-alternating temperature on the survival, development and reproduction of the oriental armyworm, Mythimna separata (Walker) (Lepidoptera: Noctuidae)
- Migratory flight of insect pests within a year-round distribution:European corn borer as a case study
- Effects of temperatures on the development and reproduction of the armyworm, Mythimna roseilinea: Analysis using an age-stage,two-sex life table
- ldentification of summer nectar plants contributing to outbreaks of Mythimna separata (Walker) (Lepidoptera: Noctuidae) in North China
- Analysis on the migration of first-generation Mythimna separata(Walker) in China in 2013
