Executive turnover in China’s state-owned enterprises:Government-oriented or market-oriented?
Feng Liu ,Linlin Zhang
a Center for Accounting Studies,Xiamen University,China
b Center for Contemporary Accounting and Finance Research,Sun Yat-sen University,China
c Sun Yat-sen Business School,Sun Yat-sen University,China
1.Introduction
In private enterprises with ownership and management separation,shareholders aiming for wealth maximization tend to design compensation incentive contracts and job-dismissing schemes that reward good managers and punish or fire the bad ones(Jensen and Meckling,1976).In this single-task scenario,the principal designs incentive contracts that are compatible with the agent’s goal to avoid conflict of interests(Alchian and Demsetz,1972;Grossman and Hart,1983).However,state-owned enterprises(SOEs)have multiple objectives,including economic,political and social goals,such as the value maintenance and appreciation of state-owned assets,maintaining social stability and conforming to macroeconomic regulations and controls(Lin and Li,1997,2004).However,these goals are often conflicting,which mean that the government needs to design reasonable incentive contracts to motivate SOE executives to focus their efforts on different goals.Focusing on different goals implies different outcomes and differing levels of corporate governance efficiency(Holmstrom and Milgrom,1991).
Numerous studies have examined the relationship between manager turnover and performance among Chinese SOEs(Firth et al.,2006;Kato and Long,2006a,2006b;Chang and Wong,2009;Song and Song,2005;Jiang et al.,2014)based on the Western CEO turnover literature(Coughlan and Schmidt,1985;Warner et al.,1988;Dedman,2002;Defond and Hung,2004;Neumann and Voetmann,2005).However,few studies have examined the relationship between executive turnover and political performance among SOEs.Liao et al.(2009)use extra employment as a moderator variable to study its effect on the executive turnover-performance sensitivity of SOEs and examine the role that policy burden plays in the executive performance evaluation of SOEs.However,political performance is more than a moderator of evaluation.Bai and Tao(2006)take SOEs as multiple-task agents with political and economic goals,which is also emphasized by the ‘‘Measures for Comprehensive Evaluation of the Leadership in the Central Enterprises”(2009).Moreover,Lin and Li(1998,2004)study the strategic and social policy burdens of SOEs,whereas Liao et al.(2009)only consider the social burden.We consider both of these factors in this paper.Lastly,the performance evaluation of SOE executives can be structurally different due to the different levels of government intervention,which are influenced by preferences of the government principals and the institutional environment.Therefore,it is necessary to test the executive turnover-performance relationship among SOEs in different settings.
This paper focuses on the executive turnover of China’s SOEs and the implementation of the related evaluation mechanisms under different levels of government intervention.We examine data on Chinese state-owned listed firms’executive turnover from 1999 to 2012.First,we find that about half of the SOE executives leave office within two terms,in line with the ‘‘Interim Provisions on Business Performance Evaluations for Persons-in-Charge at Central Enterprises”(2003,2006,2009,2012),more than a third leave after less than one term and nearly 20%leave after more than two terms,which highlights the uncertainty and unpredictability of executive appointments in SOEs.Second,the executive evaluation mechanism for SOEs is implemented differently under different levels of government intervention.SOEs under weak intervention,such as those controlled indirectly by the government,controlled with low shareholdings,from non-regulated industries or in the Eastern regions,prefer the market-oriented evaluation method,which places more weight on executives’economic performance than on political performance.In contrast,those under strong intervention prefer the government-oriented evaluation method,which is characterized by policy burden.
Our paper is the first to thoroughly describe the executive turnover of Chinese state-owned listed firms.We make several contributions to the literature.First,we provide basic data for studying the managerial market and corporate governance of SOEs in the Chinese capital market.Second,we empirically test the theoretically important question of how multi-task incentive contracts work under different levels of government intervention(Holmstrom and Milgrom,1991).Finally,we show how SOE executives are evaluated and appointed,which helps us understand the relationship between SOE executive turnover and the managerial market,and shed light on the SOE marketization reform in China.
The remainder of this paper is organized as follows.Section 2 introduces the institutional background of SOE executive turnover in China,especially in relation to the changes in the SOE executive selection and evaluation mechanism.We also review the literature,present our theoretical analysis and develop our hypotheses in this section.In Section 3,we discuss the sample,variable measurement and research design.Section 4 presents the empirical results and robustness checks.Section 5 concludes the paper.
2.Institutional background and hypothesis development
2.1.Institutional background
The reform of Chinese SOEs began with the delegation of power and benefits(1979–1992),and then gradually shifted to the institutional innovation stage(after 1993)as the level of marketization increased.At the same time,the SOE executive appointment mechanism became non-administrative.Before 1992,the people in charge of enterprises that were owned by the state were appointed by government departments directly.The government officials participated in the production and operation of the enterprises that matched their administrative level,known as ‘‘red-crown businessmen.”In 1992,the state council promulgated the ‘‘Regulation on Transforming the Operating Mechanism of Industrial Enterprises Owned by the Whole People.”The provisions of Article 42 of the regulation state that ‘‘the government and relevant departments make appointment decision or approval of director of the enterprise(appointment and dismissal)as well as reward and punishment,in accordance with the statutory conditions and procedures.”After 1993,as the SOE marketization reform deepened,the Central Committee of the Communist Party of China issued the ‘‘Decision of the Central Committee of the Communist Party of China on Some Issues concerning the Improvement of the Socialist Market Economy,”which suggested that SOEs carry out the reform of the enterprise system and the joint stock system,and established a modern corporate governance mechanism.The method of selecting SOE leaders was changed to a new combination of organizational recommendation and market recruitment,thereby complying with the principle of party managing cadres and the mechanism of employing corporate managers through the market.Documents such as ‘‘The Decision of the Central Committee of The Communist Party of China on Major Issues Concerning the Reform and Development of State-Owned Enterprises”issued in 1999,‘‘The Basic Code for Establishing Modern Enterprise System in Large and Medium-Sized State-Owned Enterprises(for Trial Implementation)” in 2000,and the ‘‘Reform Outline for Deepening Leaders Personnel system”in 2000,all emphasized the above selection mechanism.Although the documents encouraged the development of diversified ways of introducing business talent,SOE executives continued to be selected in an administrative manner and stressed the principle of party managing cadres at this stage(1992–2000).
After the establishment of the State-Owned Asset Supervision and Administration Commission(SASAC)of the State Council in 2003,the supervisory power over SOEs shifted to the newly established SASACs from the various established departments,such as the Ministry of Finance,the Economic and Trade Commission,the Commission for Discipline Inspection and the Party Committee Organization Department.As the actual controllers of the SOEs,the SASACs at all levels took charge of personnel,affairs and assets directly.The‘‘Interim Measures for the Supervision and Administration of State-Owned Assets of the Enterprises”issued in 2003 and ‘‘Law of the People’s Republic of China on the State-Owned Assets of Enterprises” issued in 2008,both emphasized that the SASACs had the power to appoint or dismiss,or suggest the appointment or dismissal of executives of SOEs.In particular,the appointment of central SOE executives was divided into two parts,with the Organization Department of the Central Committee appointing and evaluating the Party Secretary,Chairman and CEO of the 53 large central SOEs with the help of the Enterprise Leaders No.1 Management Bureau of SASAC,and the Party Committee Organization Department of SASAC taking charge of the other executives.The Enterprise Leaders No.2 Management Bureau of SASAC is tasked with appointing and evaluating executives from other central SOEs besides the 53 large firms,including the Party Secretary,Chairman,CEO,vice-presidents and other senior managers.The senior executives of local SOEs are under the mutual control of the local SASAC and local Party Committee Organization Department.
To promote the reform of the SOE executive selection and appointment mechanism,SASAC issued the‘‘Notice for Accelerating the Open Recruitment of Managers and Going on Duty on a Competitive Bases in Central SOEs”in 2004,which promoted the recruitment of managerial talent in a market-oriented manner.Based on the open recruitment practices and the competition for office in 2003 and 2004,SASAC tried to make a trade-off between the party-oriented management principle and market-oriented recruitment practice,thereby turning the bureaucratic appointment practice into a market-dominated recruitment and probationary practice.By 2013,together with the Organization Department of the Central Committee,SASAC had organized eight recruitments,offered 145 positions in central SOEs in executives and successfully recruited 140 managers.More details of the recruitments are shown in Table 1.
The transformation of the SOE executive selection and appointment mechanism indicates that market oriented recruitment is now the trend.However,bureaucratic appointment and dismissal is still a major part of the executive selection process in large SOEs,especially those directly controlled by SASAC.The notices of SOE executive appointment or dismissal issued by local SASACs and the local Party Committee Organization Department present the same scenario.1Refer to the websites:http://renshi.people.com.cn/n1/2016/0415/c139617-28280141.html;http://www.sx-dj.gov.cn/admin/pub_newsshow1.asp?id=1127601&chid=100196.
The marketization reform of SOEs has led to the executive evaluation mechanism becoming performanceoriented,and more details of these changes are shown in Table 2(Appendix A).After 2003,SASAC promulgated a series of ‘‘Interim Provisions on Business Performance Evaluations for Persons-in-Charge at Central Enterprises”(2003,2006,2009,2012),which set the principles and rules for assessing the operational performance of executives in central SOEs,and the local SASACs adopted similar methods based on these documents.The local SASACs at different levels assess executives’annual operational performance and performance during their service term according to the letter of liabilities for operational performance signed every year and theyear when the executive took office.This method is different from that practiced in the past.For example,the ‘‘Rules of Awards and Punishments on the Factory Managers(Managers)for State-owned Enterprises”issued in 1994 evaluated factory managers based on their political quality and capabilities for planning consistent with the planned economy,rather than their competitive and strategic capabilities for operations and management consistent with a market economy.Although economic performanceisan important factor in the current evaluation process,political performance is still taken into consideration.Thus,the evaluation of SOE executives is not fully market-oriented.The tenure of SOE executives is uncertain because the SASACs are in charge of executive appointments and dismissals and can transfer executives to other posts at any time when needed.That is,the three-year service term assessment is an evaluation method rather than a tenure contract,and its implementation is not that credible.
Furthermore,most SOE executives have an administrative rank,which enables them to act as a government official according to the ‘‘Working Regulations on the Selection and Appointment of the Party and Government Leaders” (1995,2002,2014)and ‘‘Provisions of the Exchange among the Party and Government Leaders”(1999,2006).Hence,the exit mechanism that is used to restrict the moral hazards of SOE executives does not work efficiently.Unless there are serious violations of laws and discipline,the vast majority of SOE executives remain in the regime for their entire lives,in a general form of‘‘jobs for life.” To provide a better understanding,Table 3 gives some examples of SOE executives who have become government officials.
2.2.Theoretical analysis and hypothesis development
The governance of SOE executives is a multi-dimensional topic involving numerous significant factors,such as turnover and compensation.The SASACs evaluate executives’political and economic performance,and decide the appropriate rewards and punishments based on the executives’behavior during their service term(‘‘Interim Provisions on Business Performance Evaluations for Persons-in-Charge at Central Enterprises”(2003,2006,2009,2012)).Compared with the compensation incentives,executive turnover is more fundamental.Different posts mean different degrees of power for resource allocation due to the different control rights.Some executives may be promoted to a controlling shareholder’s company or government department,while others may be demoted to a subsidiary(Chen et al.,2010;Yang et al.,2013;Liu and Xiao,2015;Zhang et al.,2015).In fact,the appointment and dismissal of SOE executives can be seen asan implicit promiseor call(put)option by the SASACs,similar to the stock options held by executives,whose value depends on the performance during their service term.Tenure measures the time in which an SOE executive waits to receive a promotion or demotion,which reflects how the controlling shareholders govern the corporation.With a short tenure,the principal can make rapid personnel adjustments based on performance to reduce further losses owing to the agency problem.However,the agent may also seek short-term success to obtain instant benefits if the expected tenure is short.Alternatively,the agent may work ineffectively if the tenure is long,bringing about ‘‘no big achievements,no small mistakes.”
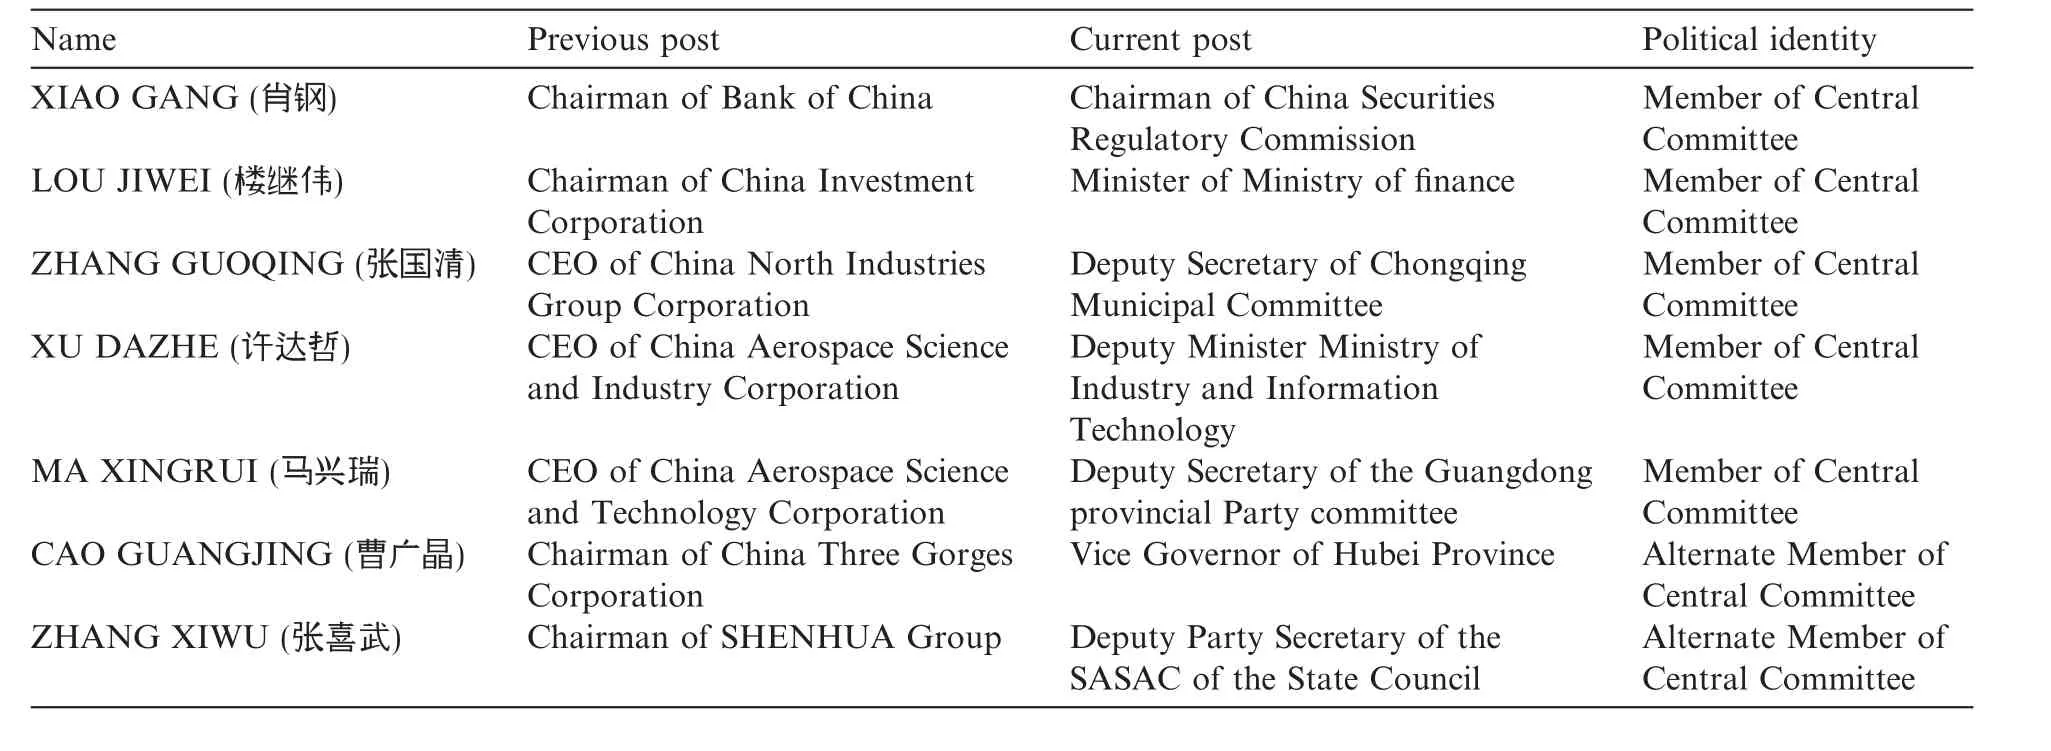
Table 3 Examples of executives becoming government officials for central SOEs in 2013.
Different from the CEO turnover of private firms,the appointment and dismissal of SOE executives are uncertain events that are influenced by multiple factors(Wang,2001).This uncertainty can be verified by factors such as the unpredictable nature of personnel mobilization and the inconsistent implementation of the evaluation mechanism in SOEs.
As agents of state-owned assets,SOE executives should,in principle,operate legally and effectively,complete the evaluation targets and achieve the value maintenance and appreciation of state-owned assets.2Refer to Article 8 of Chapter 1 of the ‘‘Law of the People’s Republic of China on the State-Owned Assets of Enterprises” (2008).However,because governments at different levels control the appointment and removal of the SOE executives under their jurisdiction,executives need to achieve political and economic objectives.These political tasks include the various policy burdens that SOEs bear,such as having to adhere to the macroeconomic control and strategic planning of the national economy,help avoid unemployment and maintain social stability.SOE executives have to bear both the political and economic tasks,which can result in their promotion or demotion,with the former occurring implicitly and the latter explicitly(Yang et al.,2013).Moreover,political tasks tend to deviate from firms’value targets and conflict with their profits,thereby increasing the information noise in the SOE executive evaluation process.Therefore,the SASACs need to make a trade-off between the economic and political performance of SOE executives,as represented in the following functional relationship:where EB represents executives’economic performance,PB represents political performance and θi(i=1,2,3,4,5...)represent the different degrees of marketization of the economy,which change the weights of EB and PB in the assessment.The different market conditions also signify different levels of government intervention,and different competitive and regulatory environments(Fan et al.,2003).Whether SOEs are run by central or local governments,controlled directly or indirectly by the SASACs,controlled with high holdings or low holdings,from regulated industries or non-regulated industries or located in the Midwestern or Eastern regions,all face different levels of government intervention and competitive environments(Cao et al.,1999;Bai and Tao,2006;Xia and Chen,2007;Xin and Tan,2009).Thus,structural differences need to be taken into account when evaluating the performance of SOE executives.That is,different weights need to be given to executives’economic and political performance in different situations.

As supervisor of the central SOEs,SASAC of the State Council is more independent than the local SASACs.In addition,because central SOEs draw significant attention due to their huge assets and economic status,SASAC of the State Council is more likely to strictly evaluate the performance of the SOE executives under its jurisdiction in accordance with the provisions when making personnel decisions.In contrast,local government officials are encouraged to assign political tasks to SOE executives as policy burdens to achieve their political goals.Local SOE executives have incentives to develop political connections to bear the policy burden,and cater to the political preferences of their superiors to accumulate promotion capital(Huang,2003,2004;Zhou,2007).Hence,local government officials are likely to collude with SOE executives to achieve their own promotion benefits,thereby rendering the performance appraisal process invalid.
Considering other government intervention scenarios,Xia and Chen(2007)point out that China’s decentralization reform,including the economic decentralization of the central government and local governments,and the decentralization of local governments and enterprises,has changed the manner in which governments control SOEs.According to the ‘‘Seize the Big and Free the Small” and ‘‘Strategic Adjustment” reform strategies for SOEs,the government strengthened its control of the economy by taking direct holdings and high proportions of ownership of select SOEs that are large-scale,strategically important,from regulated industries or are economic lifelines,such as the military and the petrochemical industries.At the same time,the government has relaxed its control of SOEs that are small-scale or from competitive industries by taking indirect holdings and a low proportion of ownership.This phenomenon is more common in the Eastern regions,which have a high degree of marketization.The local governments in the East took the initiative to relax their control of SOEs by reducing the level of government intervention in the SOEs under its jurisdiction,thus reducing the amount of information noise in the performance evaluation process,increasing the efficiency of executives’efforts and performance and reducing the agency problem.In the Eastern regions,where the non-state-owned economy is relatively active,private firms and foreign firms can also provide information to the local SASACs and increase the effectiveness of incentive contracts,thus further reducing the uncertainty(Lin and Li,1997,2004;Chen et al.,2010).
Accordingly,we predict that the relationship between executive turnover and performance among SOEs is different under different levels of government intervention and different market scenarios,such as the actual controllers having different backgrounds,shareholdings by different controlling parties and in different proportions and different industries and regions.
H1.Under weak government intervention,economic performance is more important relative to political performance in the executive evaluation process in SOEs.
That is,we predict that under strong government intervention,in which executives are driven by the personal promotion incentives of government officials,political performance is a more important factor in the managerial evaluation of SOEs and the SASACs prefer the bureaucratic selection procedure.
The weak government intervention scenario includes central SOEs,local SOEs indirectly controlled or owned with low holdings by governments and local SOEs located in the Eastern regions.The strong government intervention scenario includes local SOEs,especially those directly controlled or owned with high holdings by government,and local SOEs located in the Central and Western regions.Thus,
H1a.The political performance of executives is more important in local SOEs than in central SOEs.
H1b.The political performance of executives is more important in local SOEs directly controlled by the government than those indirectly controlled.
H1c.The political performance of executives is more important in local SOEs with high government holdings than those with low holdings.
H1d.The political performance of executives is more important in local SOEs in regulated industries than those in competitive industries.
H1e.The political performance of executives is more important in local SOEs located in the Central and Western regions than those in the Eastern regions.
Based on the above analysis,we analyze the turnover frequency and tenure distribution of SOE executives,and the managerial evaluation of SOEs under different levels of government intervention,to identify the three main characteristics of the current appointment and dismissal incentive mechanisms for SOEs,namely the uncertainty of executive turnover,the unpredictable nature of personnel mobilization and the inconsistency of the implementation of the evaluation mechanism in SOEs.
3.Research design
3.1.Sample selection and data sources
This paper focuses on the executive turnover of Chinese SOEs.We collect our sample in three steps.First,we determine the primary sample firms.To ensure consistent and pure observations and consider the changes of corporate control rights,we choose the A-share companies listed on the Shanghai and Shenzhen stock exchanges from 2003 to 2012 that were consistently state-owned for 10 years.3Since 2003,China’s listed companies have begun to disclose the controlling shareholder.As of 2004,according to ‘‘Standards for the Contents and Formats of Information Disclosure by Companies Offering Securities to the Public No.2–Contents and Formats of Annual Reports”issued by the CSRC,listed companies began to disclose the actual controller.Second,based on this SOE sample,we collect the personal information of executives from the China Stock Market and Accounting Research(CSMAR)database and annual reports dating back to 1999.We presume that the SOEs in our sample before 2003 are also consistently SOEs.4Prior to 2003,transfers of the control rights of listed companies were strictly controlled.Thus,in this paper,we assume that the nature of corporate property rights during 1999–2002 was in line with that of year 2003,for the personal information of executives is dated back to 1999.Thus,we observe the executive turnover of SOEs from 1999 to 2012.Here,the executives consist of Chairmen,CEOs and Party Secretaries(abbreviated ‘‘the Heads”).Finally,we use the same method to determine the sample of NSOEs,which we use as our control group.By comparing the differences in turnover frequency,tenure distribution and turnover-performance of executives in SOEs and NSOEs,we are able to ascertain the nature of the executive turnover in SOEs under the current incentive mechanism.
In the literature,the propensity score matching approach based on the classification of industry and assets is usually used to determine the control group.In our paper,we use panel data on firms that are non-stateowned for 10 or more consecutive years as our matching sample,compared with SOEs that are state-owned for 10 or more consecutive years.This approach has two advantages.First,it avoids the sample insufficiency problem in the traditional matching method.Second,it makes the comparison between SOEs and NSOEs more effective.Because executives are motived by different evaluation and incentive schemes in SOEs and NSOEs,we distinguish the treatment group and control group by property rights rather than industry and scale.Table 4 shows the industry distributions of SOEs and NSOEs,which are structurally similar,thus alleviating concerns about industrial differences.Later,we compare the differences in scale between SOEs and NSOEs.
To accurately describe the turnover frequency,tenure distribution,and turnover-performance sensitivity of SOE executives,we screen the data as follows:(1)remove executives who left office in 1999;(2)removeexecutives who took office after 2010,and remained in office until 20125We remove the following from the sample:executives who left in 1999,and those that took office after 2010 but did not leave prior to 2012.For the former,we could not confirm the time they took office and their tenure because of missing data.For the latter,considering the requirements for executive tenure of SASAC and ‘‘The Company Law of the PRC,” that executives be evaluated once in three years and directors every three years,we removed this group due to the lack of observations.and(3)remove firms from the financial industry.In the end,the NSOE sample consists of 17,175 executive-year observations of 3885 executives from 608 NSOEs,among which 2705 left prior to 2012,accounting for 69.63%of the total,and the remaining 30.37%were in office until 2012.The NSOE sample consists of 5186 executive-year observations of 1227 executives from 225 SOEs,among which 838 left prior to 2012,accounting for 68.3%of the total.Together,these figures indicate that about 70%of the executives in the SOE and NSOE samples experienced at least one change of position.More details of the turnover are shown in the empirical section.
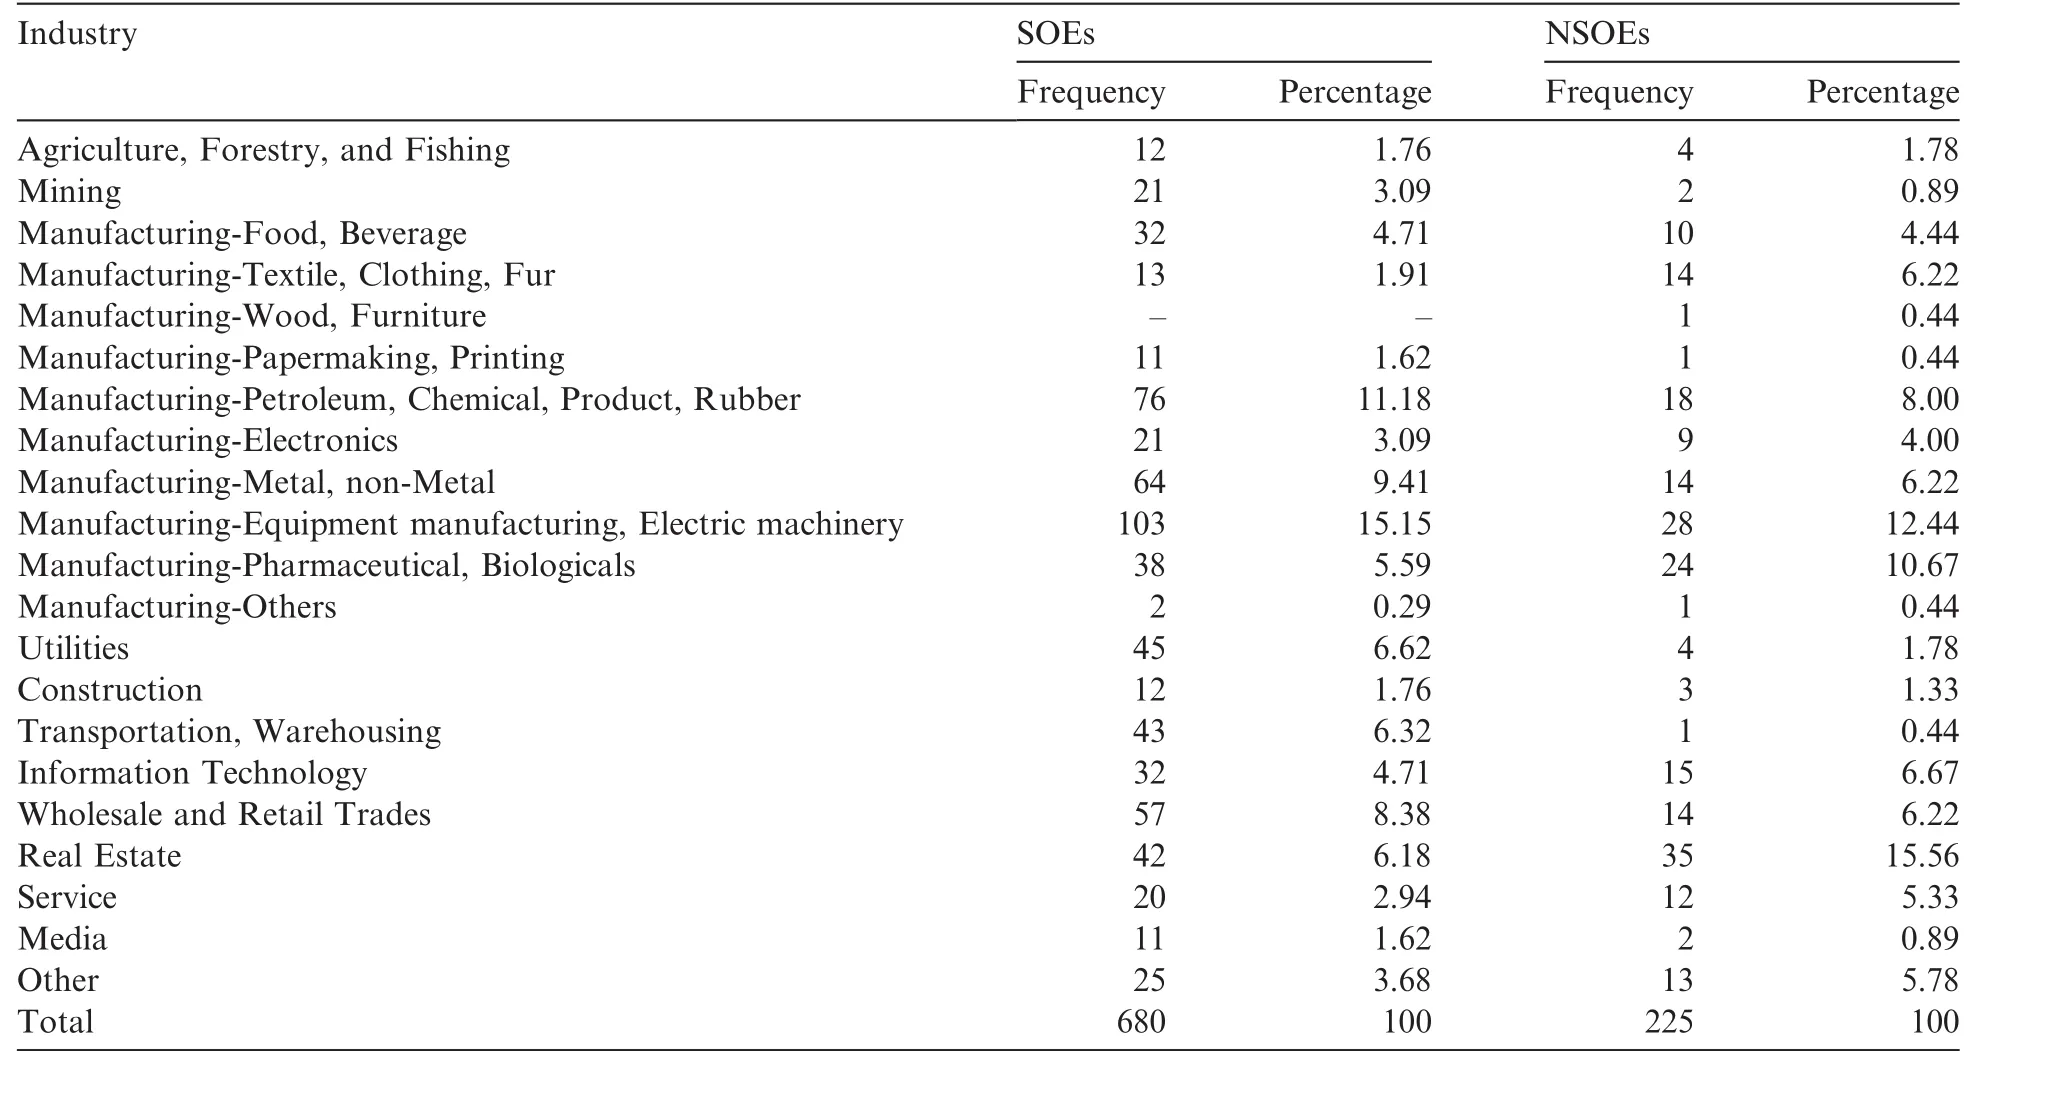
Table 4 Industry distribution of SOEs and NSOEs.
Table 4 shows the industry distribution of SOEs and NSOEs based on the ‘‘Guidelines for the Industry Classification of Listed Companies”issued by the China Securities Regulatory Commission(CSRC)in 2001.Ranking the industries based on their proportion from large to small,we find that SOEs and NSOEs have a similar industry distribution,overlapping by 67%.Thus,the industrial distribution of SOEs and NSOEs is sufficiently systematically consistent to meet our research requirements.The overlapping industries of SOEs and NSOEs include ‘‘Manufacturing-Food,Beverage(C0),” ‘‘Manufacturing-Petroleum,Chemical Products,Rubber(C4),” ‘‘Manufacturing-Metal,non-Metal(C6),” ‘‘Manufacturing-Equipment Manufacturing,Electric Machinery(C7),” ‘‘Manufacturing-Pharmaceutical,Biologicals(C8),” ‘‘Information Technology(G),” ‘‘Wholesale and Retail Trades(H)” and ‘‘Real Estate(J).”
3.2.Model specification and variable measurement
Based on the laws and regulations concerning the executive evaluation of central SOEs issued by SASAC of the State Council from 2003 to 2012,and following Liao et al.(2009),Liao and Zhang(2012),Ding and Song(2011),Yang et al.(2013)and Liu and Xiao(2015),we use the binary ordered logit model to examine the different implementations of the executive evaluation mechanism in SOEs.The model is as follows:

where Leave is a dummy variable that equals 1 if the executive leaves,and 0 if he or she is in office;and Performance measures the economic performance of SOE executives,which equals ROE adjusted by the industry median according to the ‘‘Interim Provisions on Business Performance Evaluations for Persons-in-Charge at Central Enterprises”(2003,2006,2009,2012)and the literature.We use other profit variables to carry out the sensitivity test.
Policy in model(2)measures the political performance of SOE executives in relation to the policy burden.We calculate Policy following Lin and Li(2004)and Bai and Lian(2014).We build model(3)to estimate the optimal capital intensity for SOEs,and obtain the policy burden by calculating the deviation between the actual capital intensity and the optimal one determined by economic factors.Positive errors from model(3)indicate the strategic burden,which originates from the extra investment in comparatively competitive industries spurred by local economic growth(Qian and Roland,1998).
Negative errors indicate the social burden,which originates from the extra employment in SOEs.We use the absolute form of errorsμto measure the policy burden(Policy)of SOEs.

where INTENCtrepresents the capital intensity,measured by employment per million assets in t year,Sizet-1represents the size in t-1 year,Debtt-1represents the capital structure in t-1 year,Growtht-1represents the growth in t-1 year,ROAt-1represents the profit in t-1 year,Capitalt-1represents the tangibility in t-1 year and District,Year and Industry are dummies.
The other variables in model(2)are Size,which represents size measured by the logarithm of assets;Leverage represents financial leverage measured by the debt ratio and Growth represents sales growth.All of these variables are controlled for firm specific characteristics.Indep is the ratio of independent directors on the board,which controls for corporate governance(Zhao et al.,2007;Laux,2008).Age60 is a dummy variable that equals1 if the executive is older than 60,otherwise0.Age measures the age of executives and Tenure represents their service time.These variables control for the personal characteristics of executives.
Lastly,we control for institutional factors that signify different levels of government intervention,namely,Market,which comprises the variables Level,Direct,Control,Monopoly and District,which measure the different dimensions of government intervention.Here,Level is an ordinal variable representing the administrative level of SOEs,which equals 1 if a firm is a central SOE,2 if a firm is a provincial SOE and 3 if a firm is a municipal SOE or an SOE below the municipal level.Due to the promotion tournament,local SOEs face more intervention than central SOEs(Zhang et al.,2015).Direct equals 1 if an SOE is controlled directly,and 0 if an SOE is controlled indirectly,for which the control chains are more than two.Fan et al.(2013)find that local governments are inclined to place the SOE sthey want to relax control at the bottom of the pyramid structure.Control equals 1 if an SOE is controlled no less than 30%,and 0 if an SOE is controlled less than 30%.The higher the holdings,the stronger the government intervention.Monopoly is an industry dummy that equals1 if an SOE is in a regulated industry,and 0 if an SOE is in a non-regulated industry.Following Xin and Tan(2009)and Xia and Chen(2007),we classify industries in relation to national security,natural monopoly,public goods and services and high technology,such as the mining(B),petroleum,chemical products and rubber(C4),metal and non-metal(C6),utilities(D)and information technology(G)sectors.District is a dummy for region that equals 1 if a firm is located in the Eastern regions,and 0 if a firm is located in the Central and Western regions.Level,Direct and Control represent the different types of government intervention,which are arranged endogenously,whereas Monopoly and District represent the different market environments,such as the different managerial markets and different levels of government intervention,which are exogenous,that directly influence the effectiveness and efficiency of the SOE executive evaluation mechanism.
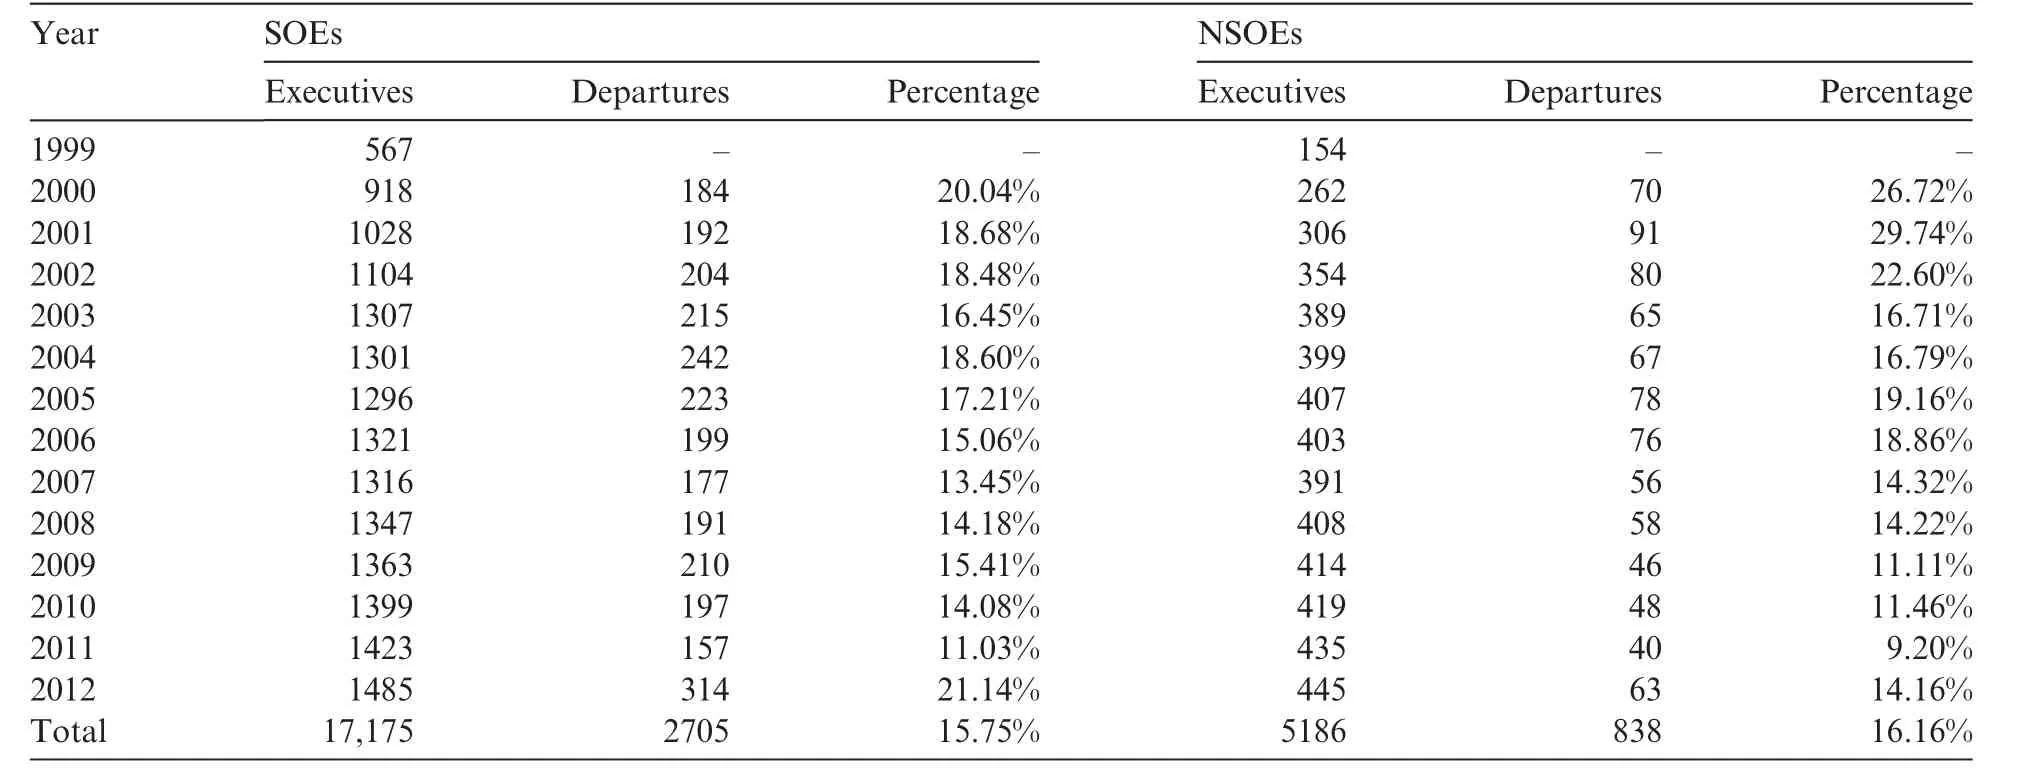
Table 5 The executive turnover of SOEs and NSOEs.
To examine the different implementations of the SOE executive evaluation mechanism under different market conditions,we regress model(2)by groups of MARKET,which comprises five groups:(1)Group one:central SOEs vs provincial SOEs vs municipal SOEs and SOEs below the municipal level;(2)Group two:local SOEs with indirect holdings vs local SOEs with direct holdings;(3)Group three:local SOEs with low holdings vs local SOEs with high holdings;(4)Group four:local SOEs from non-regulated industries vs local SOEs from regulated industries and(5)Group five:local SOEs located in the Eastern regions vs local SOEs located in the Central and Western regions.Moredetails of the results are shown in the following tables.Moreover,to mitigate the effects of outliers,we winsorize the continuous variables at the 1%level in both tails.
4.Empirical results
4.1.The turnover frequency and tenure distribution
In this paper,we aim to ascertain the characteristics of the executive appointment and dismissal mechanism of SOEs.We first describe executives’turnover frequency and tenure distribution.
In the previous part,we briefly summarized the turnover of SOEs and NSOEs.That is,70%of executives left office between 2000 and 2012,6We choose 2012 as the endpoint of our observation for a number of reasons.First,according to the ‘‘Interim Provisions on Business Performance Evaluations for Persons-in-Chargeat Central Enterprises”(2003,2006,2009,2012),SOE executives get evaluated every three years,and the evaluations can be divided into several periods after the establishment of SASAC,that is,2003–2006,2007–2009 and 2010–2012.Second,2012 is the new start of the SOE reform after the Eighteenth National Congress of the Communist Party of China decided to trial a mixed ownership reform.At the same time, the anti-corruption work inside the SOE system was in full swing, and a large number of SOE executives were sacked. Because these exogenous shocks brought about structural changes in the executive turnover, we chose 2012 as a watershed.whereas 30%remained in office until 2012,and there were no obvious differences between the treatment group and control group.Table 5 presents the turnover frequency,which shows that on average,about 15.75%of SOE executives leave office each year,slightly lower than the 16.16%/year in NSOEs.7The results remain unchanged after eliminating executives leaving due to retirement,illness or other reasons.Also,the executive turnover before 2003 is higher than that after 2003.
Later,we examine the tenure distribution of SOE executives compared with that of NSOE executives based on the turnover data to further confirm our assumption about the uncertainty of the executive appointments in SOEs.
For SOEs,the overall median tenure of executives is four years,with executives who remain in office staying for six years and executives who leave office leaving after three years on average.For NSOEs,the overallmedian tenure of executives is three years,with executives who remain in office staying for seven years and executives who leave office leaving after two years on average.Furthermore,we set the tenure as short if the service time of an executive is less than three years,normal if the service time is not more than seven years but not less than three years and long if the service time is more than seven years.We make the above classifications according to the ‘‘Company Law of the People’s Republic of China(2005),” ‘‘Interim Provisions on Business Performance Evaluations for Persons-in-Chargeat Central Enterprises”(2003,2006,2009,2012)and‘‘Civil Servant Law of the People’s Republic of China” (2005),which outline the requirements for tenure,such as ‘‘each term of office for directors shall not exceed 3 years,”a ‘‘three-year evaluation mechanism”and ‘‘no more than two terms of office for Party and Government leaders.”

Table 6 The tenure distribution of executives from SOEs and NSOEs.
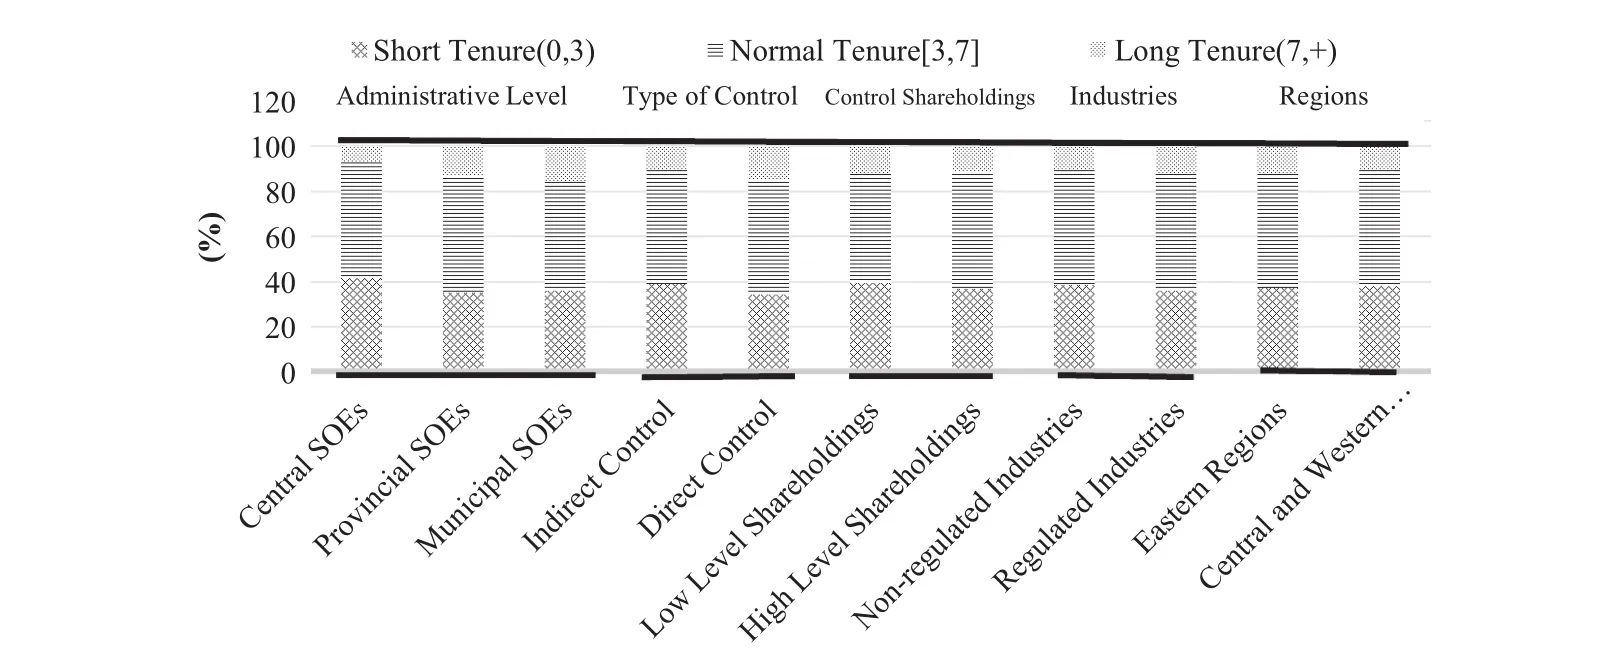
Figure 1-1.The tenure distribution of SOE executives leaving office(70%).
Table 6 presents the structural differences in tenure distribution between SOEs and NSOEs.Overall,the tenure distribution of SOEs and NSOEs is similar.The normal tenure accounts for 50%,whereas the short and long account for 30%and 20%,respectively,for both SOEs and NSOEs.However,the above distribution changes when we distinguish those leaving from those remaining.For the executives who remain in office,the normal tenure comprises 59.01%in SOEs,which is more than the 53.42%in NSOEs.For the executives who leave office,the normal tenure comprises51.15%in SOEs,while the short tenure is52.82%in NSOEs.By comparison,executives in NSOEs change more frequently than those in SOEs,which indicates that the turnover performance relationship in NSOEs is probably more sensitive.
Thus far, we have compared the turnover frequency and tenure distribution of SOEs with those of NSOEs.Next,we examine the turnover of SOE executives by the different groups.Figs.1-1 and 1-2 show the tenure distribution under different levels of government intervention,types of control,industries and regions.There are five scenarios from left to right:the first corresponding to SOEs of different administrative levels,the second the different types of control,the third the level of shareholdings,the fourth from different industries and the fifth from different regions.

Figure 1-2.The tenure distribution of SOE executives remaining in office(30%).
Fig.1-1 shows the tenure of SOE executives who leave office,in which the tenure distribution is similar across the different subsamples.That is,the majority leave after a normal period of tenure,and the minority after a long tenure.Taking government intervention into account,we find that executives from SOEs under weak government intervention,such as central SOEs,local SOEs indirectly controlled,SOEs controlled with lower holdings and those from non-regulated industries or the Eastern regions,are more likely to stay in office for a shorter term than those from SOEs under strong intervention.Taking the first scenario as an example,the average tenure in local SOEs is3.84,which is higher than 3.43 for central SOEs.Fig.1-2 shows the tenure of SOE executives who remain in office,in which the normal tenure accounts for a relatively high proportion in SOEs with a high degree of marketization,whereas the figures are the opposite for long tenure.
Overall,the turnover figures for SOE executives show that compared with NSOEs,SOE executives change positions less frequently.Moreover,there are structural differences among the SOEs.Specifically,the weaker the government intervention,the higher the executive turnover and the shorter the tenure of executives.Next,we examine the turnover-performance sensitivity.
4.2.Univariate analysis
Based on the above turnover figures,we next examine the implementation of the SOE executive evaluation mechanism.We first conduct univariate tests,and then regressions.We then compare the results of SOEs and NSOEs,and the subsamples of SOEs,such as central SOEs and local SOEs,local SOEs with different types of control and levels of government shareholdings and local SOEs from different industries or regions,to determine how the incentive mechanism of executive turnover works.
Table 7-1 shows the results of the univariate tests among the different groups.The first column shows the mean difference of executives’economic performance adjusted by the industry median and the second corresponds to executives’political performance,measured by the policy burden calculated based on model(3).Panel A lists the mean differences between executives remaining in office and those leaving office in NSOEs as the control group.Panel B consists of five parts,which list the mean difference of executives in SOEs from different perspectives.In consideration of the different scenarios of government intervention,we divide the SOEs into five groups.Panel B-1 corresponds to group one,classified by administrative level and consists of central SOEs,provincial SOEs,municipal SOEs and SOEs below the municipal level.To avoid the structural differences between central and local SOEs influencing the other groups,Panels B-2 to B-5 are for local SOEs.
Taking the left column first,the mean differences are all significantly positive,from Panel A to Panel B-5,executives who remain in office perform better than those who leave office,regardless of whether they are in SOEs or NSOEs,or the level of government intervention.However,there are some significant differences.The mean difference in Panel A is 0.03,far higher than that for SOEs.Because the CEO and Chairman of an NSOE have no room for promotion,an executive leaving office usually means he or she has been fired or demoted internally,excluding those who depart due to retirement,illness or death.Table 7-1 shows that executives who leave office in NSOEs perform worse relative to those who remain in office,thus meeting our expectations.In Panel B,the mean difference in tenure between executives who remain in office and those who leaveoffice is relatively larger in SOEs under weaker government intervention.The right column shows the figures for political performance.The mean difference is insignificant in Panel A,whereas in Panel B,the mean difference of the policy burden is significantly negative in SOEs under strong government intervention,such as local SOEs,SOEs directly controlled by SASACs,SOEs controlled with high shareholdings,and SOEs from regulated industries and those from the Central and Western regions,which validates our conjectures.
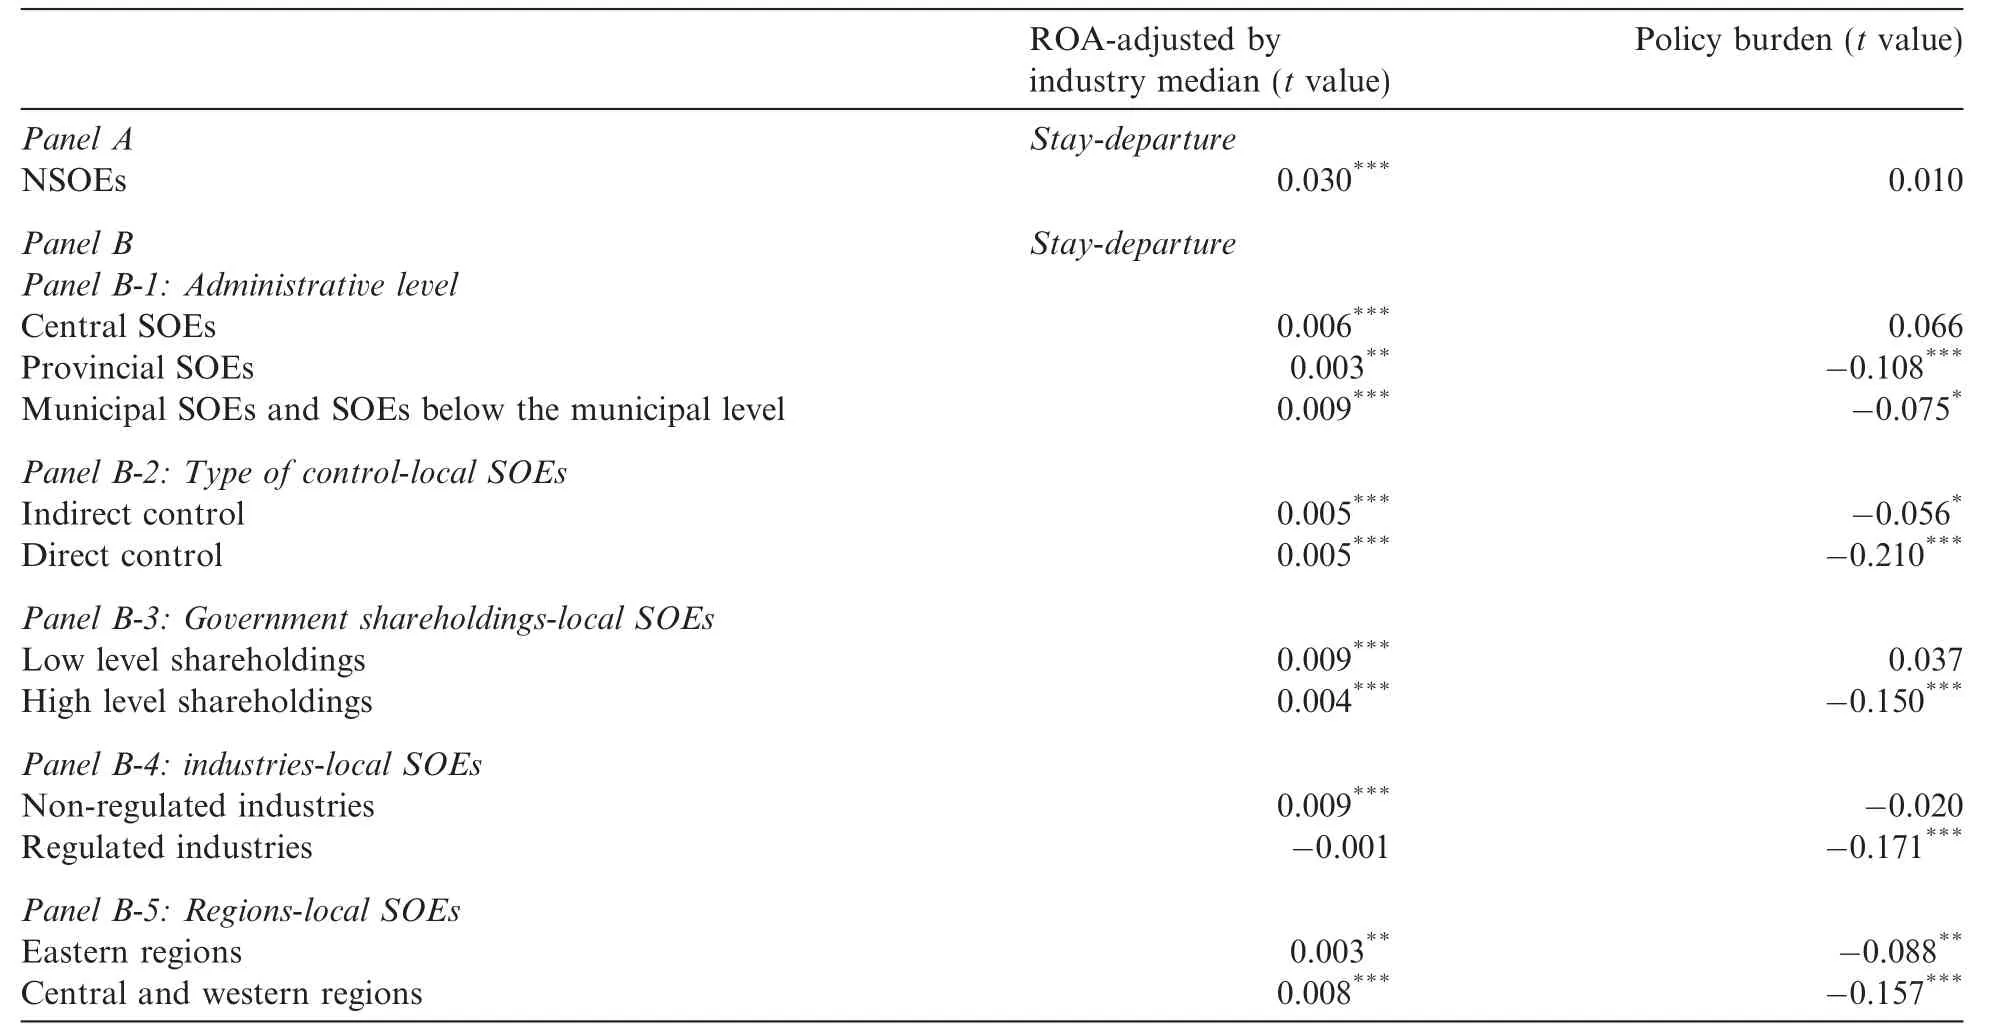
Table 7-1 Univariate tests of the differences in economic and political performance between executives who remain in office and those who leave office.

Table 7-2 The nature of the departure of SOE executives.
We also collect the nature of the SOE executives’departure to better understand the above findings.The results are shown in Table 7-2.Those demoted,transferred or promoted,account for 12.35%,17.31%and 38.04%of the total departures respectively,which indicates that about 52%of SOE executives leave without being demoted.Hence,we predict that the executives who leave office are those inclined to obtain promotion capital by bearing the policy burden in SOEs under strong government intervention.
In conclusion,on the whole,executives who remain in office perform better than those who leave office in terms of economic performance,while the opposite is the casein terms of political performance.Furthermore,these figures differ in relation to different levels of government intervention,with the evaluation of executives demonstrating structural differences among SOEs.Specifically,SOEs under weak government interventionprefer the market-oriented evaluation method,while the policy burden is more important when evaluating the executives of SOEs under strong intervention.Later,we control for other variables to further confirm our findings by regression.
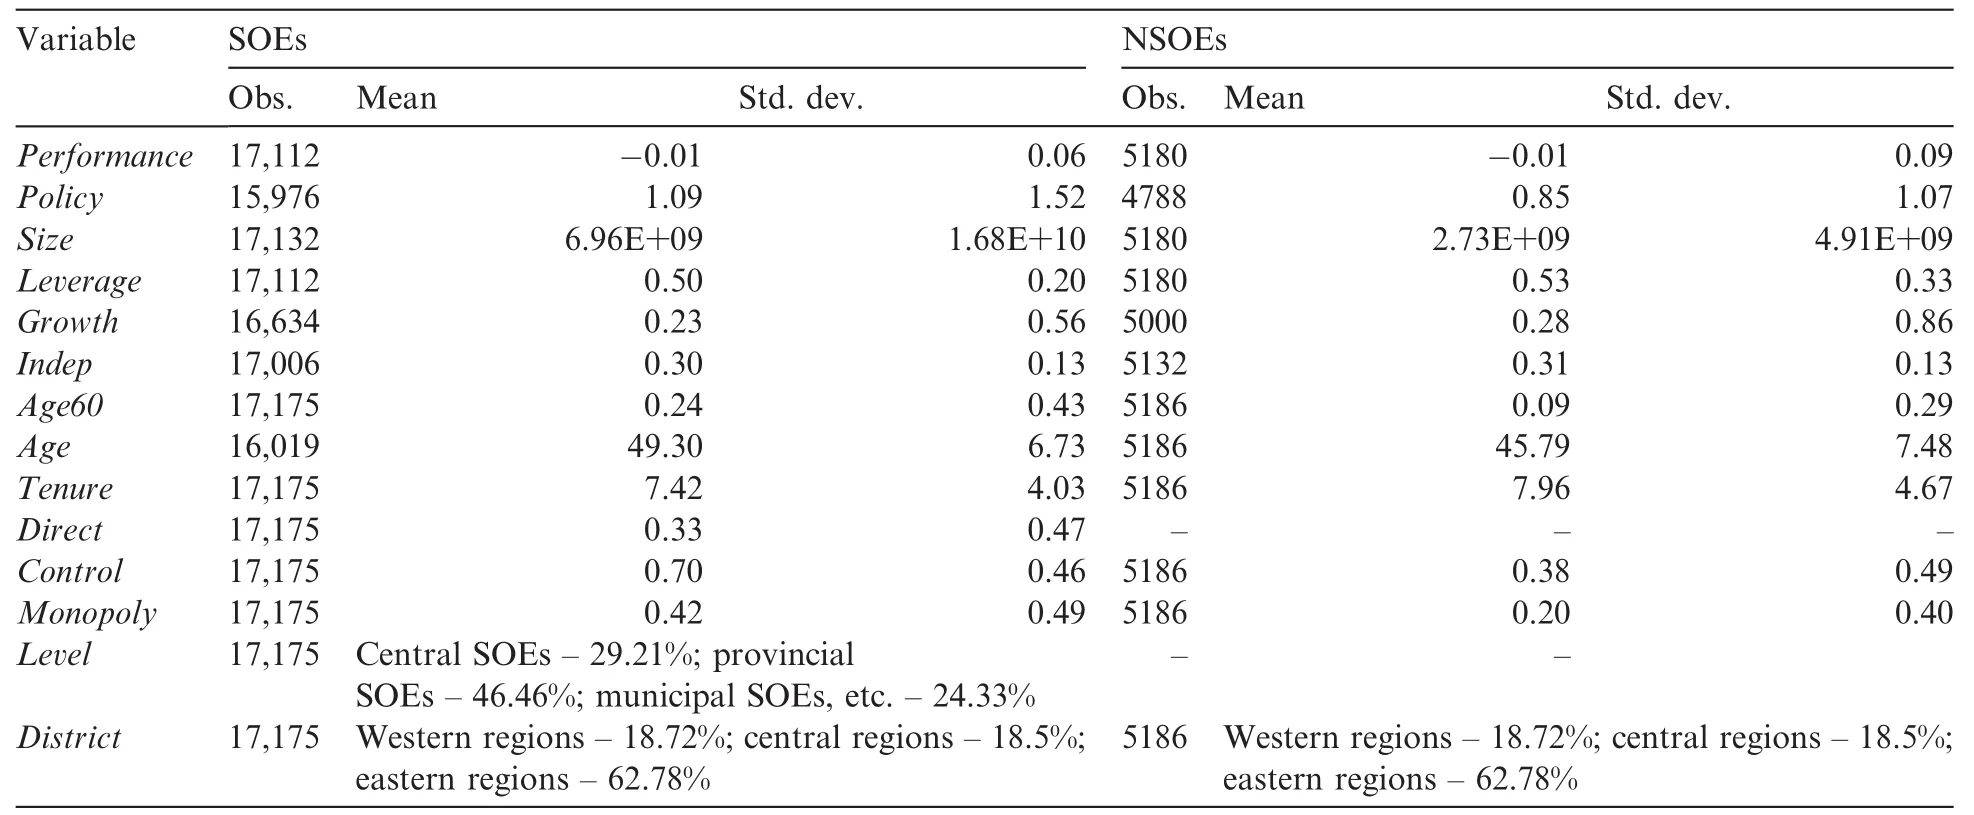
Table 8-1 Descriptive statistics.
4.3.Regression results
4.3.1.Descriptive statistics and correlations
Table8-1 shows the descriptive statistics of SOEs and NSOEs,in which NSOEs are the control group.With respect to firm characteristics,the average of Performance is 0.01 for both SOEs and NSOEs in our sample,but it seems that it is more variable in NSOEs,for which the SD is 0.09.SOEs clearly bear a greater policy burden(1.09)than NSOEs,as expected.The differences between the other financial variables for SOEs and NSOEs,such as Leverage,Growth and Indep are small,but the size of SOEs is much larger than NSOEs.With respect to personal characteristics,the average of Age60 is24%for executives from SOEs,which is higher than that for NSOEs.Similarly,the average of Age is49.3 for SOEs,higher than 45.79 for NSOEs.That is,on average,the executives of SOEs are older than those of NSOEs,which may be attributable to the personnel regulations for SOEs.As for Tenure,there is little difference between SOEs and NSOEs.Direct,Control,Monopoly,Level and District are proxies for government intervention.As Table 8-1 shows,about 33%of the SOEs in our sample are controlled directly,70%are controlled with high shareholdings,42%are from regulated industries and more than half are located in the Eastern regions.About one-third of SOEs are central SOEs,and nearly half are provincial SOEs.We also test the correlations between the coefficients,and the results suggest that multicollinearity should not be a concern.The correlation matrix is not shown here due to lack of space.The results are available from the authors on request.
4.3.2.Regression results
We compare SOEs with NSOEs and SOEs under strong government intervention with SOEs under weak intervention,to test the hypotheses in the second section,and the results are shown in Tables 8-2–8-4.
Table 8-2 shows the regression results for NSOEs and SOEs including central SOEs,provincial SOEs,municipal SOEs and SOEs below the municipal level.In column(1),Performance is significantly negative,which is consistent with the literature(Zhao et al.,2007;Jiang et al.,2014),and indicates that the executive turnover mechanism works effectively in Chinese NSOEs.Similar to column(1),Performance is significantly negative in column(2),but Policy is in significant,indicating that the executive turnover mechanism also works in SOEs.Moreover,dividing SOEs into central SOEs and local SOEs,we find that the coefficients ofPerformance and Policy are both insignificant,as shown in column(3).However,we cannot confirm that the evaluation mechanism for executives in central SOEs is invalid.The executive turnover in SOEs involves demotion,promotion and regular job transfer,which correspond to good and bad performance.Yang et al.(2013)and Liu and Xiao(2015)find that executives with good performance during their service term get promoted,and those with bad performance are demoted.As a dependent variable,Leave only includes two states,remaining in office and leaving office,with no further differentiation of executives’departure.
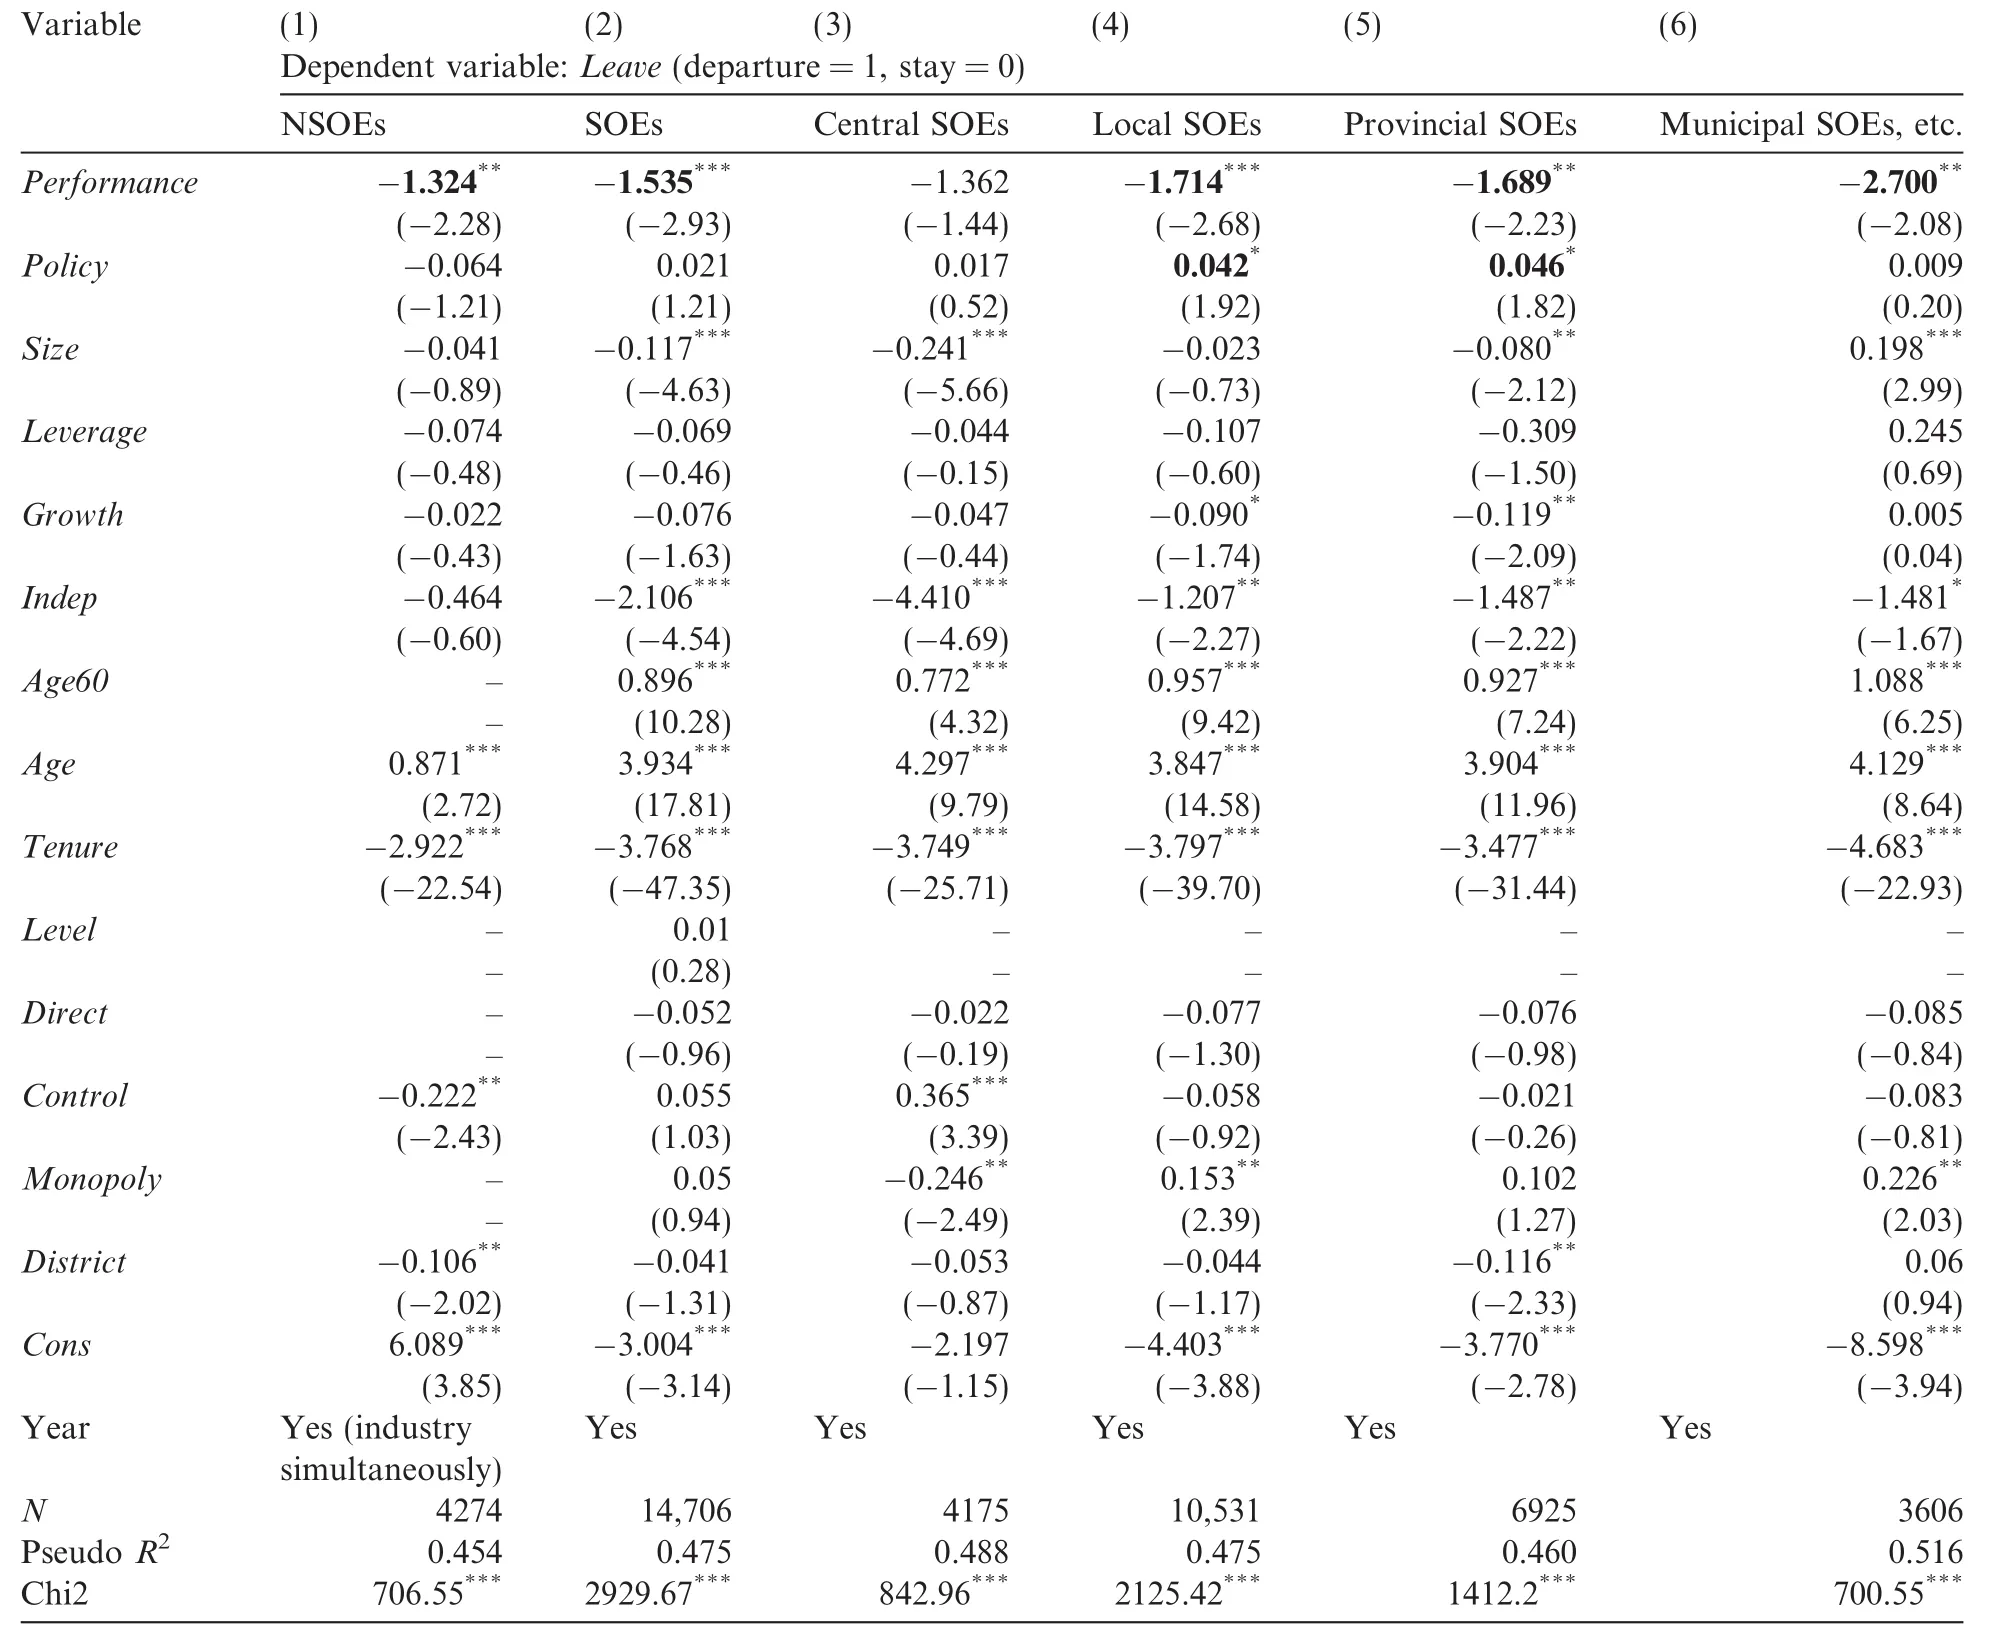
Table 8-2 Executive turnover,firm performance and policy burden:NSOEs vs SOEs.
In the future,we could further differentiate the departure types to confirm the features of executive appointment or dismissal in central SOEs.Hence,the regression results in column(3)are acceptable,and do not affect the conclusion of our paper.In column(4),the coefficient of Performance is-1.714 and that of Policy is0.042,and both are statistically significant,indicating that executive turnover in local SOEs is driven by economic and political performance,especially in provincial SOEs.Different from the results in column(1),in column(6),Performance is-2.7 and significantly negative,and Policy is0.009 but insignificant.Whether the executive turnover in municipal SOEs and SOEs below the municipal level is driven by economic performance or by thepolicy burden at the expense of firm performance needs to be examined in relation to different types of executive turnover.Combining the above figures with the incomplete statistics for the nature of executive departure in Table 7-2,we can conclude that in local SOEs with strong intervention relative to central SOEs,executives have a motivation to partially sacrifice economic performance to achieve promotion capital by bearing political tasks such as policy burden,thus indicating some of the bureaucratic features of the executive appointment and dismissal mechanism.

Table 8-3 Executive turnover,firm performance and policy burden:Different Types of Control.
Next,to further test our hypotheses,we group local SOEs into several groups by type of control and shareholdings,industries and regions.We then conduct regressions.The regression results are shown in Tables 8-3 and 8-4.Here,columns(6),(8),(10)and(12)correspond to SOEs under weak government intervention,in which the coefficient of Performance is significantly negative and that of Policy is insignificant.That is,local SOEs indirectly controlled or owned with low holdings by government,or local SOEs located in the Eastern regions,prefer a market-dominated evaluation method based on executives’economic performance.In columns(7),(9),(11)and(13),which correspond to SOEs under strong government intervention,the coefficient of Policy is significantly positive and that for Performance is negative with little significance.The results implythat local SOEs directly controlled or owned with high holdings by the government,and local SOEs located in the Central and Western regions,prefer a bureaucratic evaluation method based on executives’political performance.We also test the differences between the coefficients of Performance and Policy according to the groups in Tables 8-3 and 8-4.The results show that the sensitivity of turnover-performance(Performance)is not significantly different between the groups,but the coefficients of Policy differ significantly between the groups.8We conduct coefficient differencetests of Performance and Policy among the different groups based on Tables8-2–8-5(sensitivity test).In Table 8-2,the results indicate that the coefficient difference of Policy is statistically significant at the 10%level between NSOEs and SOEs,while it is partially significant among central SOEs and local SOEs,provincial SOEs,municipal SOEs and SOEs below the municipal level.In Tables 8-3 and 8-4,the coefficient difference of Policy is statistically significant at the 5%level between SOEs with indirect holdings and SOEs with direct holdings,and between SOEs located in the Eastern regions and SOEs in the Central and Western regions.In Table 8-5,the coefficient difference of Policy is statistically significant at the 10%level between SOEs under weak government intervention and SOEs under strong government intervention.
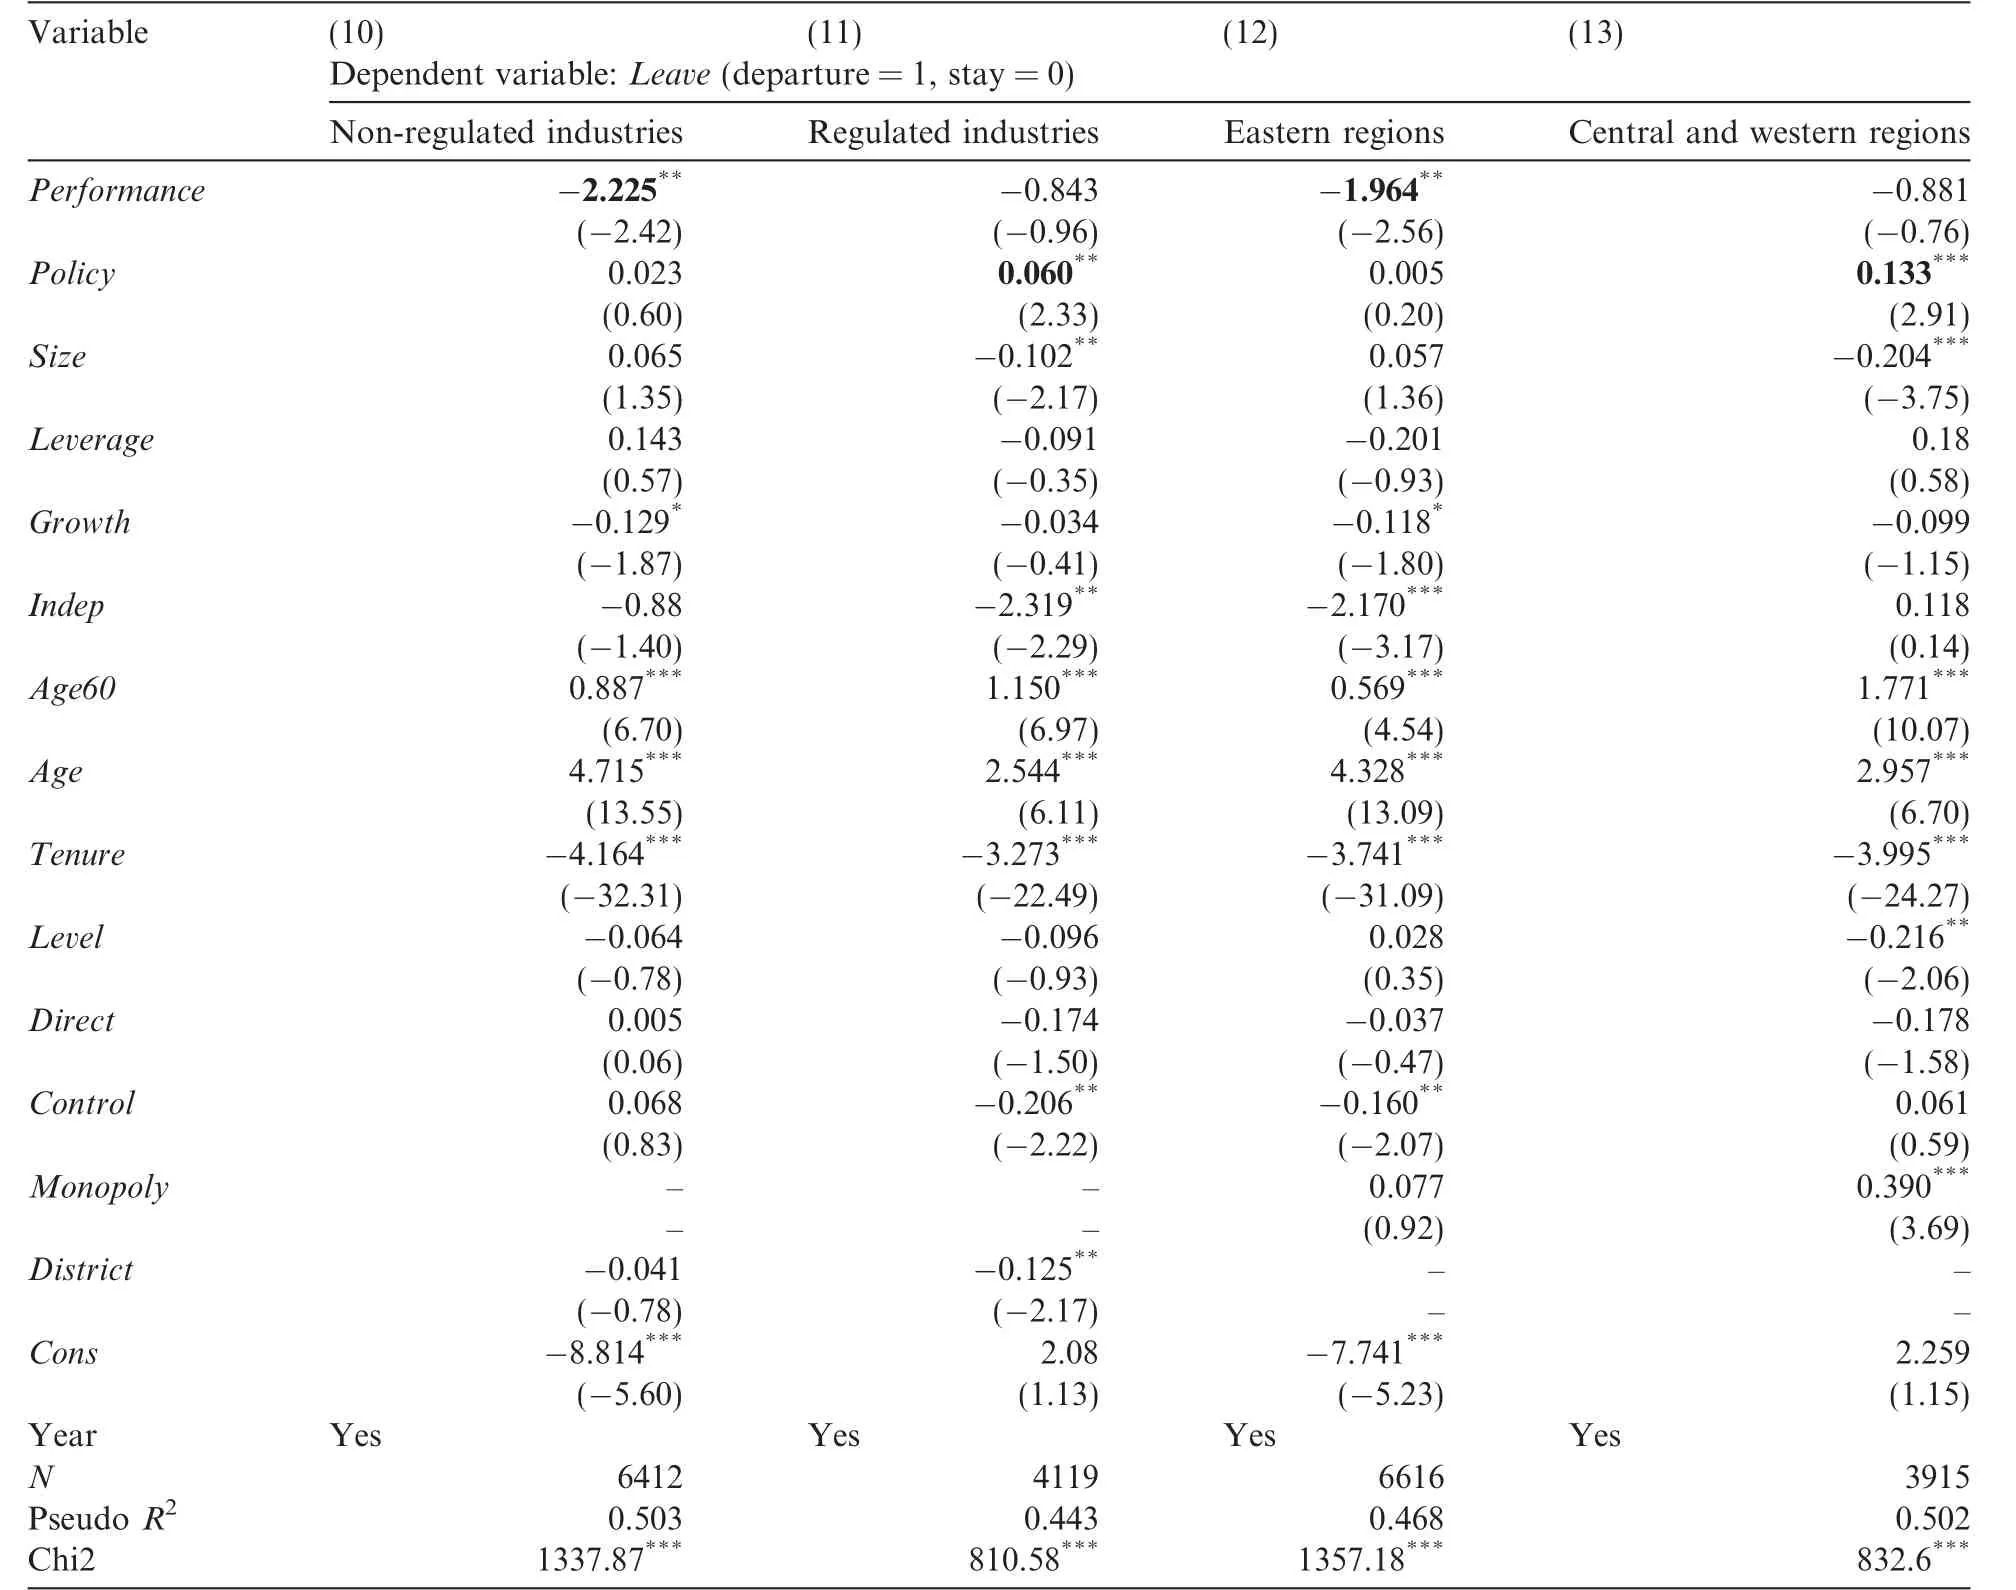
Table 8-4 Executive turnover,firm performance and policy burden:Different Industries/Regions.
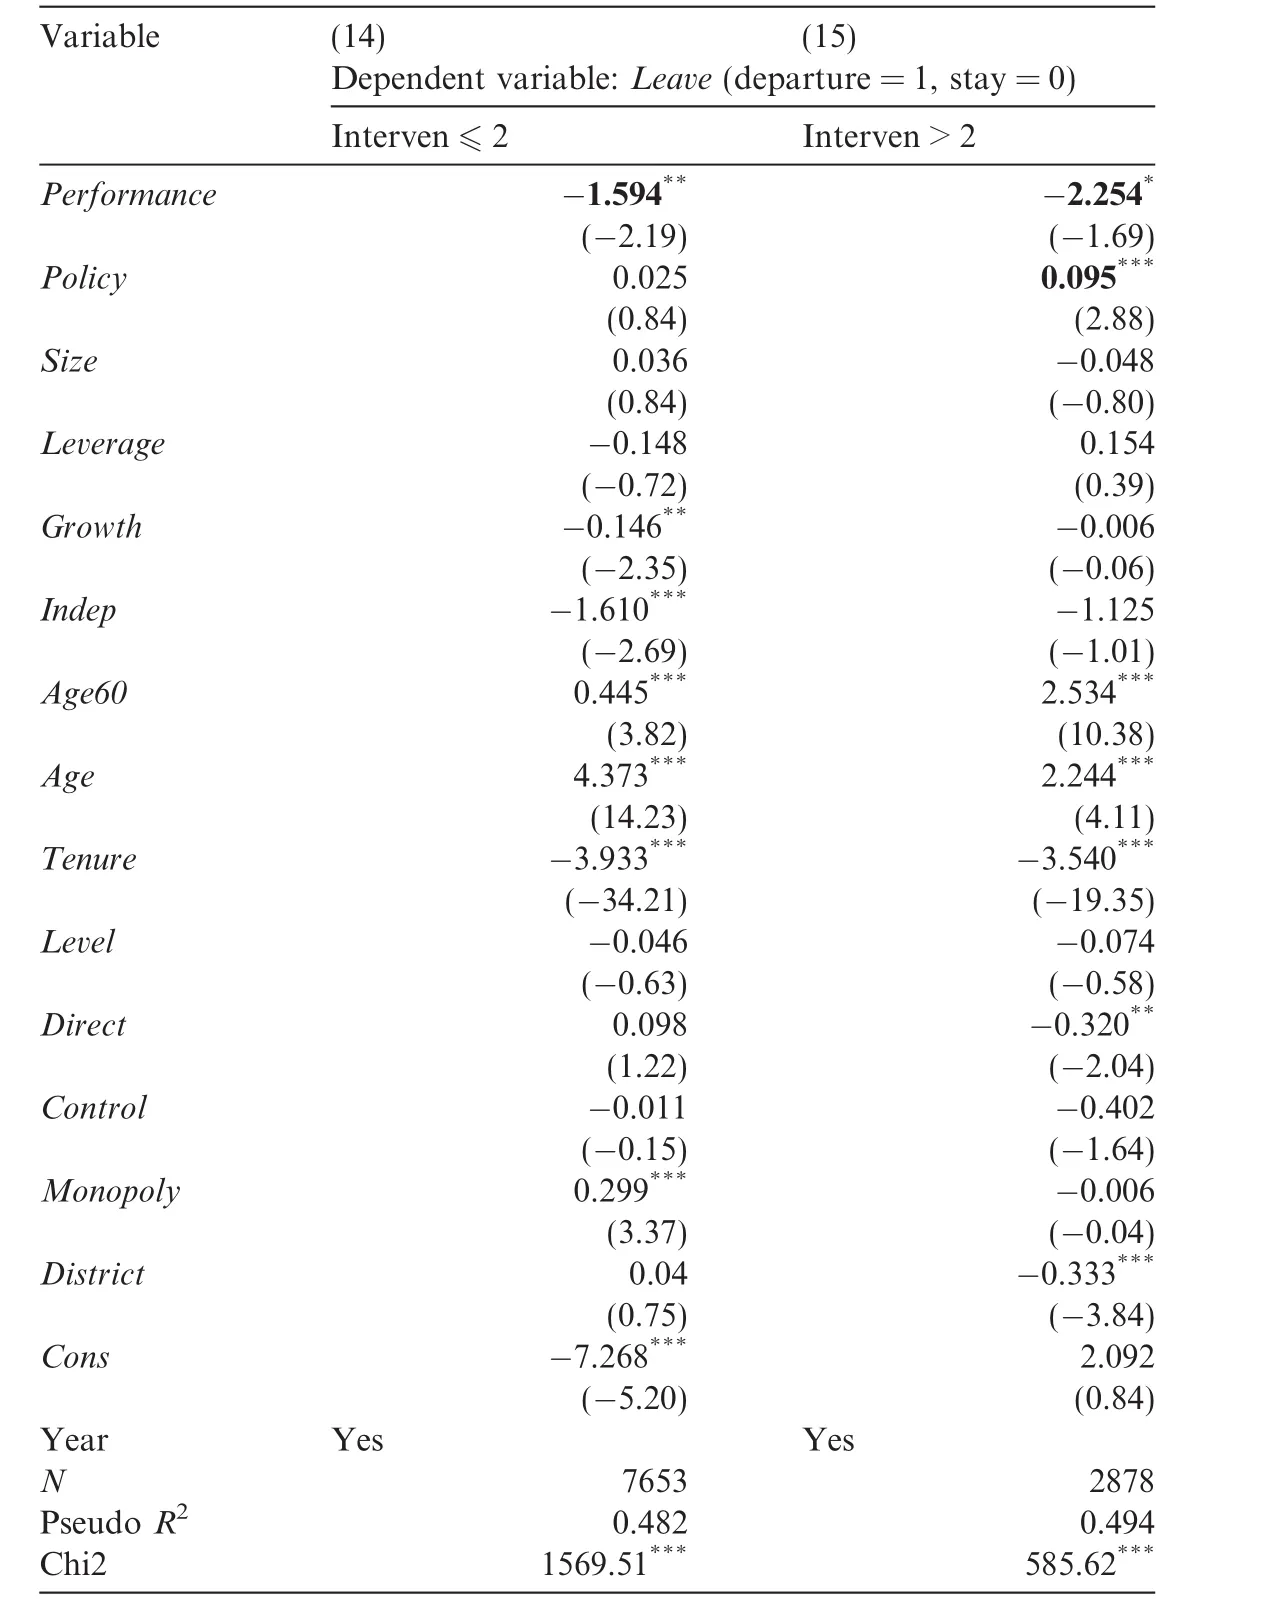
Table 8-5 Sensitivity test.
4.3.3.Sensitivity test
We examine the different implementations of the executive evaluation mechanism in SOEs under different levels of government intervention distinguished by the administrative level,type of control,shareholdings by SASACs,industries and districts.Although the above classifications are intrinsically consistent(Xia and Chen,2007;Xin and Tan,2009;Fan et al.,2013),there may be large deviations among the subsamples,such as SOEs located in Eastern regions,which include those under different types of government control,and levels of shareholdings and from different industries,which may lead to endogenous interference to the results when regressing by groups.To reduce the measurement errors caused by a single packet,we design a comprehensive variable Interven,where Interven=Direct+Control Dummy+Monopoly+District.Here,Interven is an ordinal variable ranging from 0 to 4.The median of Interven is 2,and we take a result as representing the weak government intervention group if Interven is no more than the median,and the strong intervention group if it is above the median.The regression results are shown in Table 8-5.In column(14),the coefficient of Performance is significantly negative,whereas Policy is insignificant,which implies an inclination toward market-dominated evaluations among SOEs in the weak intervention group.In column(15),the coefficient of Performance is slightly significant,and Policy is significantly positive,which implies an inclination toward bureaucratic evaluation among SOEs in the strong intervention group,that is,‘‘weak performance and strong policy burden.”Our results are consistent with previous evidence.
5.Conclusion
According to the theoretical framework of institutional economics,institutional arrangements determine the level of participation.Executives,especially the Chairman and CEO,influence the operational performance and market value of firms to a large extent.Incentive mechanisms concerning executive turnover can influence the behavior of executives,which affects firm value.As a result,it is necessary to examine the institutional changes and executive turnover of SOEs to better understand the behavior of SOEs and explain their performance.
In this paper,we collect the executive turnover data of Chinese listed SOEs from 1999 to 2012.Based on the current regulations,we find that about half of executives leave office within two terms,which is in line with the‘‘Interim Provisions on Business Performance Evaluations for Persons-in-Charge at Central Enterprises”(2003,2006,2009,2012).However,more than a third of executives leave office in less than one term,and about 20%of executives serve more than two terms,which highlights the uncertainty and unpredictability of executive appointments in SOEs.Second,the executive evaluation mechanism for SOEs is implemented differently according to the different levels of government intervention.The executive turnover in SOEs with weak intervention by local governments,such as those controlled indirectly or with low government shareholdings and those from non-regulated industries and the Eastern regions,tends to be market-oriented and determined by economic performance.In contrast,the SOEs under strong government intervention prefer to conduct government-oriented executive evaluations that focus on political performance in relation to different policy burdens.
Our findings are of theoretical and practical importance.Weare the first to empirically examine the implementation of multi-task incentive contracts under different government intervention scenarios.Our evidence on executive turnover in Chinese SOEs supplements the literature.Moreover,our findings have implications for policy-makers,as they add to the knowledge of corporate governance in Chinese SOEs,deepen our understanding of the economic and political behavior of SOE executives and suggest that the authorities should optimize the existing institutions.
It is imperative to reform the bureaucratic selection mechanism of SOE executives,along with the mixed ownership trial of SOEs,and practice the classified management of SOEs.The authorities need to break the current uniformity of policy implementation by reallocating governance power between SOEs and governments according to the different types and levels of control,and using different methods to select executives,such as bureaucratic selection or market recruitment.On this basis,the SASACs could further popularize explicit incentive contracts in SOEs in competitive industries by clearly defining the rights and duties of SOE executives,enabling the professionalization of SOE executives,and thus furnishing a solid platform for the market-dominated selection and evaluation of SOE executives.
Acknowledgments
The authors thank the executive editor and anonymous referees for their helpful suggestions.
Appendix A
See Table 2.

Table 2 The transition of the incentive mechanism of SOE executive appointment and dismissal.
Alchian,A.A.,Demsetz,H.,1972.Production,information costs,and economic organization.Am.Econ.Rev.62,386–388.
Bai,C.E.,Tao,Z.,2006.The multitask theory of state enterprise reform:empirical evidence from China.Am.Econ.Rev.96,353–357.
Bai,J.,Lian,L.S.,2014.Why do state-owned enterprises over-invest?Government intervention or managerial entrenchment.Acc.Res.2(1),41–48,49(in Chinese).
Cao,Y.,Qian,Y.,Weingast,B.R.,1999.From federalism,Chinese style to privatization,Chinese style.Econ.Transit.7,103–131.
Chang,E.C.,Wong,S.M.L.,2009.Governance with multiple objectives:evidence from top executive turnover in China.J.Corp.Finance 15,230–244.
Chen,D.H.et al.,2010.How marketization affects incentive contracting costs and choices:perks or monetary compensations?Acc.Res.11,56–64,97(in Chinese).
Coughlan,A.T.,Schmidt,R.M.,1985.Executive compensation,management turnover,and firm performance:an empirical investigation.J.Acc.Econ.17,43–66.
Dedman,E.,2002.Executive turnover in UK firms:the impact of Cadbury.Acc.Bus.Res.33,33–50.
Defond,M.L.,Hung,M.,2004.Investor protection and corporate governance:evidence from worldwide CEO turnover.J.Acc.Res.42,269–312.
Ding,Y.G.,Song,X.Z.,2011.Government control,executive turnover and firm’s performance.Acc.Res.6,70–76,96(in Chinese).
Fan,J.P.H.,Wong,T.J.,Zhang,T.,2013.Institutions and organizational structure:the case of state-owned corporate pyramids.J.Law Econ.Organ.29,1217–1252.
Fan,G.et al.,2003.Marketization index for China’s provinces.Econ.Res.J.3,9–18(in Chinese).
Firth,M.,Fung,P.M.Y.,Rui,O.M.,2006.Corporate performance and CEO compensation in China.J.Corp.Finance 12,693–714.
Hart,S.J.G.A.,1983.An analysis of the principal-agent problem.Econometrica:J.Econ.Soc.51,7–45.
Holmstrom,B.,Milgrom,P.,1991.Multitask principal–agent analyses:incentive contracts,asset ownership,and job design.J.Law Econ.Organ.7,24–52.
Huang,Z.S.,2003.Dual absence of implicit incentive mechanism in state-owned enterprises.Mod.Econ.Sci.5(25),45–49(in Chinese).
Huang,Z.S.,2004.Thelatest development of the incentive theory of enterprises for Western countries.For.Econ.Manage.1(26),28–31(in Chinese).
Jiang,F.X.et al.,2014.Does incentive contracts for executives of state-owned enterprise spay less attention to firm performance?Manage.World 9,143–159(in Chinese).
Jensen,M.C.,Meckling,W.H.,1976.Theory of the firm:managerial behavior,agency costs,and ownership structure.J.Financ.Econ.3,305–360.
Kato,T.,Long,C.,2006a.Executive turnover and firm performance in China.Am.Econ.Rev.96,363–367.
Kato,T.,Long,C.,2006b.CEO turnover,firm performance,and enterprise reform in China:evidence from micro data.J.Comp.Econ.34,796–817.
Laux,V.,2008.Board independence and CEO turnover.J.Acc.Res.46,137–171.
Liao,G.,Chen,X.,Jing,X.,Sun,J.,2009.Policy burdens,firm performance,and management turnover.Chin.Econ.Rev.20,15–28.
Liao,G.M.,Zhang,G.T.,2012.Earnings management and the efficiency of executive promotion in SOEs.Chin.Ind.Econ.4,115–127(in Chinese).
Liao,L.et al.,2009.Operating risk,promotion incentive and corporate performance.Chin.Ind.Econ.8,119–130(in Chinese).
Lin,J.Y.,Li,Z.,1998.Competition,policy burdens,and state-owned enterprise reform.Am.Econ.Rev.88,422–427.
Lin,Y.F.,Li,Z.,1997.The connotation of the modern enterprise system and the direction of state-owned enterprises reform.Econ.Res.J.3,3–10(in Chinese).
Lin,Y.F.,Li,Z.Y.,2004.Policy burden,moral hazard and soft budget constraint.Econ.Res.J.2,17–27(in Chinese).
Liu,Q.S.,Xiao,X.,2015.Are demotion and promotion both due to performance?An empirical research on top executive turnover in SOEs.Manage.World,151–163(in Chinese).
Neumann,R.,Voetmann,T.,2005.Top executive turnovers:separating decision and control rights.Manag.Decis.Econ.26,25–37.
Qian,Y.,Roland,G.,1998.Federalism and the soft budget constraint.Am.Econ.Rev.88,1143–1162.
Song,D.S.,Song,P.M.,2005.Song holding,turnover of uppermost decision-maker and firm performance.Nankai Bus.Rev.1(8),10–15(in Chinese).
Wang,J.,2001.The incentives and behavior in dual games.Econ.Res.J.8,71–78(in Chinese).
Warner,J.B.,Watts,R.L.,Wruck,K.H.,1988.Stock prices and top management changes.J.Financ.Econ.20,461–492.
Xia,L.J.,Chen,X.Y.,2007.Marketization,SOE reform strategy,and endogenously determined corporate governance structure.Econ.Res.J.7,82–96(in Chinese).
Xin,Q.Q.,Tan,W.Q.,2009.Market-oriented reform firm performance and executive compensation in Chinese state-owned enterprises.Econ.Res.J.11,68–81(in Chinese).
Yang,R.L.et al.,2013.The political promotion for quasi-government officers:evidence from central state-owned enterprises in China.Manage.World 3,23–33(in Chinese).
Zhang,L.L.et al.,2015.Regulatory independence,market-oriented process and the implementation of executives’promotion mechanism in SOEs based on the SOE executives turnover data from 2003 to 2012.Manage.World 10,117–131(in Chinese).
Zhao,Z.Y.et al.,2007.Empirical study on the factors influencing executive turnover of Chinese listed companies.J.Financ.Res.8,76–89(in Chinese).
Zhou,L.A.,2007.Governing China’s local officials:an analysis of promotion tournament model.Econ.Res.J.7,36–50(in Chinese).
 China Journal of Accounting Research2018年2期
- China Journal of Accounting Research的其它文章
- Religious atmosphere and the cost of equity capital:Evidence from China
- Does independent directors’monitoring affect reputation?Evidence from the stock and labor markets☆
- Can material asset reorganizations affect acquirers’debt financing costs?–Evidence from the Chinese Merger and Acquisition Market☆
