
Relationship between the haplotype distribution of Artemisia halodendron (Asteraceae) and hydrothermal regions in Horqin Sandy Land, northern China
2018-05-09 07:36:37WenDaHuangXueYongZhaoYuLinLiYuQiangLiYaYongLuo
WenDa Huang , XueYong Zhao , YuLin Li , YuQiang Li , YaYong Luo
1. Naiman Desertification Research Station, Northwest Institute of Eco-Environment and Resources, Chinese Academy of Sciences, Lanzhou, Gansu 730000, China
2. Key Laboratory of Stress Physiology and Ecology in Cold and Arid Regions, Northwest Institute of Eco-Environment and Resources, Chinese Academy of Sciences, Lanzhou, Gansu 730000, China
3. Urat Desert-grassland Research Station, Northwest Institute of Eco-Environment and Resources, Chinese Academy of Sciences, Lanzhou, Gansu 730000, China
1 Introduction
Artemisia halodendronTurcz. ex Bess. (Asteraceae, Anthemideae, Subgen.Dracunculus) is one of the most common semishrub species in the Horqin Sandy Land in Northeast China. It is important for vegetation rehabilitation in Horqin Sandy Land because of its high ecological value, including that (1) it is the key species of the plant communities and landscapes studies in Horqin Sandy Land (Li, 1991); (2) it plays a key role in the vegetation-restoration process due to its high drought tolerance, anti-wind erosion properties, and sand-burial resistance (Donget al., 2000; Liet al., 2002; Zhaoet al., 2006). Previous studies onA.halodendronfocused on aspects of population-distribution patterns (Chaoet al., 1999; Caoet al., 2008),biomass allocation (Liet al., 2005), breeding distribution (Liet al., 2005), morphological characteristics and physiological adaptations (Zhouet al., 1999), root longevity (Huanget al., 2009), genetic diversity(Huanget al., 2011, 2014), and establishment (Liet al., 2002) in Horqin Sandy Land. However, systemat-ic comparison of genetic relationships ofA. halodendronamong populations from different hydrothermal regions has not yet been reported.
Horqin Sandy Land is located in the agropastoral transitional zone between the Inner Mongolian Plateau and the Northeast Plains (42°41′N–45°45′N,118°35′E–123°30′E) and is one of the four largest sandy areas in northern China; it covers an area of approximately 139,300 km2, of which up to 71,884 km2is desertified sandy land (Wang, 2003; Zhaoet al.,2003). Landscape in this area is characterized by sand dunes that alternate with gently undulating lowland areas (Liet al., 2005). This area belongs to the continental semi-arid monsoon climate and is in the temperate zone, with a mean annual temperature (AMT) of 3–7 °C and mean annual rainfall (AP) of 350–500 mm(Zhaoet al., 2003). Over recent decades, this region has undergone severe desertification (Liet al., 2000,2004) and has displayed the northern-moving phenomenon of the interlocked agropasturing area of North China in the most recent hundred years (Zhaoet al., 2000, 2002).
In the present study, we used chloroplast DNA(cpDNA)trnL–F to examine the genetic diversity ofA. halodendron. We specifically aimed to address the following questions: (1) What is the level of nucleotide diversity inA. halodendronfrom different hydrothermal regions? (2) How are the identified haplotypes distributed within and among populations? In particular, is there subdivision in the different hydrothermal-level populations (according to hydrothermal synthesis index)? We attempted to interpret the results to provide baseline genetic information pertinent to the restoration and management of degraded ecosystems in arid and semi-arid areas.
2 Materials and methods
2.1 Sampling


Table 1 The average monthly rainfall in 10 years of 10 populations of Artermisia halodendron in Horqin Sandy Land
2.2 Molecular methods
Total genomic DNA was extracted using AxyPrep Genomic DNA Mini Kits (Axygen Inc., Beijing,China) following the manufacturer's instructions.DNA quality was checked on a 1.0% agarose gel.Several pairs of cpDNA primers designed by Hamilton (1999), Taberletet al. (1991), and Sanget al. (1997) were used in the initial screening. Two pairs of primers,trnL (5'-CGGAATTGGTAGACGCTACG-3') andtrnF (5'-ATTTGAACTGGTGACACGAG-3') (Sanget al., 1997), identified sequence variations in the sampled individuals and therefore were used for all remaining individuals. Polymerase chain reaction (PCR) was performed in a 25-μL reaction volume, containing 40 ng of genomic DNA, 1.0 U of Taq polymerase (Axygen Inc., Beijing, China),3 mmol/L MgCl2, 500 μmol/L each dNTP, 20 mmol/L Tris-HCl (pH 8.3), 100 mmol/L KCl, and 0.3 μmol/L primer. The amplification condition was an initial denaturation step at 94 °C for 3 min, followed by 30 cycles of 30 s at 94 °C, 30 s at 55 °C, 1 min at 72 °C,and a final 5-min extension step at 72 °C. The PCR products were determined by 1.0% agarose gel electrophoresis. The amplification products were purified using an AxyPrep PCR Purification Kit, following the manufacturer's protocol (Axygen Inc., Beijing,China). Purified DNA was sequenced by the MEIJI sequencing company in Shanghai, China, applying the PCR-primers as sequencing primers.
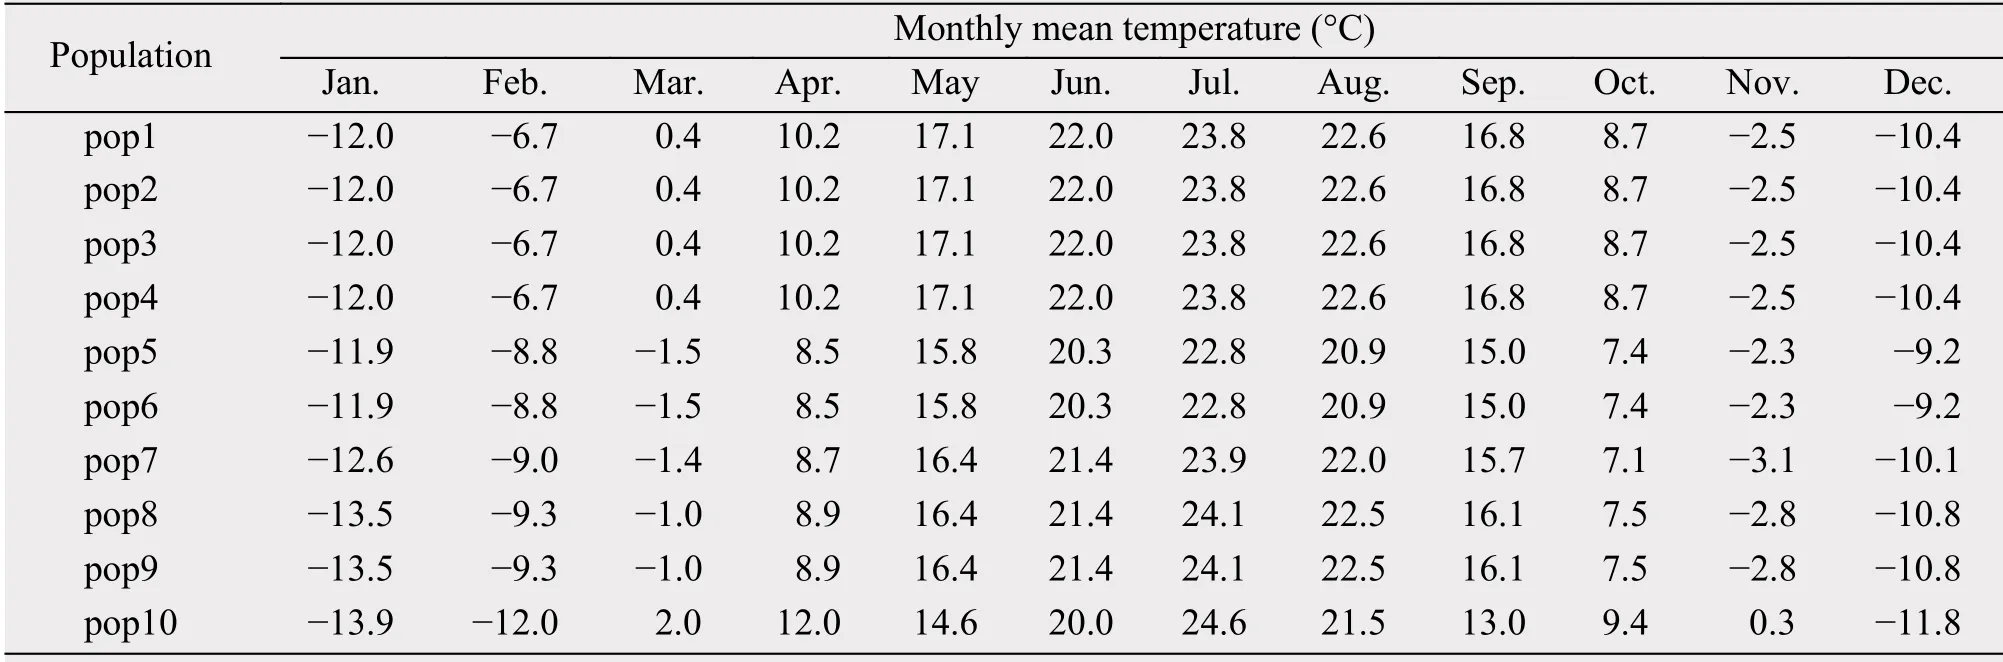
Table 2 The monthly mean temperature in 10 years of 10 populations for Artermisia halodendron in Horqin Sandy Land
2.3 Data analyses
DNA sequences were aligned using the CLUSTAL X program (Thompsonet al., 1997), with subsequent manual adjustments in MEGA4 (Tamuraet al., 2007). A matrix of combined sequences was constructed for the 243 individuals that we examined,and different cpDNA sequences were identified as haplotypes.
Basic population genetic parameters were estimated for three groups of populations: the low-hydrothermal-level region (populations 1–6); the high-hydrothermal-level region (populations 7–10); and finally, all populations. All parameters were calculated with DNASP 5.10.01 (Librado and Rozas, 2009), including the number of segregating sites (S), the number of haplotypes (Nh), the haplotype diversity (Hd),the average number of nucleotide differences per site between two sequences in a sample, π (Nei and Li,1979; Nei, 1987), and the average number of pairwise nucleotide differences (k).
Phylogenetic analyses of cpDNA haplotypes were performed with maximum parsimony (MP), using PAUP version 4.0 (Swofford, 2002). Heuristic search was implemented with 100 random additional sequence replicates, tree-bisection-reconnection (TBR)branch swapping, MULPARS option, and ACCTRAN optimization. To evaluate the relative robustness of the clades found in the most parsimonious tree, bootstrap analysis was conducted using 1,000 replicates with a simple taxon addition. Genetic differentiation among populations at the three different sampling levels was estimated by pairwiseFSTvalues (Wright,1951). AMOVA was performed to analyze the source of variation among populations, using Arlequin 3.0 (Excoffieret al., 2005) with 1,000 replicates of bootstrap.
3 Results
3.1 Haplotype distribution and genetic diversity
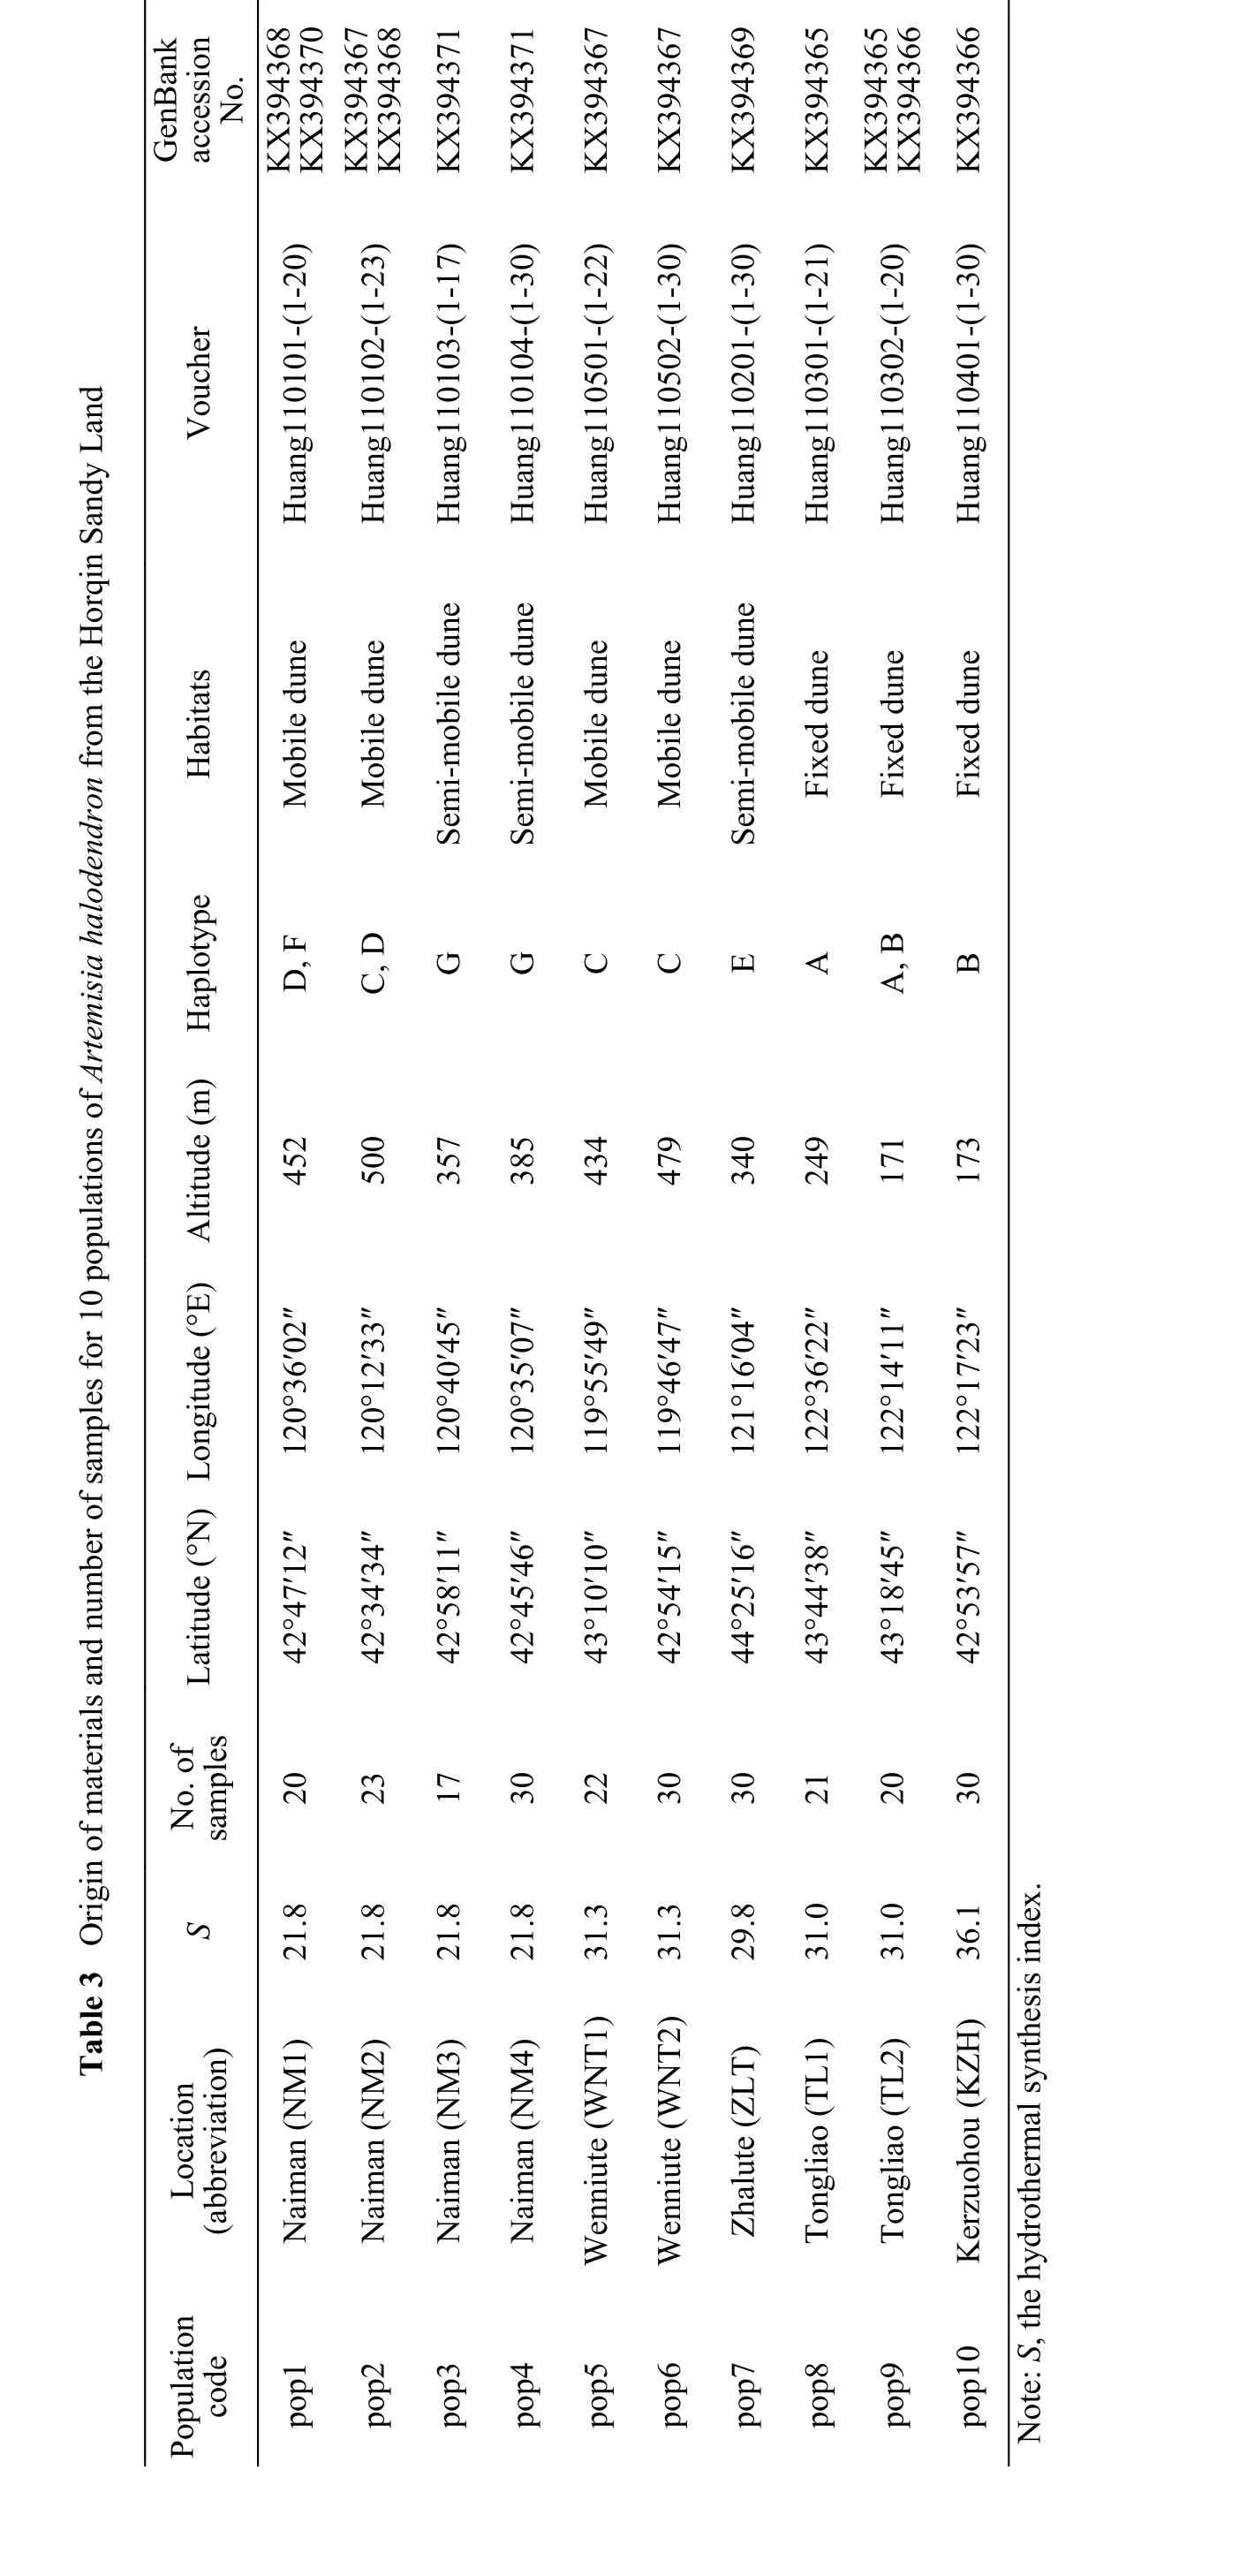
Sequence data were obtained for one loci from on average 101, 142, and 243 individuals from the low-hydrothermal-level region, the high-hydrothermal-level region, and the entire species' range, respectively. The length of the alignedtrnL–trnF DNA sequences (includingtrnL and thetrnF spacer region)ranged between 849 and 863 bp with two insertions.The analysis of cpDNA variation identified seven haplotypes (HapA-HapG) (Table 4). Haplotype C was the most abundant, occurring in three populations, followed by haplotypes A, B, D, and G, which occurred in two populations; and the remaining haplotypes were found in only a single population (Table 3 and Figure 1). We confirmed the division of the native range into two areas using hydrothermal synthesis index data (Table 3). Six populations in the low-hydrothermal-level region of the species were dominated by four different haplotypes. The other four populations in the high-hydrothermal-level region of the species were dominated by three different haplotypes (Table 3 and Figure 1).
?
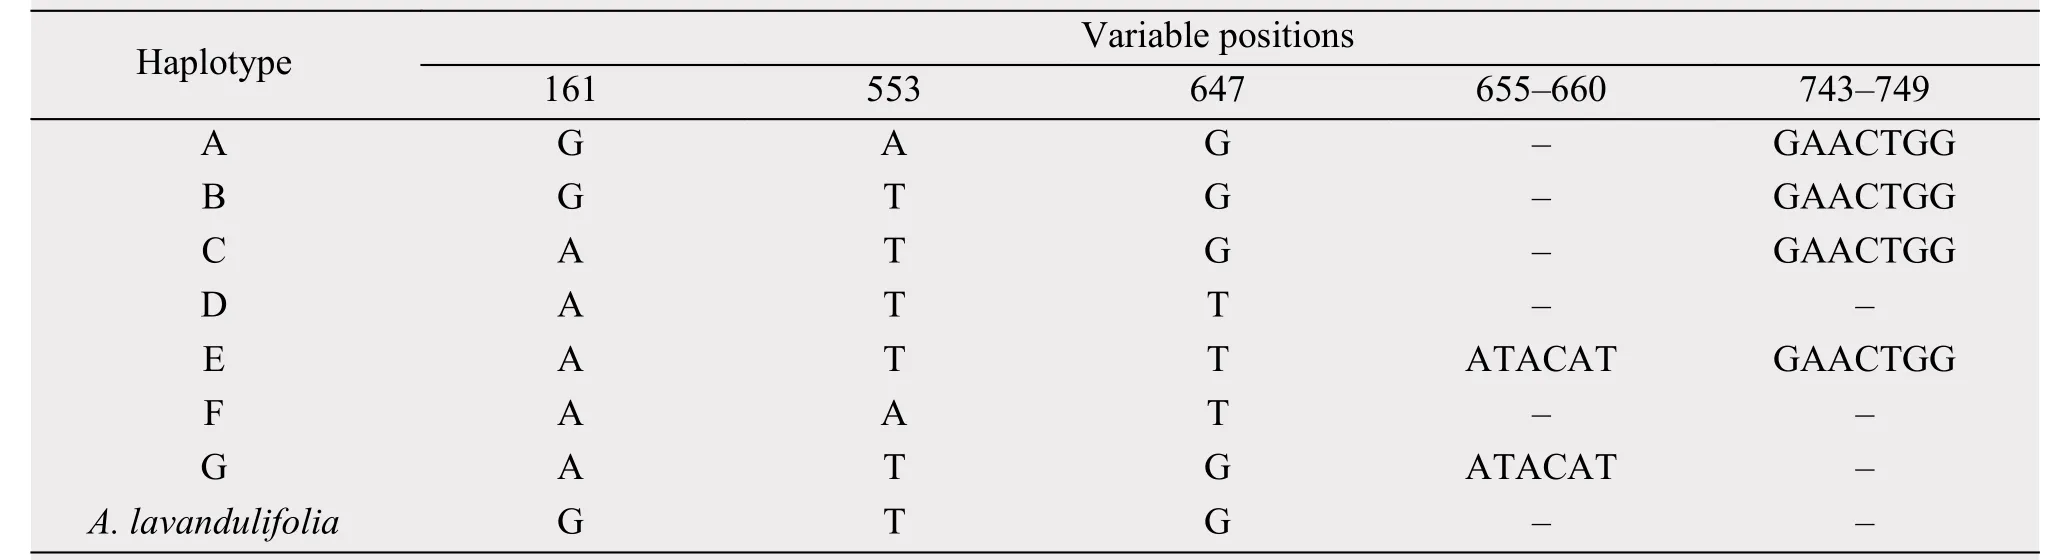
Table 4 Variable sites of the aligned sequences of trnL-F in seven haplotypes of Artemisia halodendron in the Horqin Sandy Land
Notes: Sequences are numbered from the 5' to the 3' end in each region; – indicates lack.

Figure 1 Geographic distribution of the seven haplotypes found on 243 individuals for trnL–F observed in Artemisia halodendron of the Horqin Sandy Land. Pie charts indicate the frequency of haplotypes within each population, and unique alleles are indicated by different colours.NDRS indicates Naiman Desertification Research Station, China Academy of Sciences. Base map data produced in 2000
We identified a total of two, three, and three segregating sites for the low-hydrothermal-level region, the high-hydrothermal-level region, and all populations,respectively. Summary statistics of sequence variationare given in Table 5. Overall haplotype diversity (Hd)and nucleotide sequence (π) diversity forA. halodendronwere 0.706±0.001 and 0.0013±0.0001, respectively. At the regional level, haplotype diversity and nucleotide diversity between two regions varied between 0.318 (low-hydrothermal-level region) and 0.671 (high-hydrothermal-level region), and between 0.0006 (low-hydrothermal-level region) and 0.0015(high-hydrothermal-level region), respectively. The population from the high-hydrothermal-level region had higher haplotype diversity and nucleotide diversity than the population from the low-hydrothermal-level region.
3.2 Phylogenetic analyses and genetic structure
Maximum parsimony analysis resulted in a single tree (length=14 and consistency index =0.5834). Two clades with low bootstrap support were identified: one consisting of the Hap C, G, F, E, and D, with four haplotypes (Hap C, G, F, and Hap D) distributed in the low-hydrothermal-level region and one haplotype(Hap E) in the high-hydrothermal-level region; and the other consisting of the rest of Hap A and Hap B,both occurring in the high-hydrothermal-level region(Figure 2).
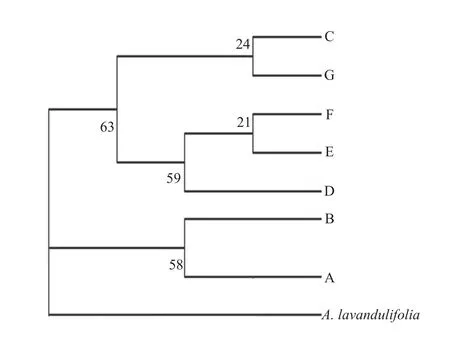
Figure 2 Phylogenetic relationships of the identified haplotypes of Artemisia halodendron in Horqin Sandy Land
The analysis of molecular variance (AMOVA)showed that around 17.54% of the variation was attributed to the low-/high-hydrothermal-level regions differentiation, and between- populations variation accounted for just over one-half (55%) of the total variation, indicating very strong differentiation and little gene flow between regions and populations (Table 6).Within the low- and high-hydrothermal-level regions,between-populations differentiation was respectively 81.52% and 93.77% (Table 6). Overall, these results strongly indicate that haplotypes are geographically structured across the species' distribution range.FSTvalues were 0.728, 0.815, and 0.938 at the species level, low-hydrothermal-level region, and high-hydrothermal-level region, respectively.

Table 5 Nucleotide variation and haplotype diversity at trnL-F in 10 populations of Artemisia halodendron from the low-hydrothermal-level region (populations 1–6), high-hydrothermal-level region (populations 7–10),and entire species' range (all populations) in the Horqin Sandy Land

Table 6 Results of analyses of molecular variance (AMOVAs) of haplotype frequencies for populations and regional populations of Artemisia halodendron in Horqin Sandy Land
Note: d.f., degrees of freedom.
4 Discussion and conclusion
In this study, we examined nucleotide variation at two nuclear loci ofA. halodendronsampled from the Horqin Sandy Land. We confirmed the division of the native range into two areas, using hydrothermal synthesis index data (Table 3). The analysis of cpDNA variation identified seven haplotypes (Table 4 and Figure 2). Six populations in the low-hydrothermal-level region of the species were dominated by four different haplotypes. The other four populations in the high-hydrothermal-level region of the species were dominated by three different haplotypes (Table 3 and Figure 2).
Many studies have demonstrated that endemic species tend to possess high levels of genetic diversity (Wanget al., 2010; Geet al., 2011). Compared with similar studies (Wanget al., 2011), the level of haplotype diversity (Hd=0.706) and the nucleotide diversity (π=0.0013) within the whole populations ofA. halodendronwere somewhat lower than that of the endemic plants in northern of China. Such a lowHdvalue and π value indicated that this species was very adapted to the sandy land environment, and this character might have made it become the dominant and constructive species in Horqin Sandy Land.At the same time, the populations from the low-hydrothermal-level region exhibited lower haplotype diversity and more limited nucleotide diversity, and were a subset of that observed in the populations from the the high-hydrothermal-level region. These results lend support to the scenario described by Huanget al.(2011) using ISSR markers and Huanget al. (2013)usingpsbA-trnH. This fact might be due to environmental differences (Liet al., 2009; Baoet al., 2010;Liuet al., 2010; Li and Wu, 2011). The low-hydrothermal-level region is a region of severe desertification (Zhaoet al., 2000; Baoet al., 2010). In the process of ecological restoration, species increasing adapt to the local environment, which, in turn, reduces the genetic diversity (Wanget al., 2009; Huanget al.,2011).
Phylogenetic relationships analysis of the cpDNA sequences collected fromA. halodendronin the different hydrothermal-level regions in Horqin Sandy Land did not entirely cluster according to populations or hydrothermal-level regions. This result is similar to that of some other studies (Chenet al., 2009; Huet al., 2010; Zhouet al., 2010; Zhanget al., 2015). The MP tree indicated that the seven haplotypes formed two clades: the haplotypes in clade I all came from the high-hydrothermal-level region (63% bootstrap support); the haplotypes (except Hap E) in clade II came from the low-hydrothermal-level region (58%bootstrap support). This cluster process was closely related to the hydrothermal gradients in Horqin Sandy Land. The results of phylogenetic relationships analysis show that hydrothermal conditions change determines the increase of the haplotypes distribution difference.
The spatial analyses of genetic variation inA.halodendronin the different hydrothermal-level regions in Horqin Sandy Land indicate that the between-populations genetic differentiations are high within the low-, the high-hydrothermal-level region,and the total distribution range (Table 6). Our data revealed significant genetic differences among populations in different hydrothermal level regions. The increase in population genetic differentiation might be related to strong human disturbance, high rates of habitat fragmentation, and decreasing population size in Horqin Sandy Land (Zhaoet al., 2000; Wanget al.,2010). It is generally accepted that genetic differentiation would have increased among the native populations due to the changed environment (Wanget al.,2009).
In conclusion, there are significant genetic differences betweenA. halodendronpopulations from different hydrothermal-level regions. This information about genetic variation has important implications for restoring and managing the degraded ecosystems in arid and semi-arid areas. It is particularly important to understand the genetic variation of extant populations over the entire range of the species' distribution. Additional research is needed to determine levels of genetic variation inA. halodendronthroughout its entire distributional range.
The authors thank all the members of Naiman Desertification Research Station, China Academy of Sciences (CAS), for their help in the field work. We acknowledge the China Meteorological Administration (Beijing, China) for help on the meteorological data information support. This study was financially supported by research projects 2016YFC0500907, 2017FY100205, 41201561,Y551821001, and 145RJYA269.
Bailey HP, 1979. Semi-arid climates: their definition and distribution.In: Hall AE, Cannell GH, Lawton HW (eds.). Agriculture in Semi-Arid Environments Berlin, Heidelberg: Springer, pp. 73–97. DOI:10.1007/978-3-642-67328-3_3.
Bao HJ, Guo J, Yan L, 2010. Study on ecological footprint of the human activity intensity in Horqin sandy—A case of Naiman Banner.Journal of Arid Land Resources and Environment, 24(2): 126–131.DOI: 10.13448/j.cnki.jalre.2010.02.012.
Cao YN, Shi LS, Han S,et al., 2008. Point pattern analysis for a population ofArtemisia halodendronin a Kerqin Sandlot. Chinese Bulletin of Botany, 25(4): 437–442. DOI: 10.3969/j.issn.1674-3466.2008.04.007.
Chao LM, Piao SJ, Zhi RN,et al., 1999. The distribution patterns ofArtemisia halodendronin different sandland types. Journal of Desert Research, 19(S1): 45–48.
Chen FJ, Wang AL, Chen KM,et al., 2009. Genetic diversity and population structure of the endangered and medically importantRheum tanguticum(Polygonaceae) revealed by SSR Markers. Biochemical Systematics and Ecology, 37(5): 613–621. DOI:10.1016/j.bse.2009.08.004.
Dong ZB, Wang XM, Liu LY, 2000. Wind erosion in arid and semiarid China: an overview. Journal of Desert Research, 20(2): 134–139.DOI: 10.3321/j.issn:1000-694X.2000.02.007.
Excoffier L, Laval G, Schneider S, 2005. Arlequin (version 3.0): an integrated software package for population genetics data analysis.Evolutionary Bioinformatics Online, 1: 47–50.
Ge XJ, Hwang CC, Liu ZH,et al., 2011. Conservation genetics and phylogeography of endangered and endemic shrubTetraena mongolica(Zygophyllaceae) in Inner Mongolia, China. BMC Genetics,12: 1. DOI: 10.1186/1471-2156-12-1.
Hamilton MB, 1999. Four primer pairs for the amplification of chloroplast intergenic regions with intraspecific variation. Molecular Ecology, 8(3): 521–523.
Hu YP, Wang L, Xie XL,et al., 2010. Genetic diversity of wild populations ofRheum tanguticumendemic to China as revealed by ISSR analysis. Biochemical Systematics and Ecology, 38(3):264–274. DOI: 10.1016/j.bse.2010.01.006.
Huang G, Zhao XY, Huang YX,et al., 2009. The root longevity ofArtemisia halodendroninhabiting two sandy land habitats. Chinese Journal of Plant Ecology, 33(4): 755–763. DOI: 10.3773/j.issn.1005-264x.2009.04.014.
Huang WD, Zhao XY, Zhao X,et al., 2011. A combined approach using ISSR and ITS analysis for the characterization ofArtemisia halodendronfrom Horqin sandy land, northern China. Biochemical Systematics and Ecology, 39(4–6): 346–351. DOI: 10.1016/j.bse.2011.04.011.
Huang WD, Zhao XY, Zhao X,et al., 2013. Genetic diversity inArtemisia halodendron(Asteraceae) based on chloroplast DNApsbA-trnH region from different hydrothermal conditions in Horqin sandy land, northern China. Plant Systematics and Evolution, 299:107–113. DOI: 10.1007/s00606-012-0707-4..
Huang WD, Zhao XY, Zhao X,et al., 2014. Relationship between the genetic diversity ofArtemisia halodendronand climatic factors.Acta Oecologica, 55: 97–103. DOI: 10.1016/j.actao.2013.12.005.
Li FR, Zhang AS, Duan SS,et al., 2005. Patterns of reproductive allocation inArtemisia halodendroninhabiting two contrasting habitats.Acta Oecologica, 28(1): 57–64. DOI: 10.1016/j.actao.2005.02.005.Li FR, Zhao LY, Zhang H,et al., 2004. Wind erosion and airborne dust deposition in farmland during spring in the Horqin Sandy Land of eastern Inner Mongolia, China. Soil and Tillage Research,75(2): 121–130. DOI: 10.1016/j.still.2003.08.001.
Li J, 1991. The distribution ofArtemisia halodendronand its status in the natural vegetation succession. Journal of Desert Research,11(2): 55–60.
Li SG, Harazono Y, Oikawa T,et al., 2000. Grassland desertification by grazing and the resulting micrometeorological changes in Inner Mongolia. Agricultural and Forest Meteorology, 102(2–3):125–137. DOI: 10.1016/S0168-1923(00)00101-5.
Li SG, Harazono Y, Zhao HL,et al., 2002. Micrometeorological changes following establishment of artificially established artemisia vegetation on desertified sandy land in the Horqin Sandy Land, China and their implication on regional environmental change. Journal of Arid Environments, 52(1): 101–119. DOI: 10.1006/jare.2001.0983.
Li Y, Wulantuya, 2011. Evaluation on forestry suitability in the Horqin Sandy Land—A case study in Horqinzuoyihouqi Banner. Research of Soil and Water Conservation, 18(6): 236–239, 244.
Li YQ, Zhao HL, Li YL,et al., 2009. Soil nitrogen mineralization and nitrification in different habitats, Horqin sandy land. Journal of Desert Research, 29(3): 438–444.
Librado P, Rozas J, 2009. DnaSP v5: a software for comprehensive analysis of DNA polymorphism data. Bioinformatics, 25(11):1451–1452. DOI: 10.1093/bioinformatics/btp187.
Liu Y, Zhang DY, Yang HL,et al., 2010. Fine-scale genetic structure ofEremosparton songoricumand implication for conservation.Journal of Arid Land, 2(1): 26–32. DOI: 10.3724/SP.J.1227.201000026.
Nei M, 1987. Molecular Evolutionary Genetics. New York: Columbia University Press.
Nei M, Li WH, 1979. Mathematical model for studying genetic variation in terms of restriction endonucleases. Proceedings of the National Academy of Sciences of the United States of America,76(10): 5269–5273.
Sang T, Crawford DJ, Stuessy TF, 1997. Chloroplast DNA phylogeny,reticulate evolution, and biogeography ofPaeonia(Paeoniaceae).American Journal of Botany, 84(8): 1120–1136. DOI:10.2307/2446155.
Swofford DL, 2002. PAUP*: Phylogenetic analysis using parsimony(*and other methods), version 4. 0b10. Sunderland, Massachusetts,USA: Sinauer Associates.
Taberlet P, Gielly L, Pautou G,et al., 1991. Universal primers for amplification of three non-coding regions of chloroplast DNA.Plant Molecular Biology, 17(5): 1105–1109. DOI: 10.1007/BF 00037152.
Tamura K, Dudley J, Nei M,et al., 2007. MEGA4: molecular evolutionary genetics analysis (MEGA) software version 4.0. Molecular Biology and Evolution, 24(8): 1596–1599. DOI:10.1093/molbev/msm092.
Thompson JD, Plewniak F, Poch O, 1997. A comprehensive comparison of multiple sequence alignment programs. Nucleic Acids Research, 27(13): 2682–2690. DOI: 10.1093/nar/27.13.2682.
Wang CH, Li SF, Fu CZ,et al., 2009. Molecular genetic structure and evolution in native and colonized populations of the Chinese mitten crab,Eriocheir sinensis. Biological Invasions, 11(2): 389–399.DOI: 10.1007/s10530-008-9256-8.
Wang JF, Pan YZ, Gong X,et al., 2011. Chloroplast DNA variation and phylogeography ofLigularia tongolensis(Asteraceae), a species endemic to the Hengduan Mountains region of China. Journal of Systematics and Evolution, 49(2): 108–119. DOI: 10.1111/j.1759-6831.2011.00117.x.
Wang T, 2003. Desert and Desertification in China. Shijiazhuang:Hebei Science and Technology Press.
Wang TJ, Li WQ, Zhang SY,et al., 2010. Genetic diversity and differentiation of five natural populations ofArtemisia halodendron. Scientia Silvae Sinicae, 46(12): 171–175.
Wright S, 1951. The genetical structure of populations. Annals of Human Genetics, 15(1): 323–354. DOI: 10.1111/j.1469-1809.1949.tb02451.x.
Zhang HX, Zhang ML, Wang LN, 2015. Genetic structure and historical demography ofMalus sieversiiin the Yili Valley and the western mountains of the Junggar Basin, Xinjiang, China. Journal of Arid Land, 7(2): 264–271. DOI: 10.1007/s40333-014-0044-2.
Zhao HL, Su YZ, Zhou RL, 2006. Restoration mechanism of degraded vegetation in sandy areas of northern China. Journal of Desert Research, 26(3): 323–328. DOI: 10.3321/j.issn:1000-694X.2006.03.001.
Zhao HL, Zhao XY, Zhang TH, 2000. Causes, processes and countermeasures of desertification in the interlocked agro-pasturing area of North China. Journal of Desert Research, 20(S1): 22–28.
Zhao HL, Zhao XY, Zhang TH,et al., 2002. Boundary line on agropasture zigzag zone in North China and its problems on eco-environment. Advance in Earth Sciences, 17(5): 739–747. DOI:10.3321/j.issn:1001-8166.2002.05.017.
Zhao HL, Zhao XY, Zhang TH,et al., 2003. Desertification Process and Its Recovery Mechanism in Horqin Sandy Land. Beijing:China Ocean Press.
Zhou GY, Yang LC, Li CL,et al., 2010. Genetic diversity in endangeredNotopterygium forbesiiBoissieu based on intraspecies sequence variation of chloroplast DNA and implications for conservation. Biochemical Systematics and Ecology, 38(5): 911–916.DOI: 10.1016/j.bse.2010.09.012.
Zhou RL, Wang HO, Zhao HL, 1999. Response of protective enzymatic system in desert plants grown in different kinds of dunes to atmosphere dehydration and high temperature. Journal of Desert Research, 19(S1): 49–54.
 Sciences in Cold and Arid Regions2018年2期
- Sciences in Cold and Arid Regions的其它文章
- Cash gifts, perception of social sphere and distribution of water resources for rural farmers in a typical oasis area in Northwest China
- Seasonal characteristics of chlorophyll fluorescence kinetics of heteromorphic leaves in Populus Euphratica
- Effects of intercropping on rhizosphere soil microorganisms and root exudates of Lanzhou lily (Lilium davidii var. unicolor)
- A method to obtain soil-moisture estimates over bare agricultural fields in arid areas by using multi-angle RADARSAT-2 data
- Climate change inferred from aeolian sediments in a lake shore environment in the central Tibetan Plateau during recent centuries
- Source and environmental significance of oxalate in Laohugou Glacier No. 12, Qilian Mountains, Western China