Finite element analysis of infrared thermal imaging forfour-layers structure of human thigh
LIU Hong-yan,SUN Qiang*
(1.Changchun Institute of Optics,Fine Mechanics and Physics, Chinese Academy of Sciences,Changchun 130033,China; 2.University of Chinese Academy of Sciences,Beijing 100049,China)
1 Introduction
Infrared imaging technology has been widely applied in the military and remote sensing fields. Recently it has also been paid close attention in bio-medical field due to its characteristics of non-invasive diagnosis, risk-free of ionizing radiation and no inflicting pain on patients[1-3]. Furthermore, infrared thermal imaging diagnosis is specifically worthwhile during the early stage of tumor growth for its physiological test nature[4-5]. This is compared with X-ray or ultrasonic imaging diagnosis which relies on anatomical test only. Usually physiological change precedes anatomical change when one part of human body gets sick[6-7], and so the combination of X-ray imaging with infrared thermal imaging can improve the sensitivity of tumor detection greatly especially at early stage[8-10].
The radiation of skin surface is approximate to that of blackbody with the peak value at about 9.4 μm and the spectral emissivity between 0.98 and 1.0. The total radiation emission of blackbody increases rapidly as the temperature increases. The infrared thermal camera collects the radiation energy of skin surface along the camera direction. Then the temperature distribution on the skin surface is obtained according to the collected radiation energy, the object distance and the radiation direction, by suitable computation and calibration. Infrared thermal image is a two-dimensional map of temperature on skin surface which the size and position of tumor inside the body cannot be acquired directly. In 1948, Pennes established the differential equation of the heat transfer in biological tissues to calculate the temperature distribution inside the body[11]. However, the human body is of multiple layers with different thermo-physical parameters for each layer and analytical solutions of Pennes′ bio-heat transfer equation cannot be obtained normally. Therefore numerical methodology based on human anatomy and finite element analysis becomes the main means of studying heat conduction in human body. Furthermore, as for the topic of inverse heat transfer, forming a more realistic direct model and giving the direct solutions under various heat sources are of significance[12-13].
M.S.Ferreiraetal. established a three-dimensional model of human body composed of 15 cylindrical elements, and numerically studied the heat transfer between large arteries and veins[14]. K.R.Pardasanietal. developed a finite element model using two-dimensional coaxial circular sector elements to study radial and angular heat distribution in dermal regions of human limbs[15]. M. Agrawaletal. developed a finite element model of human limbs with the geometry of elliptical tapered shape, and computed to obtain tissue temperature distributions with different parameters like atmospheric temperature, evaporation rate and thickness of tissues[16]. R.Hatwaretal. considered the multilayer′s tissue structure and the variation of tumor′s size and depth, and then developed a multilayered finite element model of human body[17].
Domestically, G.L.Shietal. acquired firstly the q-r characteristic curve of heat intensity varying with depth which was then used as a criteria of diseases clinically[3]. The diagnosis results of four typical clinical practices were consistent with those of X-ray and B-ultrasonic. C.Y.Wangetal. investigated the relationship between the information of the heat source and the surface temperature distribution by building a two-dimensional finite element analysis model[18]. Simulation results were validated by physical experiments with adjustable heat source buried in layered biological tissues. H.Q.Yangetal. constructed a multi-dimensional model of breast according to anatomical structure and thermal-physical parameters of tissues, and the heat transfer equation was numerically solved by finite difference method[19].
ANSYS caculation requires that the heat generation rate on volume should be constant normally. However, the heat generation rate of arterial blood perfusion is temperature-dependent and the temperature inside the body is not uniform. This is a nonlinear issue in finite element analysis. In this paper the relationship between heat generation rate of arterial blood perfusion and spatial coordinate inside the body is proposed, based on the characteristic of temperature distribution, and a finite element model of four-layers of human thigh with nonlinear heat generation rate on tissues is established in ANSYS environment. Then a tumor with different sizes and at different depths is taken as the object to investigate the influence of tumor on the temperature distributions inside the body and on the skin surface.
2 Theoretical model
The heat transfer in biological tissues was researched by Pennes initially. The mathematical model of bio-heat transfer can be expressed by the partial differential equation of heat conduction:
(1)
Qb=ωbρbcb(Ta-T) ,
(2)

(3)
Whereqwis the heat flow(W/m2),hcis the heat transfer coefficient in the direction of heat flow on the boundary surface due to convection and radiation(W/m2·℃), andTeis the environmental temperature. In this researchhcandTeare set to be 13.5 W/(m2·℃) and 26 ℃, respectively.
With equations (1) and (3), and by Galerkin method, the integral equation of bio-heat transfer for finite element model can be obtained as follows:

(4)
WhereVandSare the volume integral and surface integral range, respectively.Wlis the weighting function used in finite element model.
Theoretically speaking, the numerical solution given by finite element analysis can converge to the analytical solution, provided the segmented elements are large enough. In this research the number of grids of meshing is 1.102 millions and the independent test of the meshing is conducted with grid number from 582.5 thousands to 2.586 millions. The experiment results indicate that in this variation range of grids the changes of temperatures at feature point locations are ±0.002 ℃, which is quite satisfactory. There are five steps in the analysis of bio-heat transfer of human body by infinite element model, including establishing geometric model of the body, setting material thermo-physical parameters, meshing, defining heat loads and boundary conditions, solving, and detailed analysis of results under various factors.
3 Geometric model and thermo-physical parameters of human thigh
Human thigh can be modeled as an approximate cylinder with four layers of skin, fat, muscle and bone. The thickness and thermo-physical-parameters of each layer are listed in Tab.1, where the units of the thermo-physical parameters are given in section 1.

Tab.1 Thicknesses and thermophysical parameters of tissues
It can be seen from equation (2) that the heat generation rate of blood perfusion is a function of body temperature which is not spatially uniform. This is a nonlinear issue in finite element analysis. The temperature near to skin surface is low and that deep inside the body is much higher. Therefore the heat generation rate of blood perfusion near to skin surface is much higher than that inside the body. M.A. Khanday numerically calculated the temperature distributions of human body along radial direction at various environmental temperatures which were believed to be in good agreement with clinical data[20]. Based on Khanday′s results we propose an equation which gives the heat generation rate of blood perfusion as a function of polar radius instead of body temperature:
Qb=ωbρbcb(krn) ,
(5)
Whereris the polar radius with length unit of cm, andkandnare undetermined coefficients. The values ofkandnshould make the value ofkrnalmost equal to (Ta-T) withTis the tissue temperature at polar radius ofr.
According to references of [1] and [21], the tumor doubling time and metabolic heat generation rate are related by a hyperbolic function:
Qmτ=3.27×10⁶(Wday/m3) ,
(6)
Whereτis the time required for the tumor to double its volume with the unit of day. The tumor diameterD(m) is related toτand can be expressed as:
D=0.01e[0.002134(τ-50)].
(7)
Equations (6) and (7) can be used to calculate the metabolic heat rate of tumor with certain diameter. It should be pointed out that the metabolic heat rate for tumors with diameter smaller than 1 cm is considered to be the same as that of tumor with diameter of 1 cm[22].
4 Simulation results of finite element analysis with ANSYS software
4.1 Finite element model of human thigh
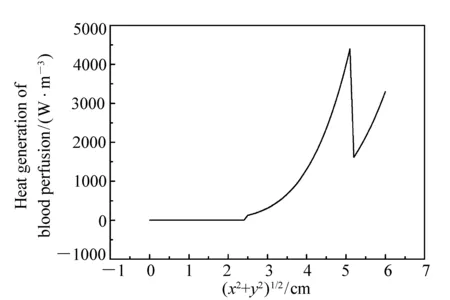
Fig.1 Distribution of heat generation rate of blood perfusion along radial direction of thigh model
With the thermo-physical parameters of tissues listed in Tab.1 we establish a cylinder model of human thigh with four layers including skin, fat, muscle and bone. The curvature radius and height of the cylinder are 6 cm, 10 cm. The coordinate origin is set at the center of the cylinder, withZaxis along axial direction of the cylinder. The heat generation rate of blood perfusion for each layer is given by equation (5) with appropriate coefficients ofkandn. The arterial blood temperature and the environmental temperature are set to be 37 ℃ and 26 ℃, respectively, and the heat transfer coefficienthcon the boundary surface is set to be 13.5 W/(m2·℃). Fig.1 is the acquired distribution of heat generation rate of blood perfusion along radial direction in the layers of thigh. It can be seen that the areas of heat generation of blood perfusion include muscle, fat and skin layers, and the muscle layer is the main area of heat generation of blood perfusion. This is because the muscle layer is with the highest blood per-
fusion rate(three times that of skin layer or fat layer), as well as the biggest thickness(3.4 times that of skin layer plus fat layer).
Fig.2 shows the temperature distribution at cross-section of thigh model, the plane ofZequal to zero, given by finite element analysis in the case without extra inner heat source. Fig.2(a) is the color nephogram of temperature distribution and Fig.2(b) is the variation of temperature along radial direction. It can be seen that the maximum temperature in the body is 37.03 ℃ and the temperature on the skin surface is 32.62 ℃. With the blood perfusion rate, blood density and blood specific heat given by Tab.1, and the temperature variation date given by Fig.2(b), we can obtain the curve of heat generation rate of blood perfusion in each layer which is found to be in a good agreement with Fig.1. This indicates that the methodology used to deal with the nonlinear heat generation rate of artery blood perfusion in this research is suitable.
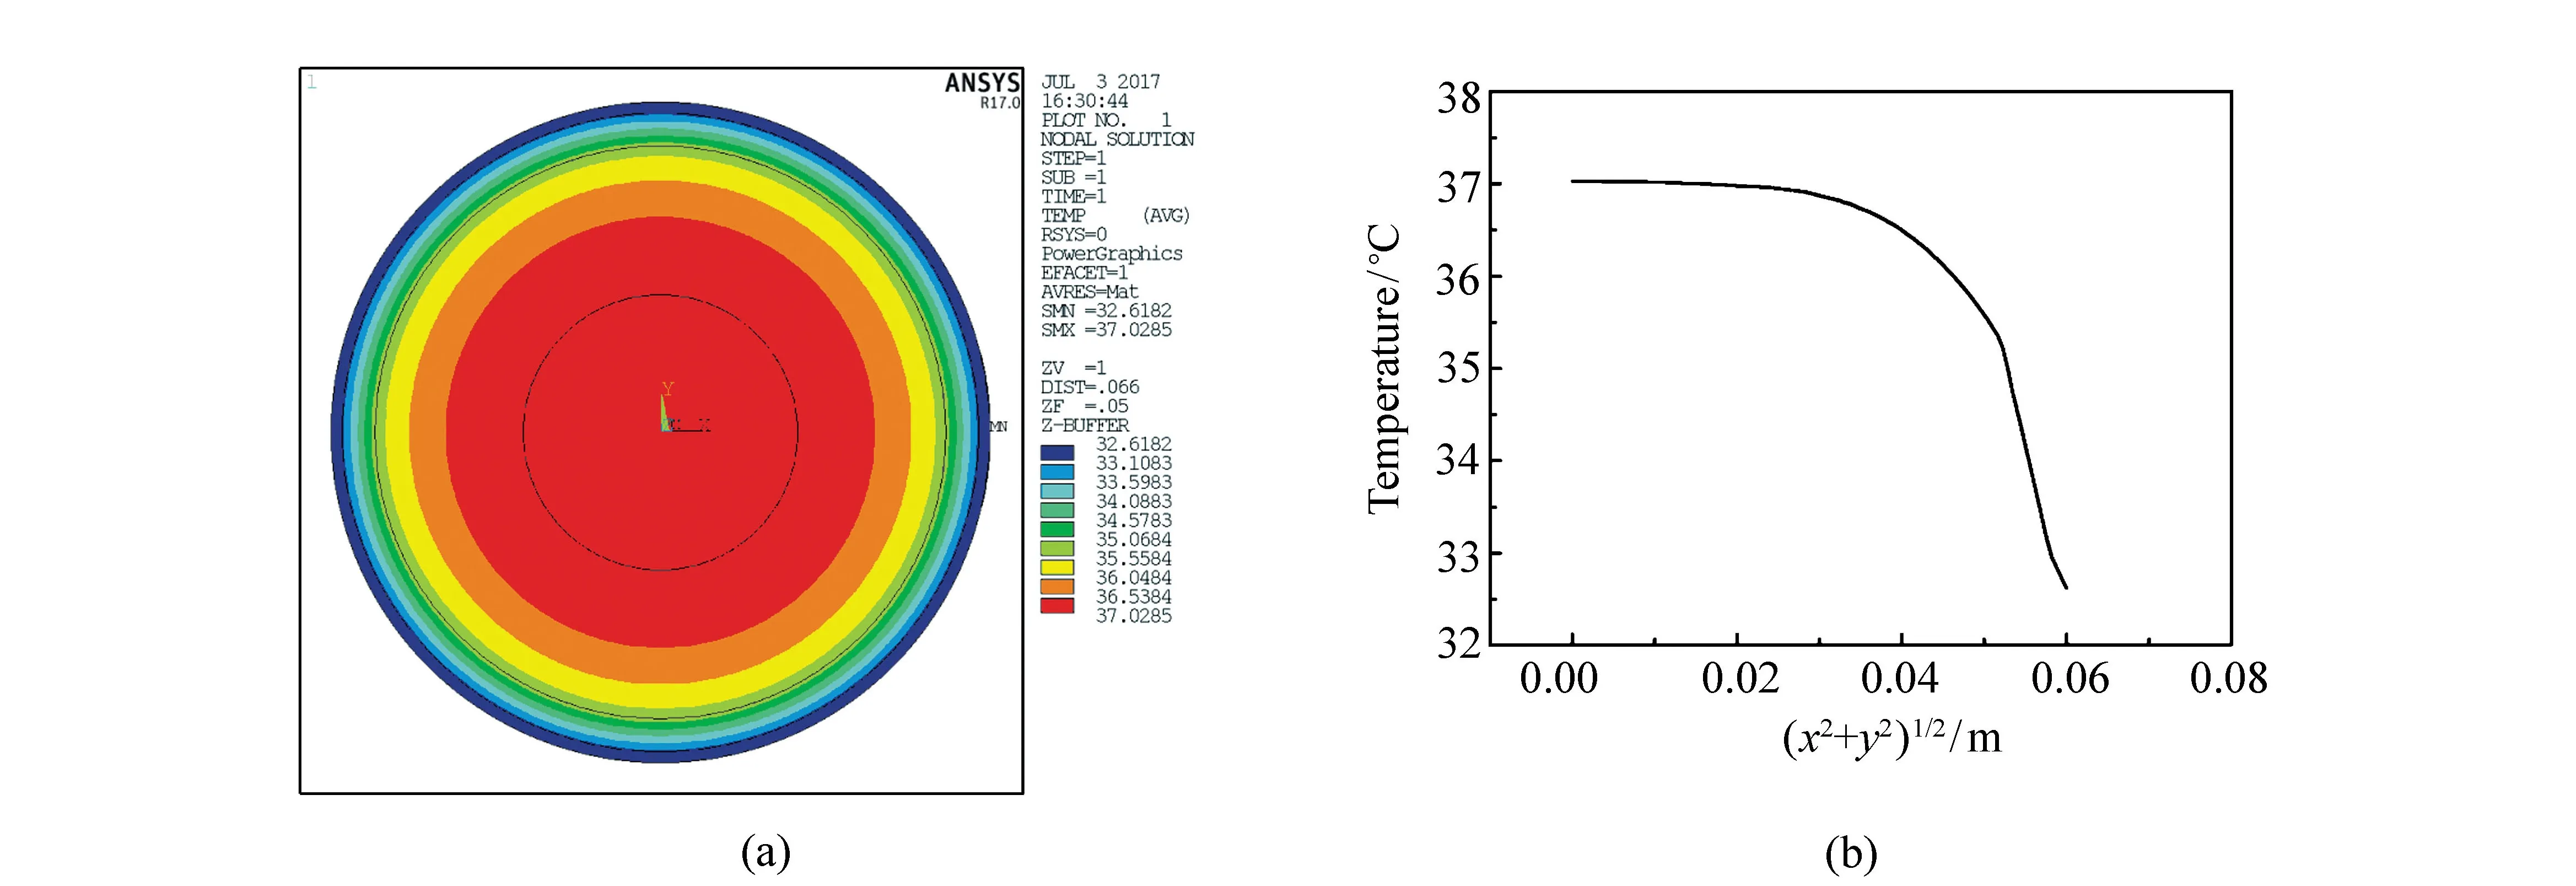
Fig.2 Temperature distribution at cross-section of the cylinder model with Z equal to zero in the case without extra inner heat source given by finite element analysis. (a)Color nephogram of temperature distribution, and (b)temperature variation along radial direction
4.2 Results of finite element analysis for thigh with heat source of a tumor inside
4.2.1Effects of tumor size
We set a spherical tumor with center position atXaxis which is defined as polar axis at plane ofZequal to zero. The variation ofXcoordinate of the tumor center represents the depth changing along radial direction. For the analysis of the effects of tumor size we set the tumor radius as 0.50 cm, 0.52 cm, 0.55 cm, 0.60 cm and 0.70 cm, respectively. The selection of the range of tumor sizes is due to the following considerations. Firstly, the metabolic heat generation rate for tumors with radius smaller than 0.5 cm is the same as that of tumor with radius of 0.5 cm, and therefore the smaller the tumor size is, the smaller the total metabolic heat generation. This characteristic is different from that of selected tumors above. Secondly, as the tumor radius larger than 0.70 cm, the larger the tumor size is, the larger the total metabolic heat generation. This characteristic is also different from that of our selected tumors. With equations of (6) and (7) we can get the tumor doubling time and metabolic heat generation rate of the selected tumors. The results are shown in Tab.2 where the second row lists the tumor doubling time and the third row lists the metabolic heat generation rate of the tumors. It can be seen that as the tumor radius is 0.50 cm the metabolic heat generation rate is 65 400 W/m3, and as the tumor radius increases to 0.55 cm the metabolic heat generation rate drops to 34 544 W/m3which is 52.82 percent of the former. As the tumor radius further increases to 0.70 cm the metabolic heat generation rate further drops to 15 746 W/m3which is only 24.08 percent that of tumor with radius of 0.50 cm.

Tab.2 Doubling time and metabolic heat generation rate of tumor with different radius
At first we demonstrate the influence of a tumor on the temperature distribution at cross-section of thigh model by finite element analysis. The radius of the tumor is set to be 0.50 cm and the depth from skin surface to tumor center is set to be 1.4 cm. The simulation results are shown in Fig.3 where (a) is the color nephogram of temperature distribution at cross-section of the model withZequal to zero, and (b) is the temperature variation along polar axis(Xaxis). It can be seen that the existence of the tumor results in the temperature distribution changing greatly in the related region. There is a temperature raise in the tumor area with the temperature value as high as 37.66 ℃. In contrast, the temperature at the same spatial position is only 36.22 ℃ in the case without tumor(see Fig.2).
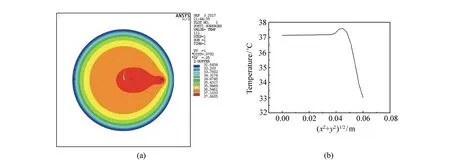
Fig.3 Simulation results of temperature distribution at cross-section of cylinder model with a tumor inside by finite element analysis. (a)Color nephogram of temperature distribution at plane of Z equal to zero, and (b)temperature variation along polar axis
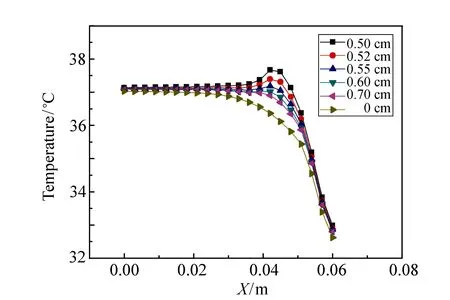
Fig.4 Finite element analysis results of temperature varying along polar axis for tumors with different radii
Fig.4 shows the simulation results of the temperature variation along polar axis for different tumor sizes by finite element analysis. The depth from skin surface to tumor center for all tumors is set to be the same of 1.51 cm. It can be seen that the smaller the tumor size is, the higher the temperature raise in the related region. The tumor with radius of 0.50 cm yields the highest temperature raise of 1.31 ℃ as compared with the case without tumor, and it is only 0.43 ℃ for the tumor with radius of 0.70 cm. These can be explained as follows. The metabolic heat generation of the tumor is determined by both of the volume and the heat generation rate of the tumor. In the range of the selected sizes of tumors, the heat generation rate plays a more important role, leading to decrease of temperature as increase of tumor size.
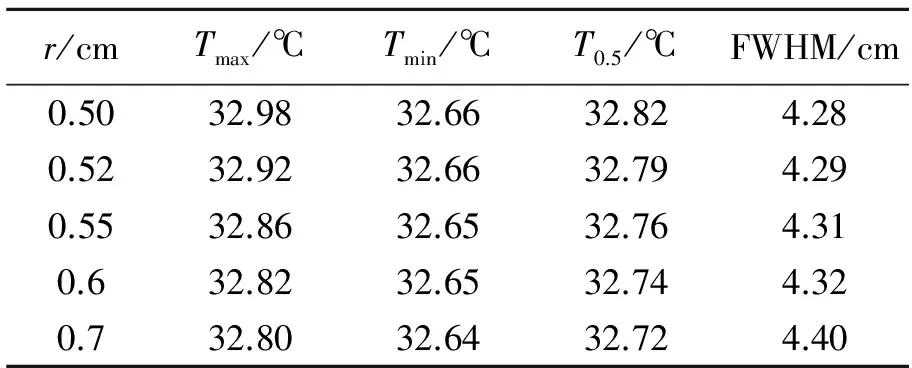
Fig.5 shows the influence of tumor sizes on the temperature distributions on the skin surface where (a) is the temperature distributions along circumference at plane ofZequal to zero, and (b) is the temperature distribution alongZdirection. The angle ofθin Fig.5(a) is the polar angle with respect toXaxis. It can be seen that the variations of the temperature curves with respect to spatial position in Fig.5(b) are relatively smooth compared with those in Fig.5(a). However the variation tendency of the curves with respect to tumor size is in good coincidence for Figs.in 5(a) and 5(b). Therefore we discuss the simulation results only with the data in Fig.5(a). Tab.3 lists the typical data of the temperature distributions on the skin surface in Fig.5(a), where the second, third and fourth columns are the maximum, minimum and half maximum of temperature, respectively, and the fifth column is the full width at half maximum of temperature(FWHM) for each curve. The half maximum of temperature is defined as:
(8)
The FWHM is then defined as the full spatial width of the temperature distribution at the half maximum of temperature.
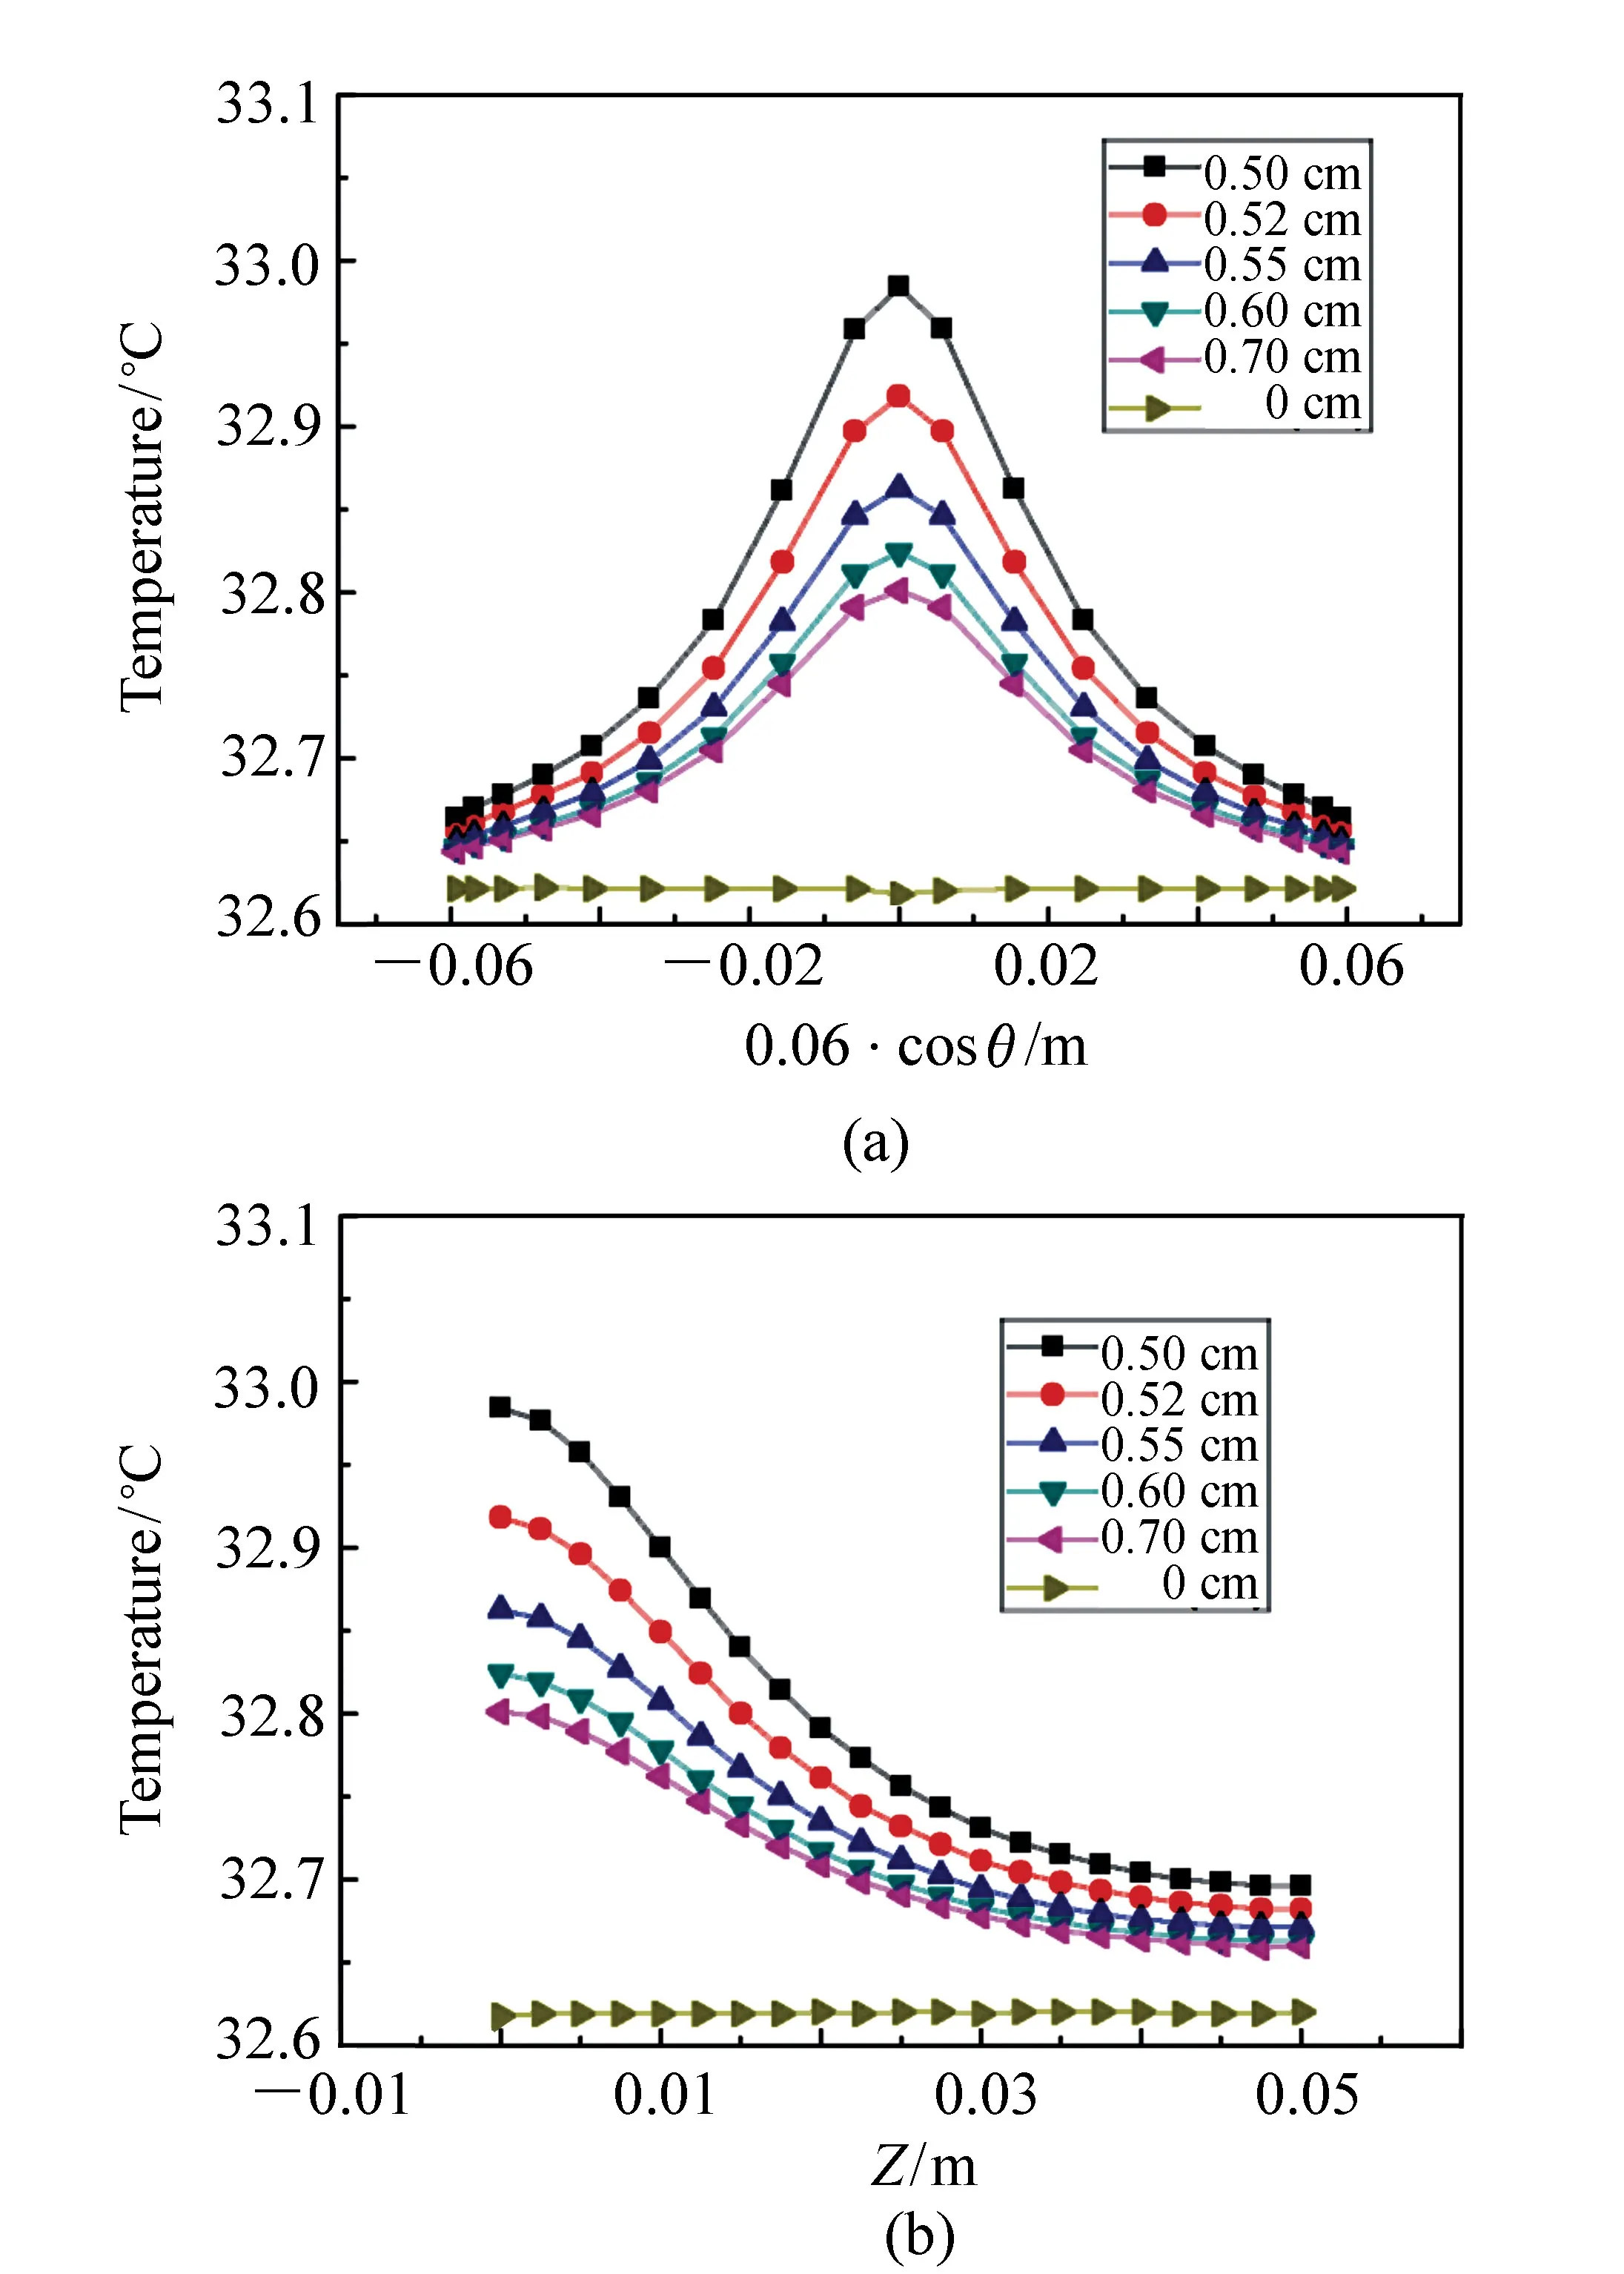
Fig.5 Temperature distributions on the skin surface for tumors with different sizes inside the model. (a)Temperature distributions along circumference at plane of Z equal to zero, and (b)temperature distributions along Z direction
r/cmTmax/℃Tmin/℃T0.5/℃FWHM/cm0.5032.9832.6632.824.280.5232.9232.6632.794.290.5532.8632.6532.764.310.632.8232.6532.744.320.732.8032.6432.724.40
It can be seen from Fig.5(a) and Tab.3 that the temperature variation with respect to position of skin surface for all curves exhibits a Lorentzian function characteristic. As the radius of tumor increases from 0.50 cm to 0.70 cm, the maximum temperature decreases from 32.98 ℃ to 32.80 ℃. The minimum temperatures for different size of tumors are with small disparity. The minimum temperature is 32.66 ℃ as the tumor radius is 0.50 cm, and it is 32.64 ℃ as the tumor radius is 0.70 cm. Correspondingly, the FWHM of the temperature distribution increases monotonously as the increase of the tumor size. The FWHM is 4.28 cm when the tumor radius is 0.50 cm, and it is 4.40 cm when the tumor radius is 0.70 cm.
4.2.2Effects of tumor depth
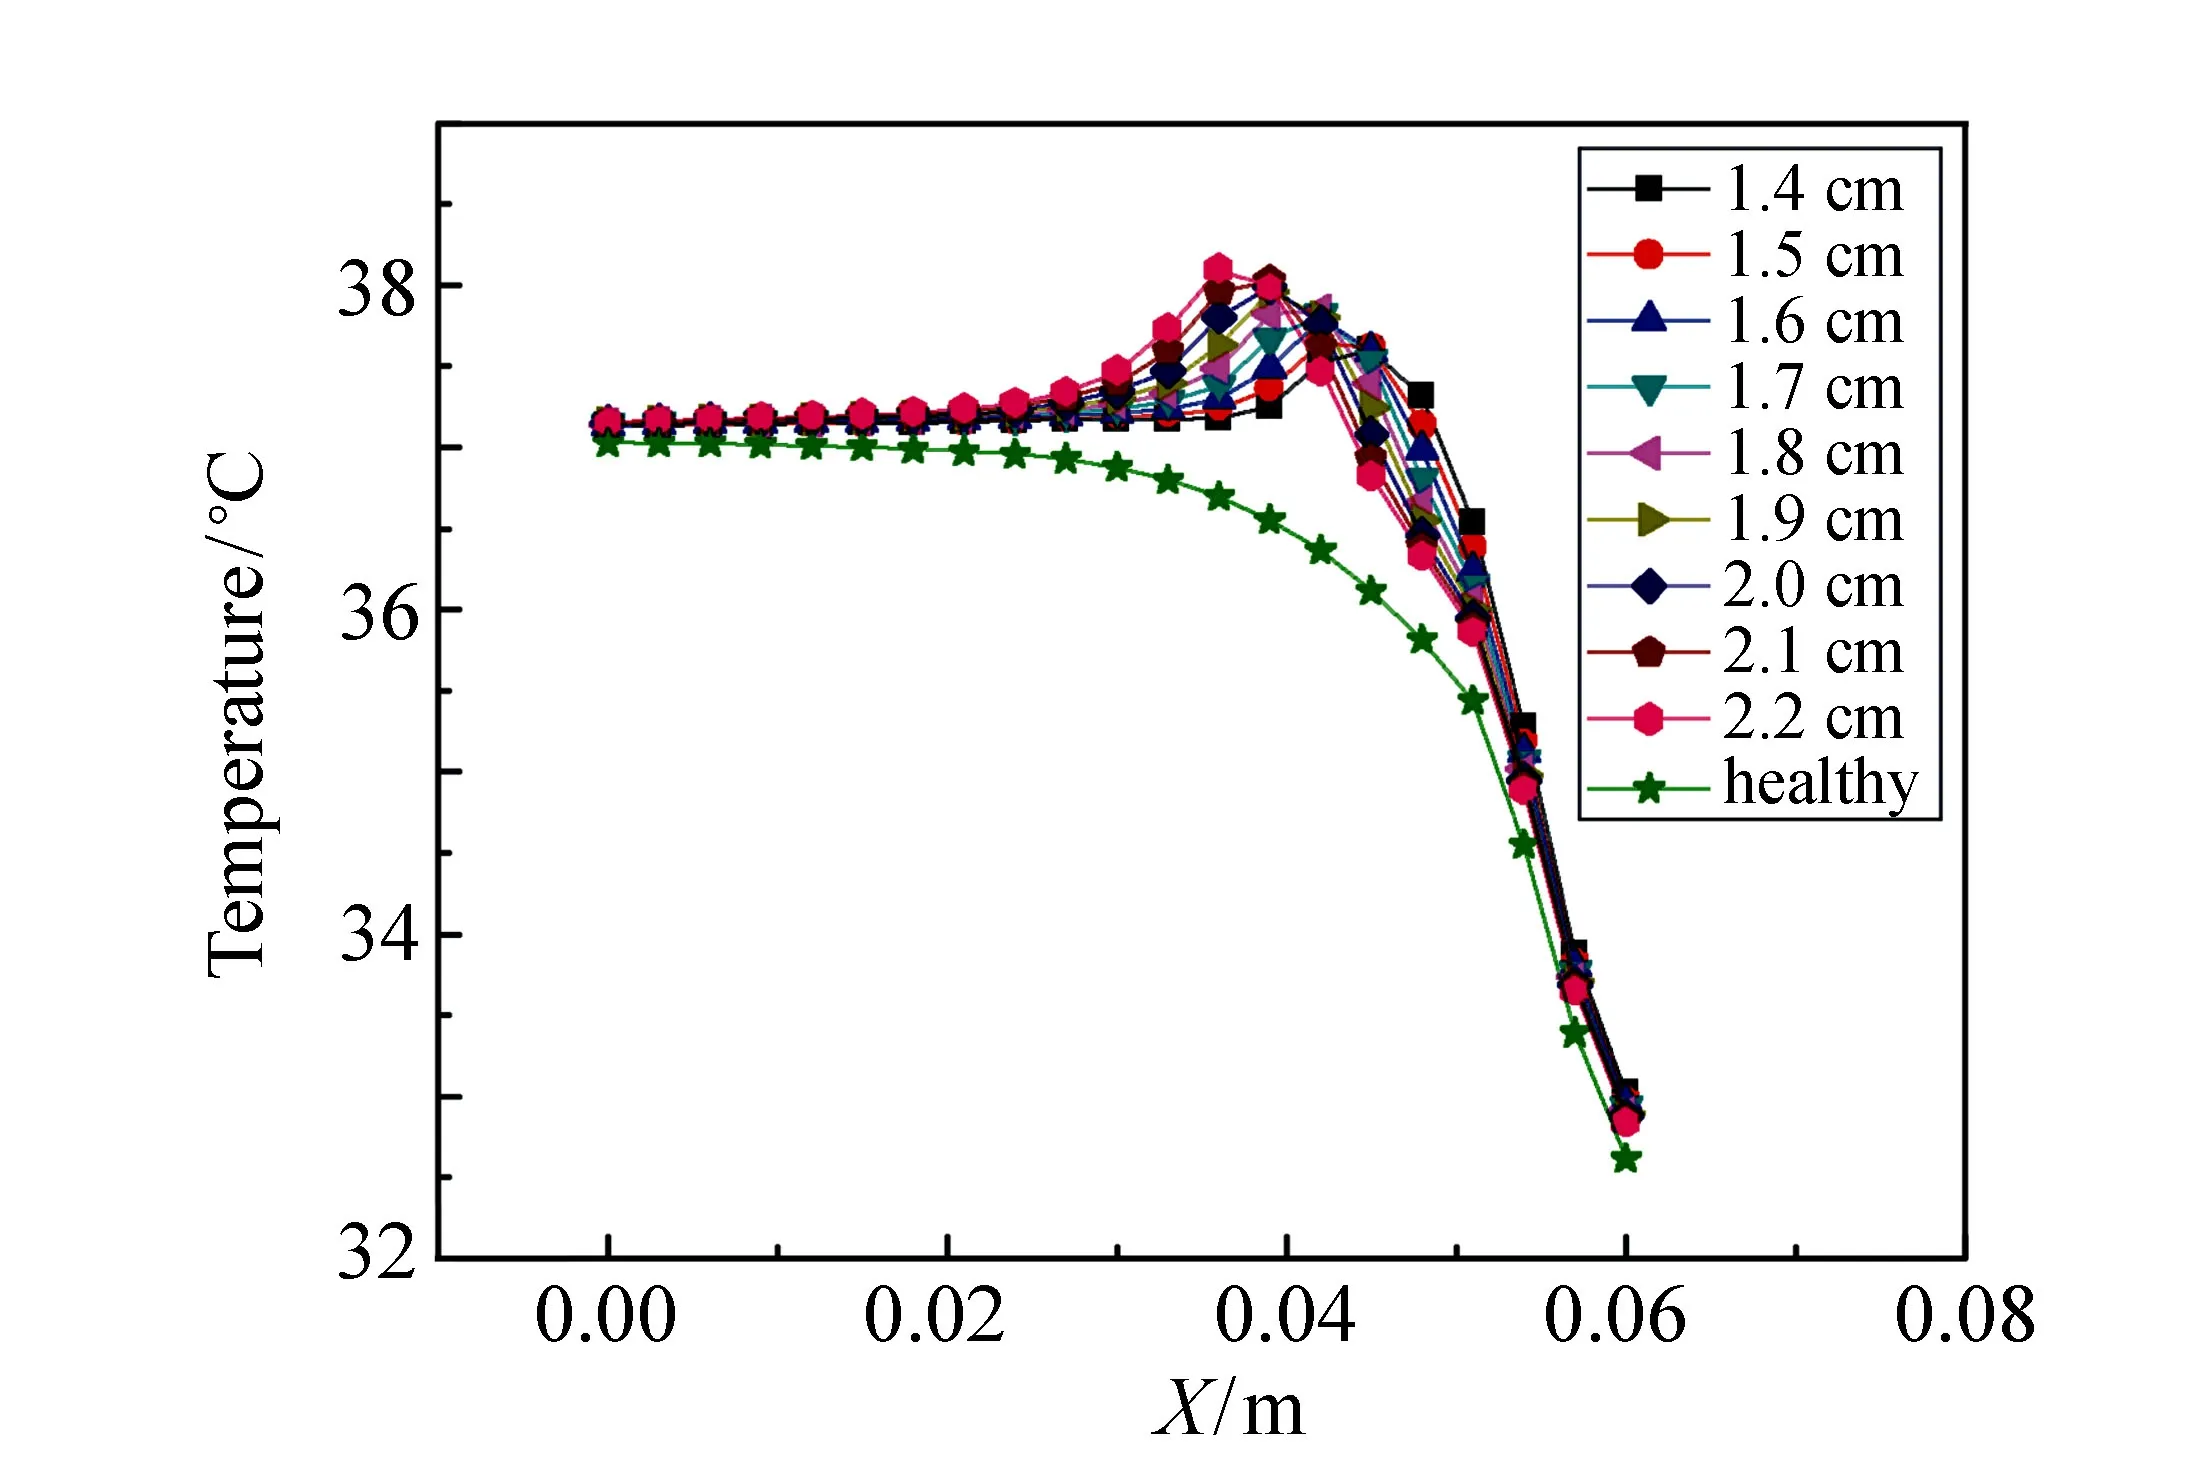
Fig.6 Finite element analysis results of temperature varying along polar axis for tumors with different depths
To investigate the effects of tumor depth on the temperature distribution, we set the tumor radius to be 0.50 cm and the range of tumor depths is from 1.4 cm to 2.2 cm with interval of 0.1 cm. Fig.6 shows the simulation results of the temperature variation along polar axis for different tumor depths by finite element analysis. It can be seen that the existence of tumor causes change in the temperature curve and the bulge point at the position of the tumor center can be observed. The temperature at the bulge point is higher for a tumor located deeper. The temperature is about 38.02 ℃ for the tumor with depth of 2.2 cm, while it is about 37.60 ℃ for the tumor with depth of 1.4 cm. However, little difference of the maximum temperature change with and without tumor can be observed for tumors with different depths. The maximum temperature changes are 1.48 ℃ and 1.44 ℃ for the tumor with center depth of 1.4 cm and 2.2 cm, respectively.
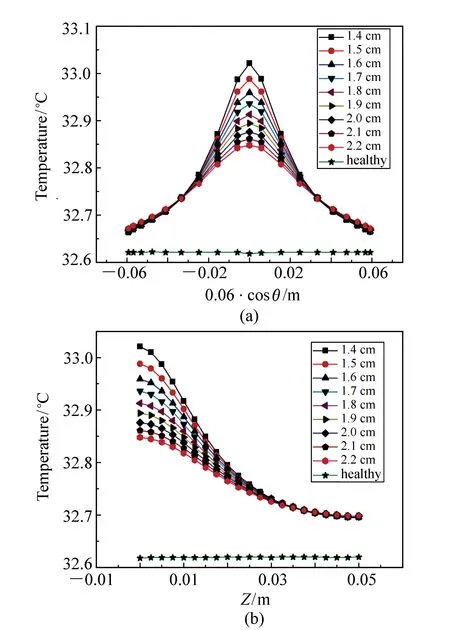
Fig.7 Temperature distributions on the skin surface for a tumor with different depths inside the model. (a)the temperature distributions along circumference at plane of Z equal to zero, and (b)the temperature distribution along Z direction
Fig.7 shows the influence of the tumor depths on the temperature distributions along circumference at plane ofZequal to zero, and alongZdirection on the skin surface. It can be seen that the variations of the temperature with spatial position in Fig.7(b) are relatively smooth as compared with those in Fig.7(a). However the variation tendency of the curves with respect to tumor depth is in good coincidence in Figs.7(a) and 7(b). Therefore we discuss the simulation results only with the data in Fig.7(a). Tab.4 lists the typical data of the temperature distributions on the skin surface in Fig.7(a), where the second, third and fourth columns are the maximum, minimum and half maximum of temperature, respectively, and the fifth column is the full width at half maximum of temperature for each curve.

Tab.4 Typical data of the temperaturedistribution curves in Fig.7(a)
It can be seen from Fig.7(a) and Tab.4 that the temperature variation with respect to the position of skin surface exhibits a Lorentzian function characteristic. The shallower the tumor depth is, the higher the maximum temperature on the skin surface and the steeper the temperature variation. For the tumor with center at depth of 1.4 cm, the maximum temperature on the skin surface is 33.02 ℃ and the FWHM of temperature is 4.05 cm. For the tumor with center at depth of 1.8 cm, the maximum temperature on the skin surface is 32.91 ℃ and the FWHM of the temperature distribution is 4.89 cm. For the tumor with center at depth of 2.2 cm, the maximum temperature on the skin surface is 32.85 ℃ and the FWHM is 5.76 cm. It can also be seen that although the maximum temperature on the skin surface is of great difference for tumors with different center depths, the minimum temperature is of small difference. The difference of the maximum temperatures is 0.17 ℃ for the tumors with depths of 1.4 cm and 2.2 cm, but the difference of the minimum temperatures is only 0.01 ℃.
4.3 Discussion
To evaluate the correction and accuracy of above simulation results, we take A. Chanmugam′s work as comparison. In reference [23] the effects of breast tumor on the surface temperature distribution were presented and were compared with experimental observations using a 3D computational model. It can be seen in Fig.4 of the reference that for a tumor with fixed radius of 5 mm as the tumor depth decreases from 20 mm to 15 mm, the maximum temperature rise on skin surface increases from 0.08 ℃ to 0.19 ℃. For a comparison, it increases from 0.26 ℃ to 0.37 ℃ in our research. It is noticed that not only the values of temperature rises are in the same order of magnitude as above, but also the increment is the same of 0.11 ℃. For a tumor with fixed depth of 15 mm as tumor radius increases from 5 mm to 7.5 mm, the maximum temperature change on skin surface increases from 0.19 ℃ to 0.50 ℃ in Ref.[23], but decreases from 0.36 ℃ to 0.18 ℃ in our research. Obviously the temperature rises are in the same order of magnitude for both researches, but the variation tendency as tumor size is in contrary. This is because in our simulations the metabolic heat generation rate of tumor as a function of tumor size is taken into account.
5 Conclusions
We have established a finite element model of human thigh with four-layers of bone, muscle, fat and skin, and proposed a methodology to solve the nonlinear problem of temperature-dependence of the heat generation rate of blood perfusion in the model. The model is then used to investigate the correlation of the infrared thermal imaging with a tumor inside human body.
It is shown in the given range of tumor diameters that a smaller tumor yields higher temperature raise inside the body, and higher peak temperature and narrower FWHM of the temperature distribution on the skin surface.
It is also shown for tumors at different depths that a tumor located deeper yields higher peak temperature inside the body, and lower peak temperature and wider FWHM of the temperature distribution on the skin surface.
[1]BEZERRA L A,OLIVEIRA M M,ROLIM T L,etal.. Estimation of breast tumor thermal properties using infrared images[J].SignalProcessing,2013,93(10):2851-2863.
[2]SILVA L F,SANTOS A A S M D,BRAVO R S,etal.. Hybrid analysis for indicating patients with breast cancer using temperature time series[J].ComputerMethods&ProgramsinBiomedicine,2016,130:142-153.
[3]SHI G L,HAN F,LIANG C W,etal.. A novel method of thermal tomography tumor diagnosis and its clinical practice[J].AppliedThermalEngineering,2014,73(1):408-415.
[4]ETEHADTAVAKOL M,NG E Y K. Breast thermography as a potential non-contact method in the early detection of cancer:a review[J].JournalofMechanicsinMedicine&Biology,2013,13(2):309-107.
[5]XIAO J,HE Z Z,YANG Y,etal.. Investigation on three-dimensional temperature field of human knee considering anatomical structure[J].InternationalJournalofHeat&MassTransfer,2011,54(9-10):1851-1860.
[6]GIUSEPPE C,DANILO E,SUKHOON O,etal.. An approach to rapid calculation of temperature change in tissue using spatial filters to approximate effects of thermal conduction[J].IEEETrans.BiomedEng.,2013,60(6):1735-1741.
[7]MICHEL A P M,SABBIR L,KEVIN B,etal.. In vivo measurement of mid-infrared light scattering from human skin[J].BiomedicalOpticsExpress,2013,4(4):520-530.
[8]BORCHARTT T B,CONCI A,LIMA R C F,etal.. Breast thermography from an image processing viewpoint:a survey[J].SignalProcessing,2013,93(10):2785-2803.
[9]KENNEDY D A,LEE T,SEELY D. A comparative review of thermography as a breast cancer screening technique[J].IntegrativeCancerTherapies,2009; 8(1): 9-16.
[10]NG Y K. A review of thermography as promising non-invasive detection modality for breast tumor[J].InternationalJournalofThermalSciences,2009,48(5):849-859.
[11]PENNES H H. Analysis of tissue and arterial blood temperatures in the resting human forearm[J].JournalofAppliedPhysiology,1948,1(2):93-122.
[12]BHOWMIK A,REPAKA R. Estimation of growth features and thermophysical properties of melanoma within 3-D human skin using genetic algorithm and simulated annealing[J].InternationalJournalofHeat&MassTransfer,2016,98:81-95.
[13]DAS K,MISHRA S C. Estimation of tumor characteristics in a breast tissue with known skin surface temperature[J].JournalofThermalBiology,2013,38(6):311-317.
[14]FERREIRA M S,YANAGIHARA J I. A transient three-dimensional heat transfer model of the human body[J].InternationalCommunicationsinHeat&MassTransfer,2009,36(7):718-724.
[15]ADLAKHA K R P. Coaxial circular sector elements to study two-dimensional heat distribution problem in dermal regions of human limbs[J].Mathematical&ComputerModelling,1995,22(9):127-140.
[16]AGRAWAL M,PARDASANI K R. Finite element model to study temperature distribution in skin and deep tissues of human limbs[J].JournalofThermalBiology,2016,62(SI):98-105.
[17]HATWAR R,HERMAN C. Inverse method for quantitative characterization of breast tumors from surface temperature data[J].InternationalJournalofHyperthermia,2017,33(7):741-757.
[18]WANG C Y,SUN B,CHEN L,etal.. Thermal imaging research on relationship between the parameters of the inner abnormal heat source and surface temperature distribution[J].Laser&Infrared,2012,42(1): 31-35.
[19]YANG H Q,LIN Q Y,ZHEN Y E,etal.. Finite element analysis for temperature distribution of normal breast[J].ActaLaserBiologySinica,2007,16(4):424-427.
[20]KHANDAY M A. Numerical study of partial differential equations to estimate thermoregulation in human dermal regions for temperature dependent thermal conductivity[J].JournaloftheEgyptianMathematicalSociety,2014,22(1):152-155.
[21]MITRA S,BALAJI C. A neural network based estimation of tumor parameters from a breast thermogram[J].InternationalJournalofHeat&MassTransfer,2010,53(21-22):4714-4727.
[22]NG E Y,SUDHARSAN N M. An improved three-dimensional direct numerical modelling and thermal analysis of a female breast with tumour[J].ProceedingsoftheInstitutionofMechanicalEngineersPartHJournalofEngineeringinMedicine,2001,215(1):25-37.
[23]CHANMUGAM A,HATWAR R,HERMAN C. Thermal analysis of cancerous breast model[J].InternationalMechanicalEngineeringCongressandExposition,2012,2:134-143.

