Safety Evaluation of Concrete Structures Based on a Novel Energy Criterion
Qiang Tong, Qingwen Ren,, Lei Shen, Linfei Zhang and Yin Yang
1 Introduction
Along with their increasing height, the geological conditions of dams have grown in complexity in recent years; therefore, dam safety assessment has become vital [Zhang,Wang, Wang et al. (2014); Lin, Ma, Liang et al. (2014); Chongshi, Dong, Zhanchao et al. (2013)]. Dam safety can be evaluated by using a geo-mechanical model test or performing a numerical simulation. Numerous dam instability failure criteria, including the convergence criterion [Dawson, Roth and Roth (1999)], catastrophe criterion [Ren,Xu and Wan (2007); Griffiths and Lane (1999)], and plastic zone transfixion criterion[Matsui and San (1992)], have also been applied in engineering. The convergence criterion is determined by the error of numerical simulation when the numerical calculation iteration does not converge. A calculation divergence does not always indicate the future occurrence of a structural failure. Many factors can affect computation convergence, including the constitutive relation of materials. The catastrophe criterion mainly refers to the displacement mutation criterion, which is determined by the displacement mutation of the feature point. However, the catastrophe of the feature point is sometimes not obvious, and the results of the displacement catastrophe criterion are usually subjective according to experience. The plastic zone transfixion criterion is determined by the development of a plastic zone. A connected plastic zone is a necessary yet insufficient condition for failure. Moreover, the successful development of a plastic zone greatly depends on a large, unlimited development of plastic deformation and displacement. In this case, the results of the above criteria have subjective arbitrariness, thereby making them inadequate for judging structural failure [Ren and Jiang (2011)]. Therefore, these criteria warrant further examination.
Dam failure assessment can be conducted at the material and structure levels, and the aforementioned instability failure criteria are taken from the structure level. At the material level, the dam and its foundation are made of quasi-brittle materials. Many scholars have proposed several failure criteria that can be applied at this level,including the maximum stress criterion, Tresca yield criterion, and Mises yield criterion,all of which have a single parameter, as well as Mohr-Coulomb strength theory and Drucker-Prager strength theory, which have two parameters. The latter two theories are deemed concise and convenient for calculation and are still widely being used today in engineering. However, in recent years, the failure criteria for concrete or rock are becoming increasingly complex and include an increasing number of parameters.Examples of these criteria include the theoretical models of Bresler et al. [Bresler and Pister (1958)] and Willam [Willam (1975)] that have three parameters, the theoretical models of Ottosen [Ottosen (1977)] and Hsieh et al. [Hsieh, Chen and Ting (1979)] that have four parameters, the theoretical models of Guo et al. [Guo and Wang (1991)],Podgorski [Podgorski (1985)], and Song et al. [Song,Zhao, Fang et al. (1996)] that have five parameters, and the theoretical model of Yu [Yu (2004)] that has wide influence of twin shear unified strength theory.
Given their complexity and large number of parameters, the aforementioned theoretical models have been rarely applied in engineering practice. To study structural failure and degree of damage in structures, many scholars have examined the appearance and extension of cracks and have proposed several crack models. However, these scholars have unavoidable to analyze the stress field surrounding the crack tip because of its complexity. To avoid such complexity, some researchers have investigated these cracks from the viewpoint of energy, which also allows them to explain the characteristics of deformation and failure criterion based on the variations in energy.
Accordingly, many scholars have investigated failure criteria based on theory of strain energy density, which was proposed by Sih [Sih (1973)] to study the extension of cracks based on balance of energy theory. Zhou [Zhou (2006)] studied thetriaxial compressive behavior of rocks with mesoscopic heterogeneous behaviorby considering the strain energy density factor. Ayatollahi et al. [Ayatollahi and Sedighiani (2012)]studied the mode I fracture initiation in limestone by using the strain energy density criterion. Tu et al. [Tu, Liu and Zhong (2016)] regarded the loss of gravitational potential energy, the increments in elastic strain energy and dissipated energy, and the sudden substantial changes in kinetic energy as slope failure criteria. Tarasov [Tarasov and Potvin (2013)] used brittleness at compression to measure the capability of rocks to self-sustain macroscopic failure in the post-peak region due to the elastic energy accumulated within the loaded material. Xie et al. [Xie,Ju and Li (2005)] argued that the unit would break when the strain energy released from the rock unit reached the required surface energy to failure, while structural failure would occur when a certain number of units had been destroyed. Teng et al. [Teng,Liu and Lim (2004)] used multiple methods to calculate the fracture energies of 29 three-point bending beam specimens made of ultrahigh-strength concrete. Li et al. [Liand Ren (2009)] developed a simplified coupling damage constitutive model based on damage energy release rate,which could reflect the salient features of for concrete under uniaxial and biaxial loading conditions. Wu et al. [Wu, Li and Faria (2006)] proposed a plastic-damage constitutive model for concrete in which the elastic Helmholtz free energy was defined to establish the plastic-damage constitutive relation with the internal variables. The model then derived the damage energy release rates that were conjugated to the damage variables. Xu et al. [Xu and Zhang (2008)] proposed the energy parameter K =to integrate the fracture energy release properties of double-G and double-K fracture models, which calculation and experimental results showed good agreement. Chen et al.[Chen, Gu, Bao et al. (2016)] used the elastic strain energy criterion to analyze the structural failure of a concrete arch dam; however, the dam concrete was assumed to be ideally elastic-plastic.
The above studies indicate that elastic strain energy criterion may be a good index. If we can start from the material level and analyze in detail the energy change in the material failure process, then a failure criterion can be established at the material level and a dam failure criterion can be established at the structure level based on energy change [Xie, Peng, Ju et al. (2005); Xie, Ju, Li et al. (2008)].
This paper is organized as follows. Section 2 introduces the basic concrete damaged plasticity model and proposes a modified and highly reasonable stress-strain curve.Section 3 studies the energy change in the concrete failure process at the material level based on the different stress-strain curves of concrete under uniaxial tension and compression. Section 5 analyzes the stability at the structure level by using the strength reduction method. In this section, it studies the elastic strain energy change in the failure process of the Long Xi-Kou Dam, and compares the failure criterion of this dam based on elastic strain energy with the conventional structural failure criteria employed in engineering. Section 6 summarizes the paper and proposes directions for future research.
2 Calculation model and criteria
2.1 Concrete damaged plasticity model
The post-peak softening stage of constitutive relation and the elastic stiffness degradation of concrete are both considered in this article. The complex, nonlinear material behavior of concrete is described by using the concrete damaged plasticity model proposed by Lubliner et al. [Lubliner, Oliver, Oller et al. (1989)] and improved by Lee et al. [Lee and Fenves (1998)].
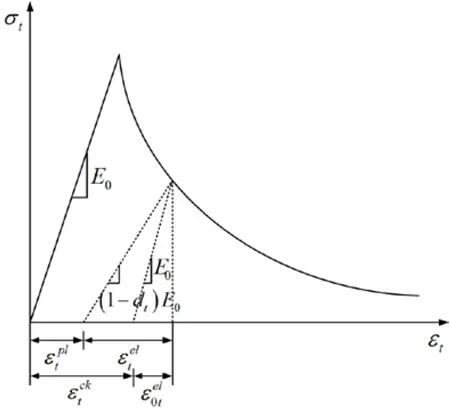
Figure 1: Stress-strain curve of concrete under uniaxial tension
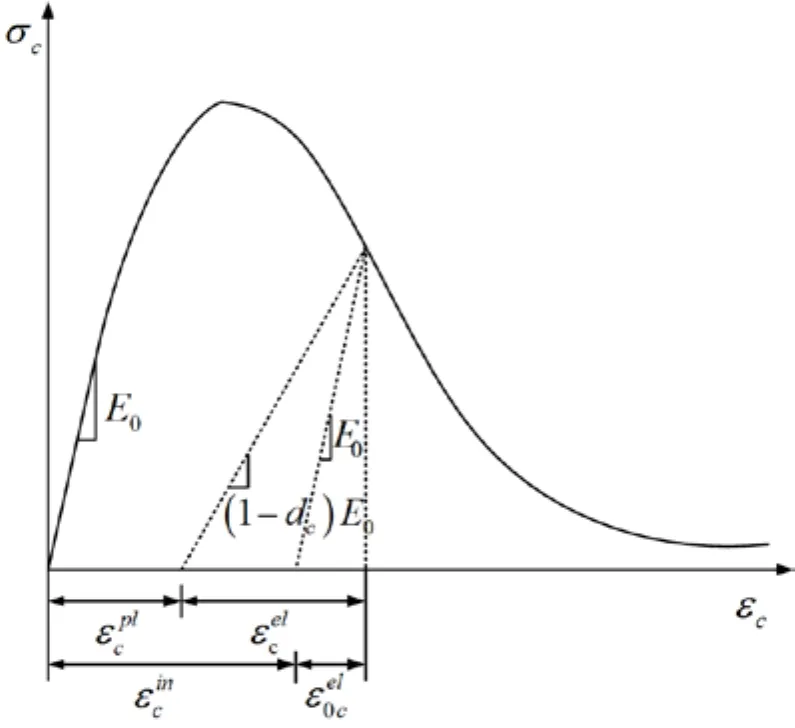
Figure 2: Stress-strain curve of concrete under uniaxial compression
In the concrete damaged plasticity model, the strain is decomposed into the elastic partand the plastic partor into the cracking strainand undamaged elastic strainas shown in Fig. 1. The model is expressed as

From the horizontal ordinate of Fig. 1, the plastic strain is expressed as

where E0is the initial elastic stiffness,Ed= ( 1 - dt)E0, and dtrepresents the elastic stiffness degradation.
The stress-strain relation of concrete is

The tensile damage parameter dtis calculated as follows based on the relations in Eq.(1-3):

Similarly, the compressed damage parameter dcis calculated as

Eq. (4) and (5) are applied to obtain the compression and tension damage parameters.The damage parameter values range from 0 (no damage) to 1 (fully damaged) to indicate the level of damage.
The values of btand bcin the above formulas are determined by using experimental data and are measured by the unloading and reloading stress paths of cyclic loading.Following the recommendations ofBirtel et al. [Birtel and Mark (2006)], the values bt=0.1and bc=0.7are used in this paper.
The elastic strain energy density on the uniaxial tension is

Similarly, the elastic strain energy density on the uniaxial compression is

2.2 Elastic strain energy density criterion
From the viewpoint of energy, a rock bursts when its storage elastic energy is equal to the surface energy; similarly, concrete failure occurs when the releasable elastic energy Ueis equal to the capability of accumulated energy Uc.
Concrete has two energy-driven failure mechanisms. On the one hand, the capability of concrete accumulated energyUcis reduced due to the external energy input, which in turn leads to the energy dissipation behavior of concrete damage and plastic deformation. The energy dissipation also reduces the strength of the concrete. On the other hand, the releasable elastic energyUeis increased due to the external energy input, which in turn increases the releasable elastic energy in the concrete. In sum, the former mechanism reduces the ability of concrete to resist damage, while the latter increases the chances for destroying the concrete. Concrete failureoccurswhen Ueis equal toUc. Thus, the failure criterion of concrete is established based on the elastic strain energy density; In this criterion, macroscopiccracking occurs when the elastic strain energy density reaches its maximum.
Given that the above criterion is based on the elastic strain energy density, the key is when the elastic strain energy density reaches its maximum. According to the maximum stress criterion, the material is cracked upon reaching the peak stress point (point A in Fig. 3). Meanwhile, the elastic strain energy density reaches its maximum at the point when the degradation of elastic stiffness is not considered.
However, many uniaxial tension experiments on concrete show that the first macroscopic cracking does not occur at peak stress but rather at the post-peak softening segment. This observation indicates that the maximum stress criterion may not be suitable for the first appearance of macroscopic cracking in concrete. The post-peak softening segmentshows that the first macroscopic cracking leads to fracture, increases the deformation, and gradually decreases the bearing capacity until the concrete is fractured. The deformation at this stage is at least five to six times larger than the peak stress deformation.
Therefore, the ability of the elastic strain energy density criterion to reflect the above experimental phenomena determines its suitability for concrete. As shown in Fig. 3,given that the elastic strain energy density monotonically increases in the pre-peak stage, the point of the maximum elastic strain energy density (hereinafter called point B)can only be found in the peak stress point or in the post-peak softening stage. The area of triangle OAD represents the elastic strain energy density of the peak stress point(hereinafter called point A). If the area of triangle EBC is always greater than that of triangle OAD, then point B is in the post-peak softening stage and the elastic strain energy density criterion is suitable for concrete. Otherwise, point B coincides with point A and the elastic strain energy density criterion is not suitable for concrete.
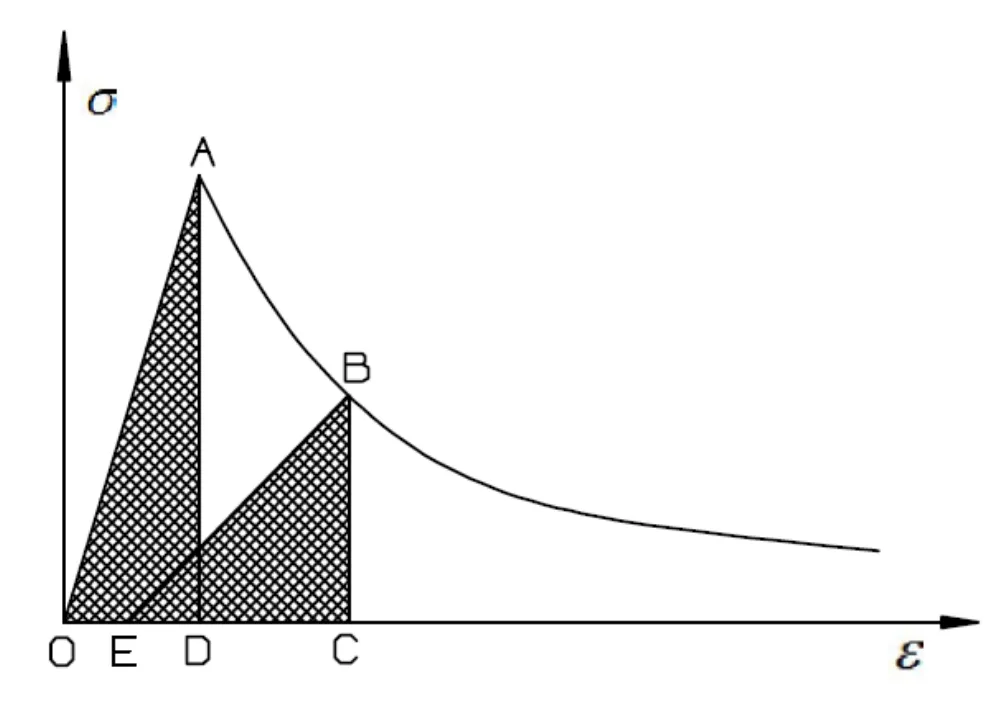
Figure 3: Schematic diagram of elastic strain energy density
3 Energy change in the concrete failure process
3.1 Standard curve
3.1.1 Commonly used curve
The uniaxial constitutive relation is chosen by referring to appendix C of the Chinese“Code for design of concrete structures” (GB50010-2002) as shown in Fig. 4 and 5.
When under uniaxial compression, the linear elasticity stage is commonly taken as y≤0.4(as shown in Fig. 4), while the initial elastic–stiffness E0is the secant modulus of elasticity ofy=0.4. y is specifically expressed as follows:

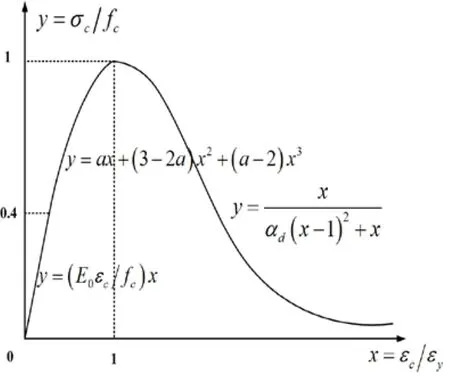
Figure 4: Stress-strain curves of concrete under uniaxial compression
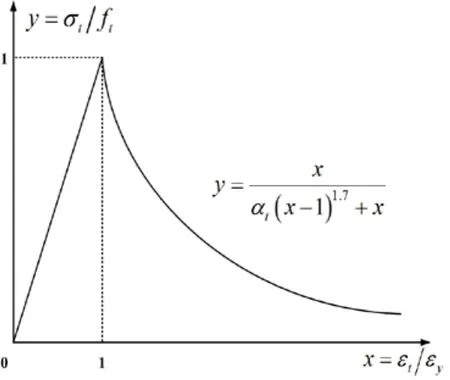
Figure 5: Stress-strain curves of concrete under uniaxial tension
When under uniaxial tension, the linear elasticity stage is commonly taken as y≤1(as shown in Fig. 5), while the initial elastic-stiffness E0is equal to E0under uniaxial compression. y is specifically expressed as follows:

However, the above assumptions show several problems. First, given that the linear elasticity stage isy≤1under uniaxial tension, the damage of the peak stress point is 0, thereby contradicting the experimental findings. Second, the initial modulus of elasticity under tension is slightly less than that under compression. Given the same value of the initial modulus of elasticity,εy(peak tensile strain corresponding to ft)is smaller than the standard suggested value.
3.1.2 Modified curve
A modified assumption is proposed. Under uniaxial tension, Guo [Guo (1997)] found through a series of experiments that the elastic-plastic segmentation point is located on the interval of 0.4≤y≤0.6. In this case, the linear elasticity stage is y≤0.5, while the initial elastic-stiffnessE0is the secant modulus of elasticity of y=0.5.Meanwhile, under uniaxial compression, the secant modulusE0of the corresponding point S must be calculated at the ascending stage, and the linear elasticity stage is taken asy ≤ S.
The specific expressions under uniaxial tension are as follows:

The specific expressions under uniaxial compression are as follows:

The difference between the proposed and commonly used curves is shown in Fig. 6 and 7. These two curves are obviously different under uniaxial tension yet are almost the same under uniaxial compresion. The proposed curve under uniaxial tension solves the aforementioned problems,εy(the strain corresponding to peak stress ft) is equal to the standard suggested value, and the damage of peak stress point is not equal to zero.
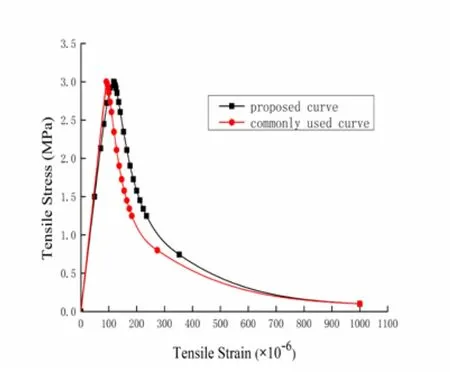
Figure 6: Stress-strain curves of concrete under uniaxial tension
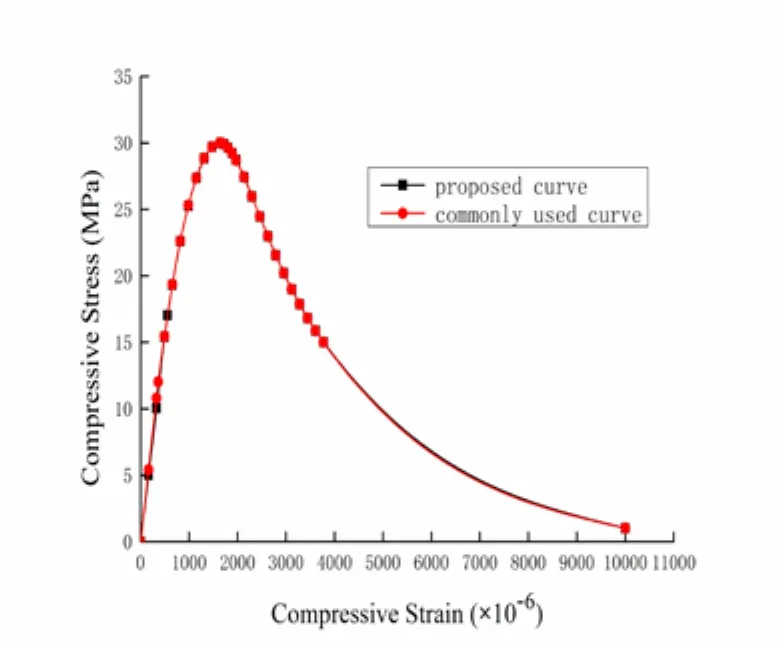
Figure 7: Stress-strain curves of concrete under uniaxial compression
3.1.3 Location of maximum elastic strain energy density
Take C30 grade concrete with a uniaxial compressive strength of 30 MPa and a tensile strength of 3 MPa as an example. The parameters are shown in detail in Tab. 1 and 2.
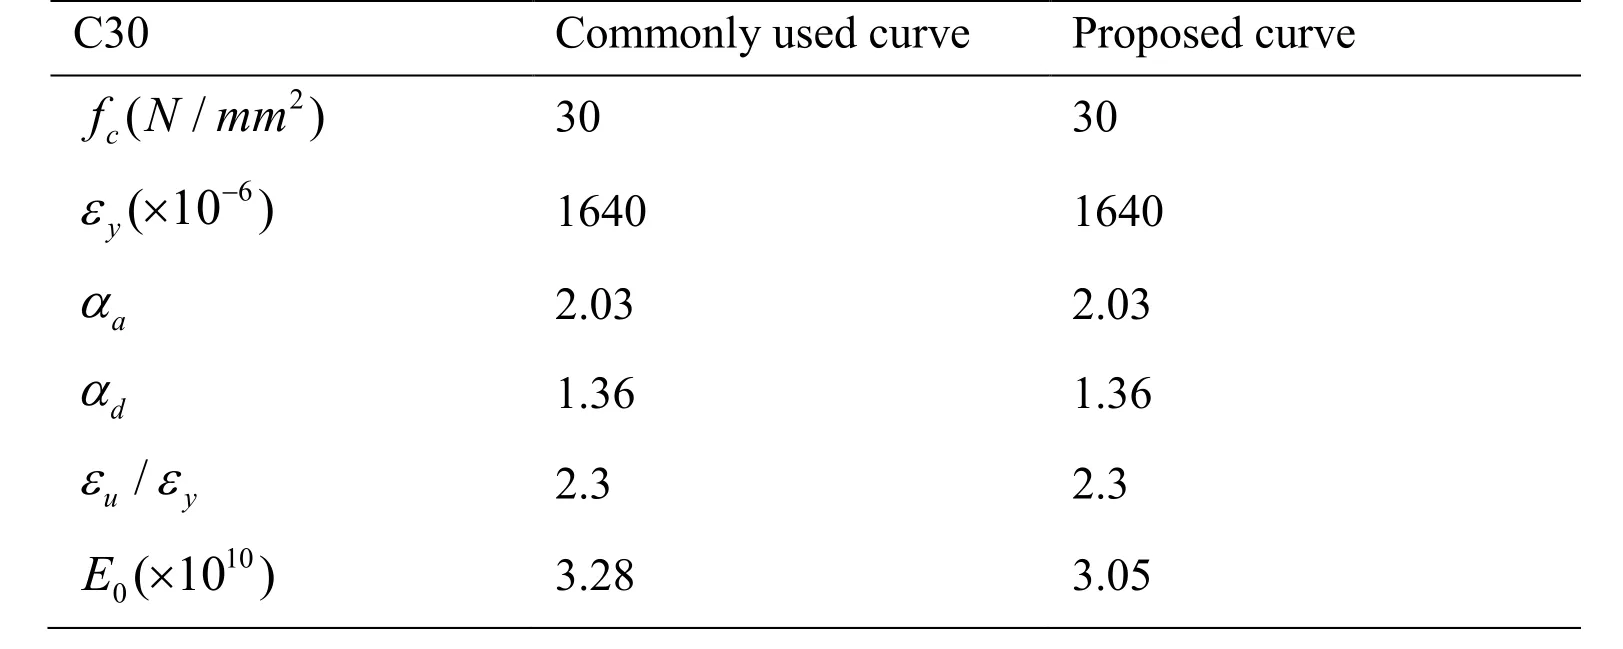
Table 1: Parameter values of the stress-strain curves of concrete under uniaxial compression

Table 2: Parameter values of the stress-strain curves of concrete under uniaxial tension
The elastic strain energy density Wecorresponding to each strain is calculated, and the variation ofWewith strain is analyzed. Figs. 8 and 9 show that η=We/We0, where We0is the elastic strain energy density corresponding to x=1 (point A).

Figure 8: Variation of elastic strain energy density with strain under uniaxial tension
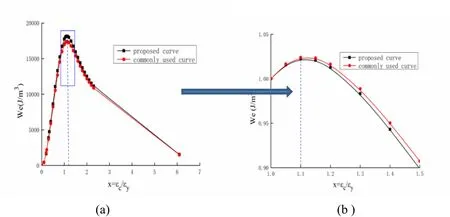
Figure 9: Variation of elastic strain energy density with strain under uniaxial compression
The blue dotted lines in Fig. 8 and 9 indicate the location of the maximum elastic strain energy density. The point of the maximum elastic strain energy density (point B) is always on the post-peak softening segment under both uniaxial compression and uniaxial tension. The proposed and commonly used curves show the same trends and reach their maximum at x=1.1. Therefore, the elastic strain energy density criterion is suitable for C30 grade concrete.
3.1.4 Influence of concrete strength grade
Will the elastic strain energy density criterion remain suitable for other concrete grades when the concrete strength grade increases? Taking three commonly used cement grades of C30, C40, and C50 as examples, the variation of Weis studied in the following sections. The parameters are shown in detail in Tab. 3 and 4.
The constitutive relations of concrete are obtained following the Chinese “Code for design of concrete structures” as shown in Fig. 10-13.
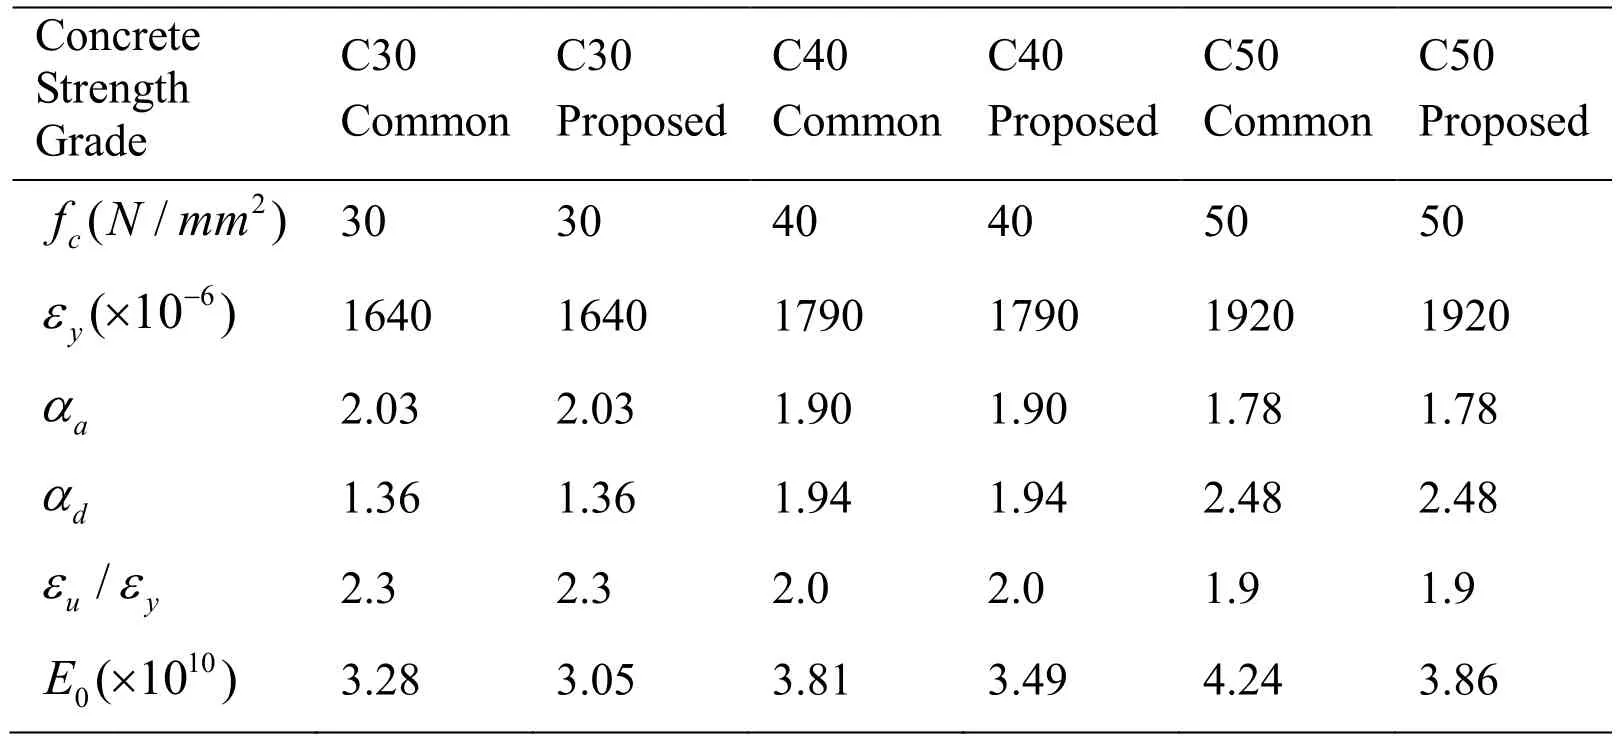
Table 3: Parameter values of the stress-strain curves of concrete under uniaxial compression
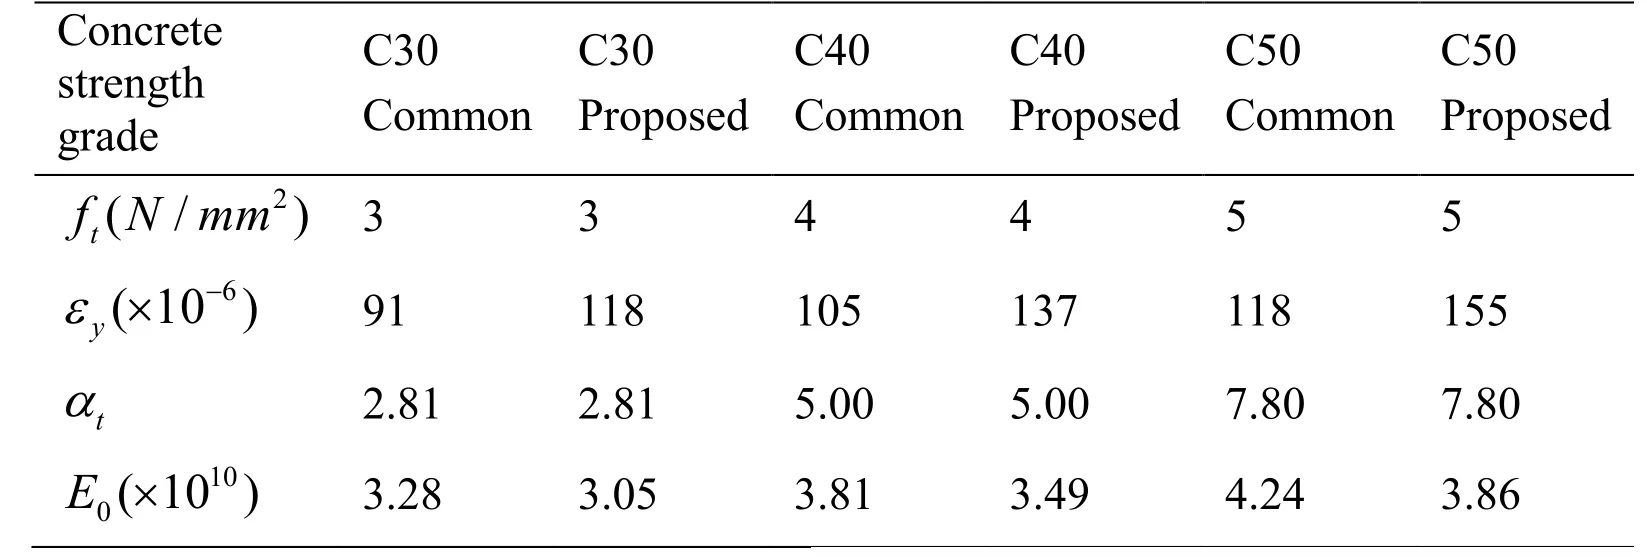
Table 4: Parameter values of the stress-strain curves of concrete under uniaxial tension
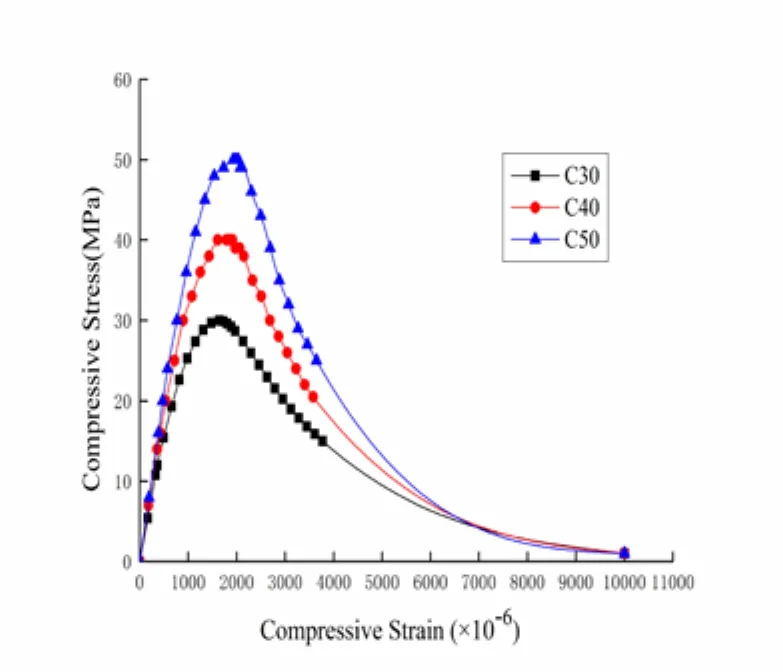
Figure 10: Commonly used curve
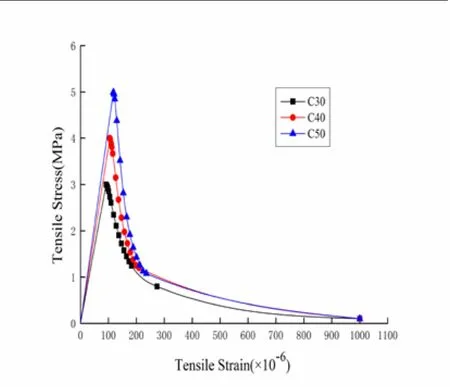
Figure 11: Commonly used curve
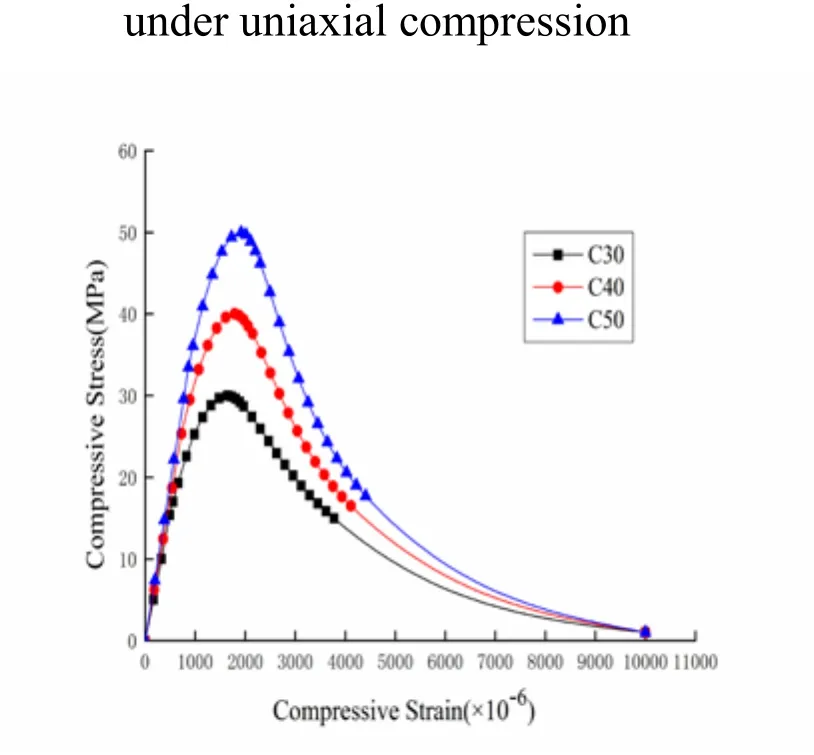
Figure 12: Proposed curve under uniaxial compression
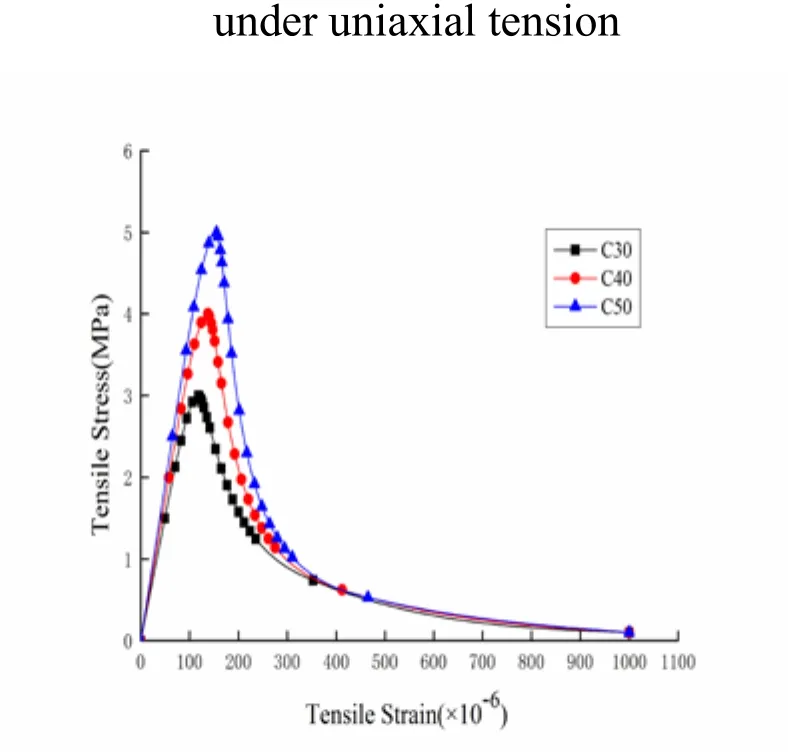
Figure 13: Proposed curve under uniaxial tension
The elastic strain energy density Wecorresponding to each strain is calculated, and the variation ofWewith strain is analyzed. Fig. 14-17 show that η=We/We0, where We0is the elastic strain energy density corresponding to x=1 (point A).
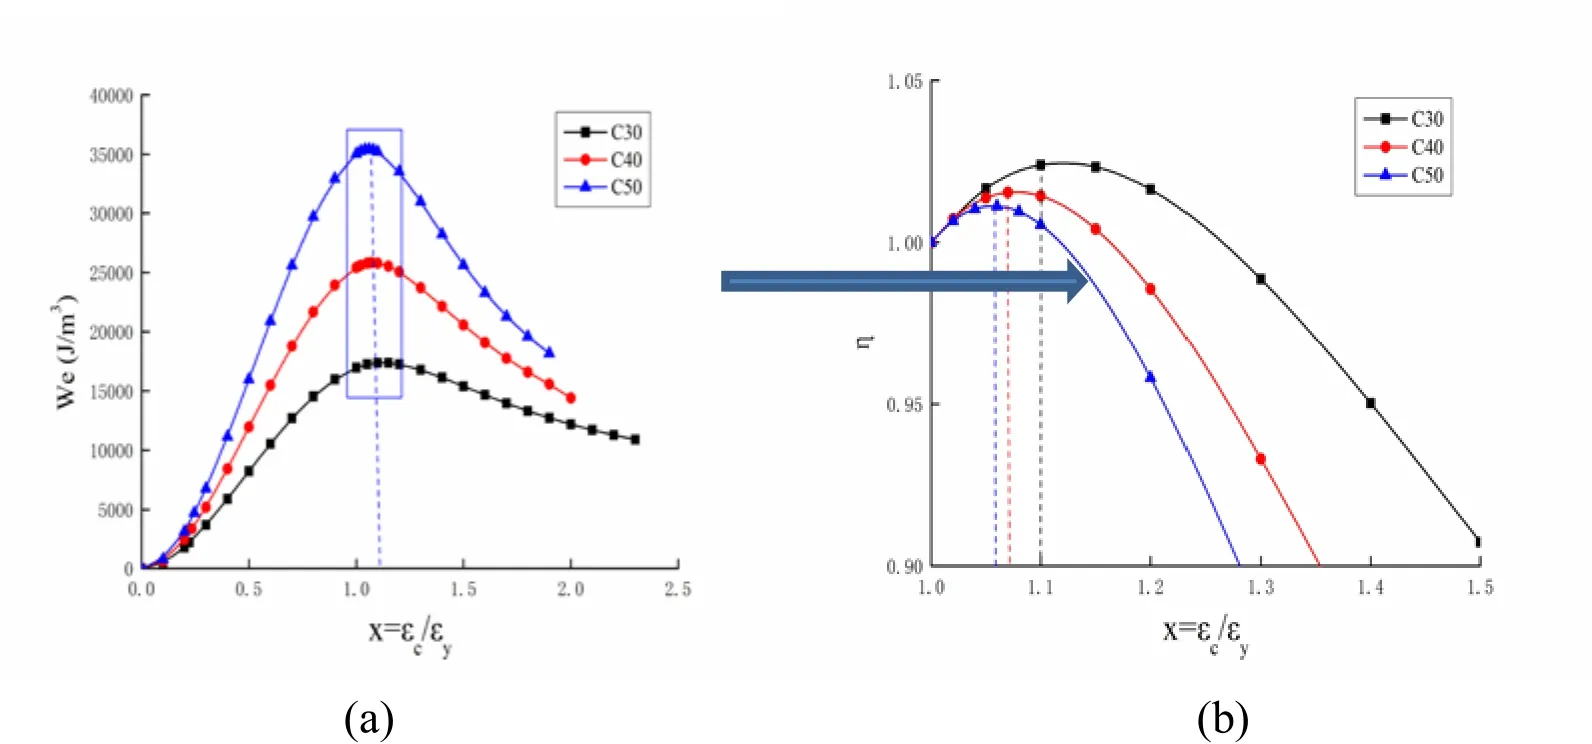
Figure 14:Weof the commonly used curve under uniaxial compression
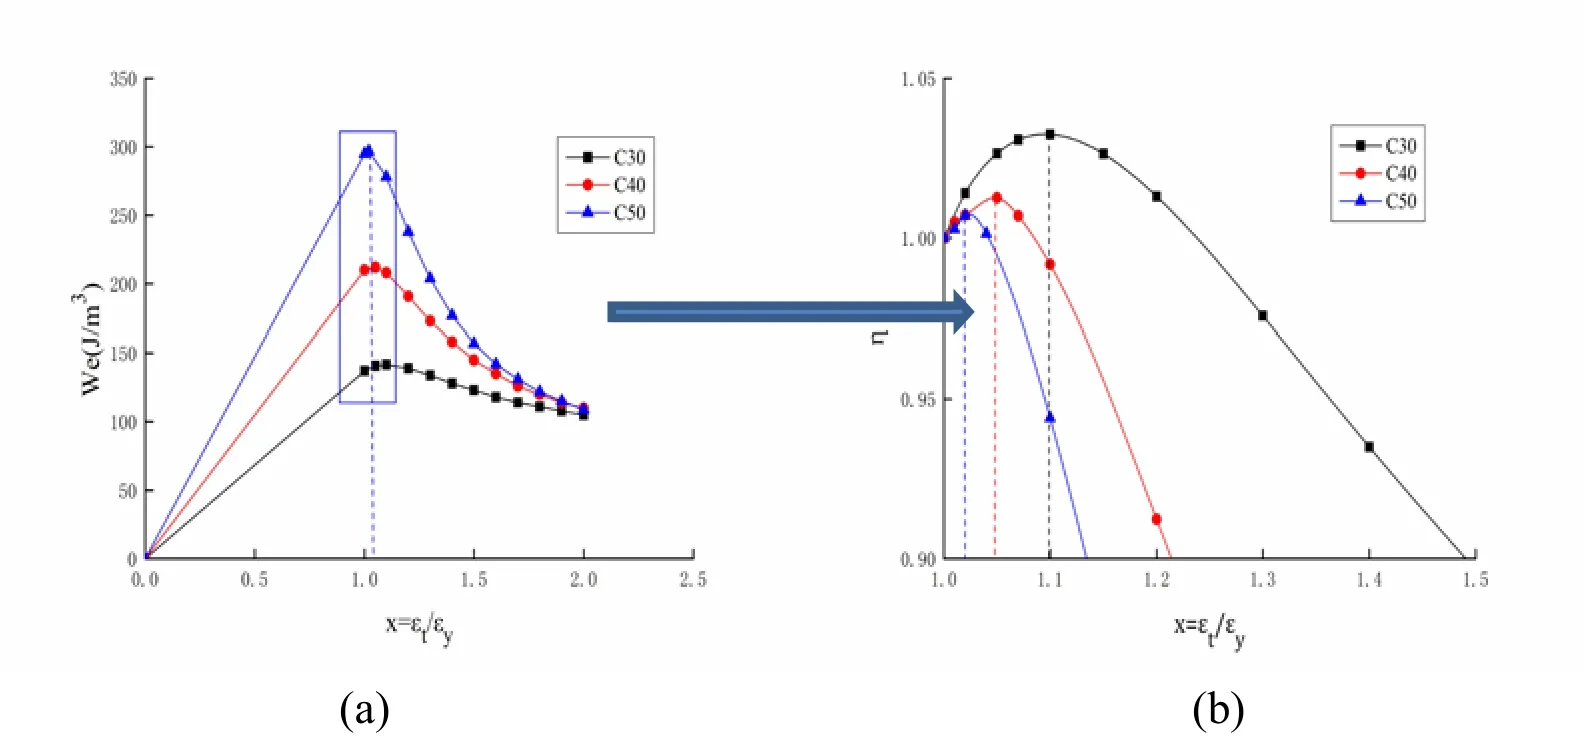
Figure 15:Weof the commonly used curve under uniaxial tension
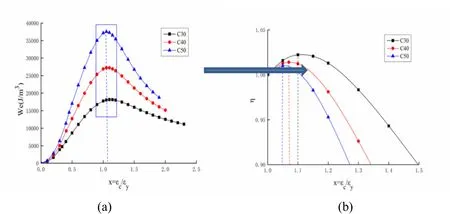
Figure 16:Weof the proposed curve under uniaxial compression
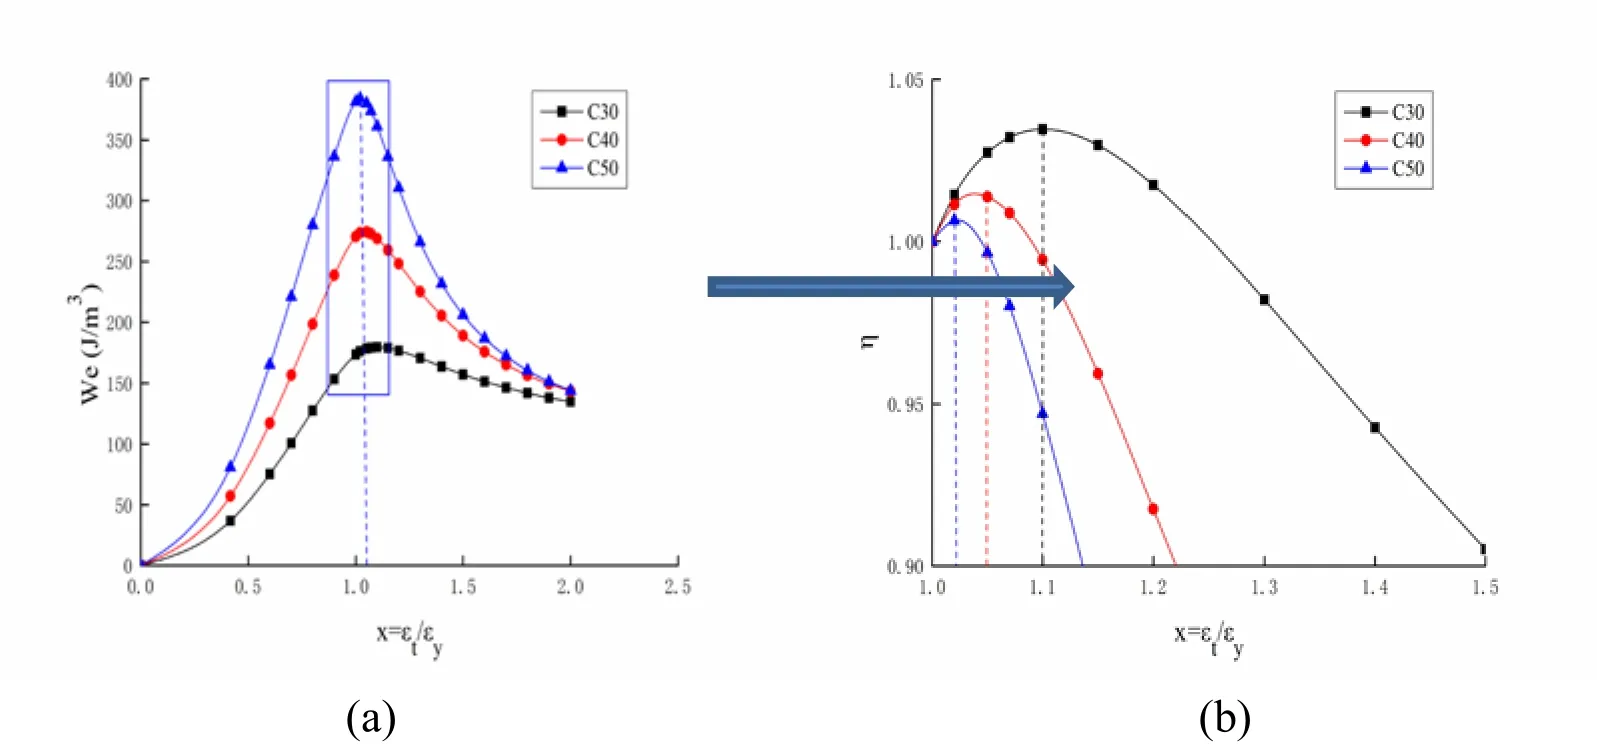
Figure 17:Weof the proposed curve under uniaxial tension
The black, red, and blue dotted lines in Fig. 14-17 indicate the location of the maximum elastic strain energy densities (point B) of C30, C40, and C50, respectively. In these figures, point B is on the post-peak softening curve. The proposed and commonly used curves show the same trends and reach their maximum on the same location. The locations of the maximum elastic strain energy densities (point B) of C30, C40, and C50 are x=1.1, x=1.07, and x=1.05 under uniaxial compression, respectively, and x=1.1,x=1.05, and x=1.02 under uniaxial tension, respectively. Therefore, the elastic strain energy density criterion is suitable for concrete with cement grades of C30, C40, and C50, and the maximum elastic strain energy density (point B) approaches the peak stress point as the concrete strength grade increases.
3.2 The test curve
Following the requirements for testing the compressive strength of concrete cubes as prescribed in the Chinese “Test codes for hydraulic concrete” (SL352-2006), the uniaxial compression test uses 150×150×150 mm3cubic standard specimen specimens and the loading speed is set to 0.3 MPa/s. Tab. 5 shows the concrete mix proportion.
A WAW-E2000 electro-hydraulic servo universal tester with a range of 40 kN to 2000 kN and a 1% accuracy is used as the test loading system. The image acquisition system for the strain measurement uses a high-resolution industrial camera of 1280×1024 pixels from Italian Point Grey’s production with a megapixel optical lens from American Cypress’s production.

Table 5: Concrete mix proportion
Two groups of test data are selected for the test. These data follow the principle of having more points near the peak point (point A) as illustrated in Fig. 18 and 19.
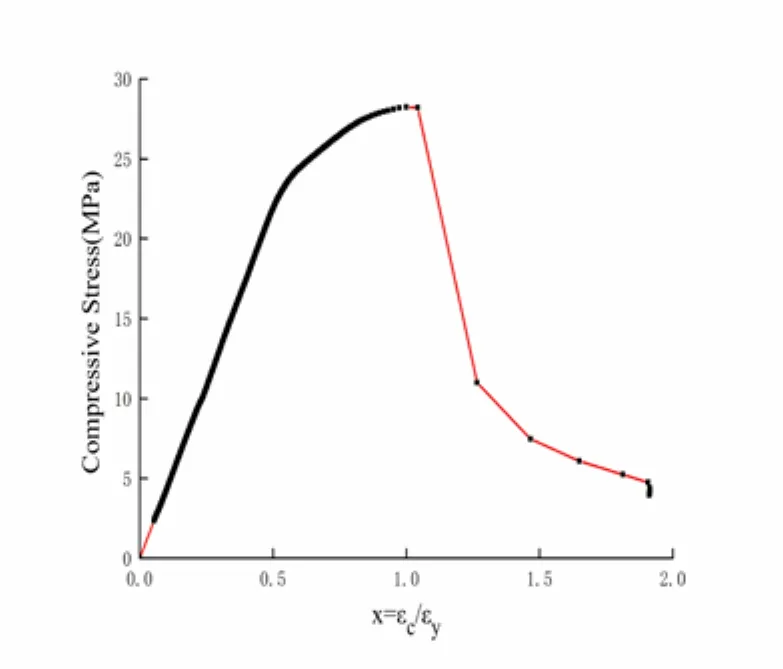
Figure 18: Stress-strain curve of Test 1
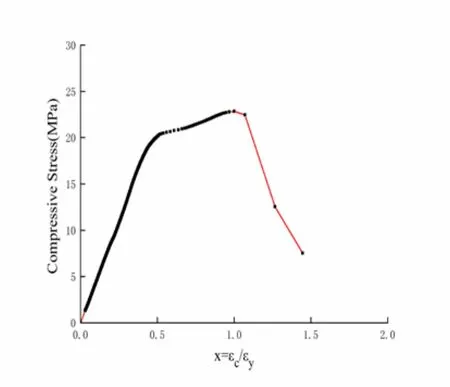
Figure 19: Stress-strain curve of Test 2
The elastic strain energy density Wecorresponding to each strain is calculated, and the variation ofWewith strain is analyzed. The results are shown in Fig. 20 and 21.
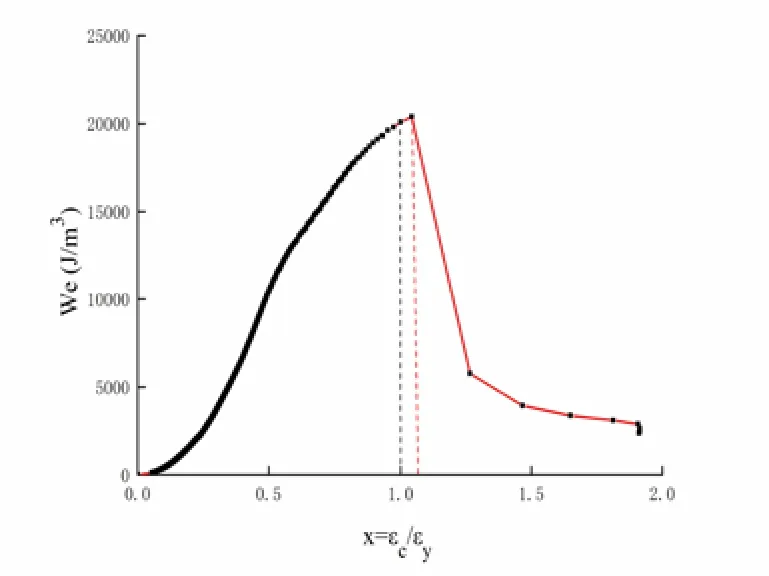
Figure 20:We-strain curve of Test 1
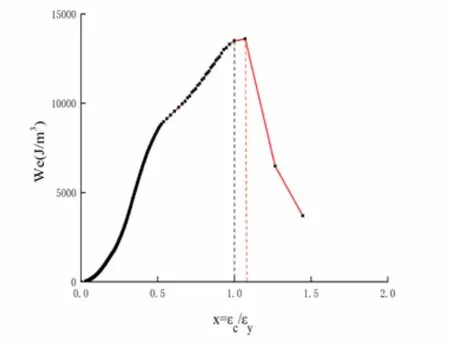
Figure 21:We-strain curve of Test 2
The red dotted lines in Fig. 20 and 21 indicate the location of the maximum elastic strain energy density (point B), which is x=1.04 in Test 1 and x=1.07 in Test 2.Meanwhile, the black dotted lines indicate the location of the peak stress point (point A). Similar to the results for the standard curve, the black dotted lines show that point B is at the post-peak softening stage and is positioned on the right side of point A (x=1).
3.3 The numerical simulation curve
A 100×100×100 mm3cube is used as the concrete specimen, and a spherical aggregate model that uses the take-and-place method for aggregate arrangements is used. The model comprises three parts, namely, the cement mortar, aggregate, and ITZ, and has an aggregate volume fraction of 40%. The numerical simulation parameters are shown in Tab. 6.
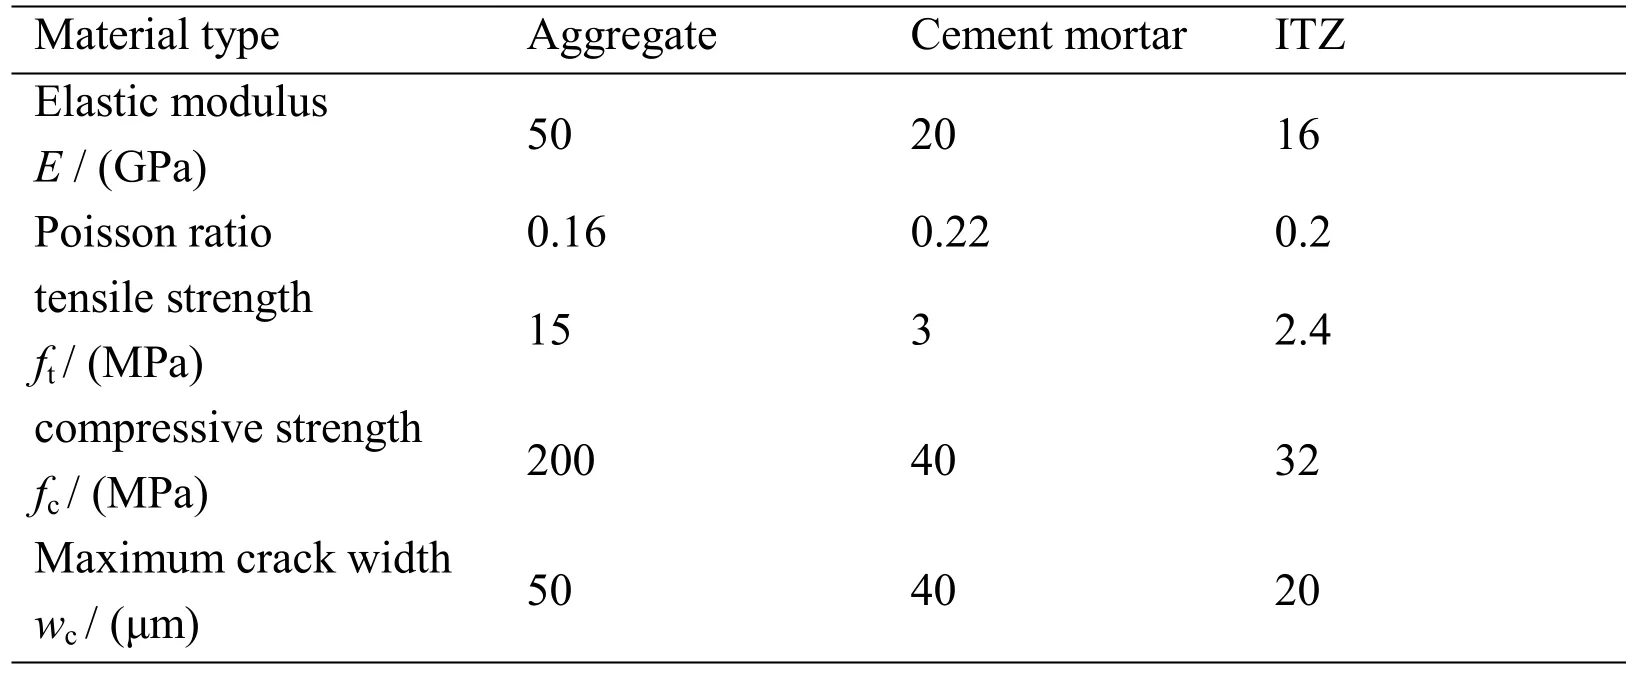
Table 6: Numerical simulation parameters
Fig. 22 and 23 show two groups of stress-strain curves obtained via micromechanical simulation. The elastic strain energy densityWecorresponding to each strain is calculated, and the variation ofWewith strain is analyzed. The results are shown in Fig. 24 and 25.
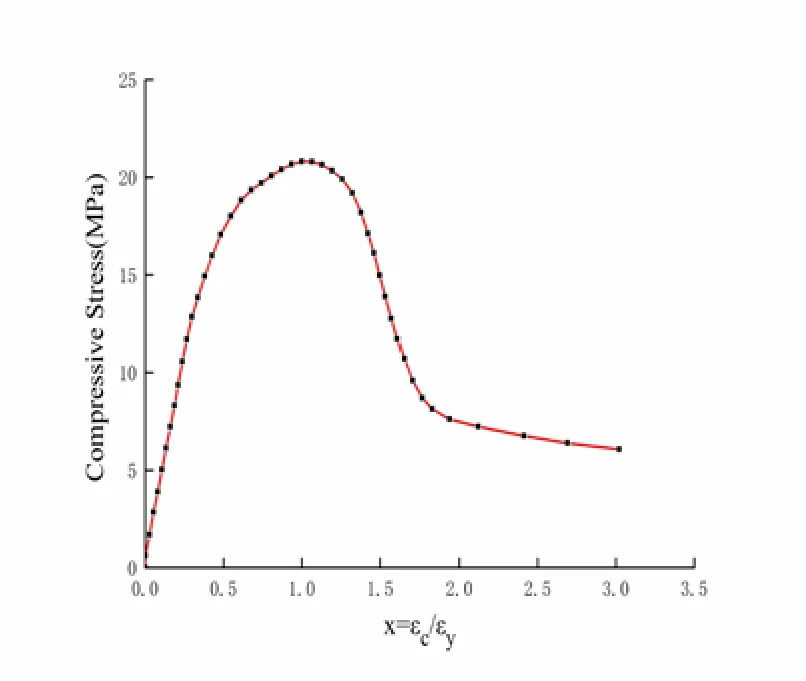
Figure 22: Stress-strain curve in simulation 1

Figure 23: Stress-strain curve in simulation 2
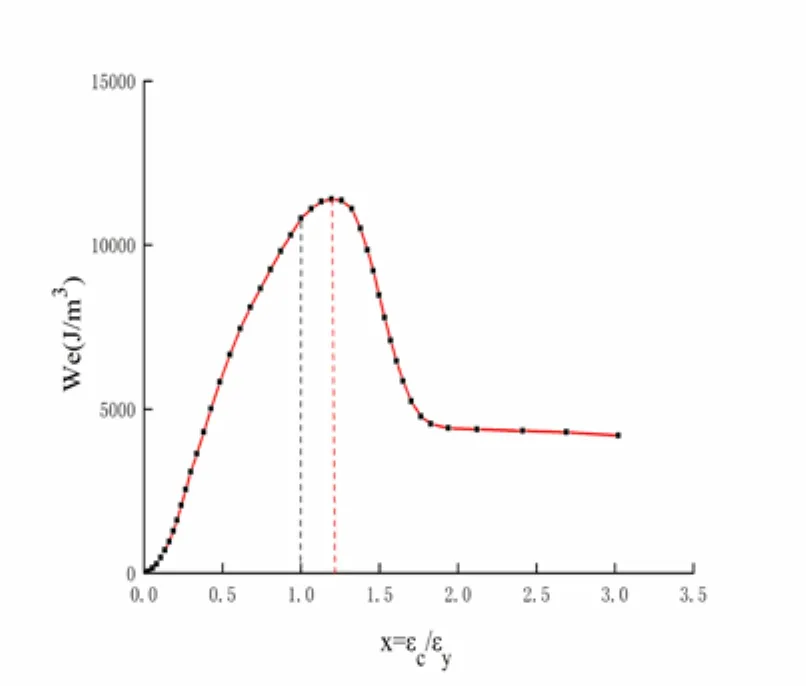
Figure 24:We-strain curve in simulation 1
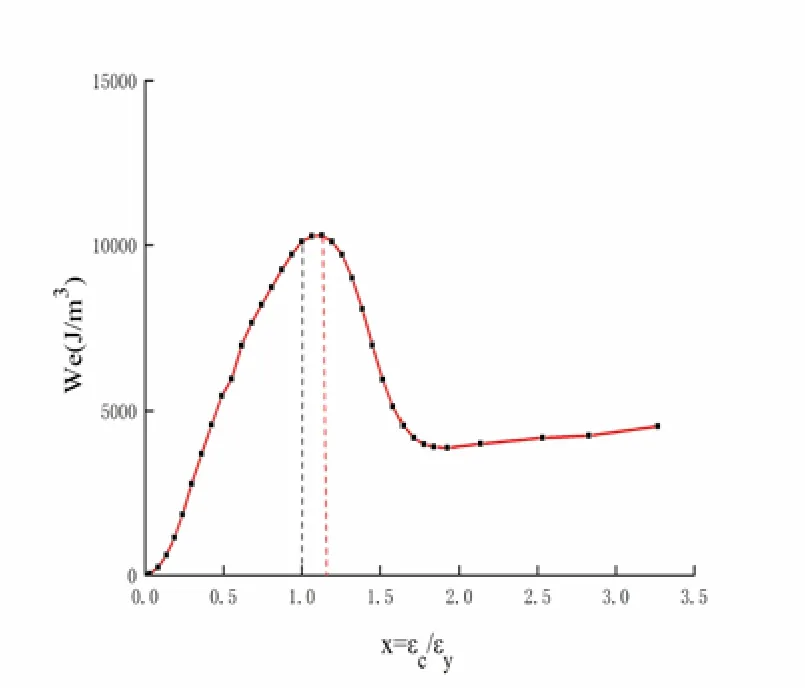
Figure 25:We-strain curve in simulation 2
The red dotted lines in Fig. 24 and 25 indicate the location of the maximum elastic strain energy density (point B), which is x=1.19 in simulation 1 and x=1.13 in simulation 2. Meanwhile, the black dotted lines indicate the location of the peak stress point (point A). Similar to the results for the standard curve, the black dotted lines show that point B is on the post-peak softening curve and is positioned on the right side of point A (x=1).
4 Discussion
The above results verify that the maximum elastic strain energy density (point B) is located on the right side of the peak stress point (point A) when considering the post-peak softening segment of constitutive relation and the degradation of stiffness.
Therefore, point B is at the post-peak softening stage. Such hysteresis phenomenon,which was also mentioned in Dang [Dang,Fang and Ding (2015)], reflects the experimental phenomena mentioned in section 2.2. When the strain exceeds point B,the elastic strain energy density is reduced and the energy is released due to cracking.Through a series of uniaxial compression tests, Guo [Guo (1997)] found that the position of the first visible crack on the specimen surface is x∈[1,1.35]. The position of point B coincides with this interval. Therefore, the elastic strain energy density criterion is suitable for concrete, and point B is the critical point where a macroscopic failure occurs when the elastic strain energy density reaches its maximum.
What causes the hysteresis phenomenon? Ai et al. [Ai,Zhang, Li et al. (2016)]presented schematic diagrams of energy conversion during a rock failure that included type I and type II rock failure behavior, and the concrete failure is similar to type I rock failure behavior. As shown in Fig. 26, for concrete failure behavior, the post-peak modulus M (M= d σ/dε) is negative, which means that the elastic energy accumulated in concrete is not sufficient to maintain the entire fracture process (the red area is smaller than the purple area). Loading must continue to generate additional energy for concrete failure to occur (the area indicated by the blue dotted line in the diagram), and this observation may explain the aforementioned hysteresis phenomenon.An increase in concrete strength grade increases the absolute value of the gradient of the AB segment, decreases the area indicated by the blue dotted line in the diagram,and reduces the distance between the failure point B and peak stress point A. These results coincide with those presented in Fig. 14-17.
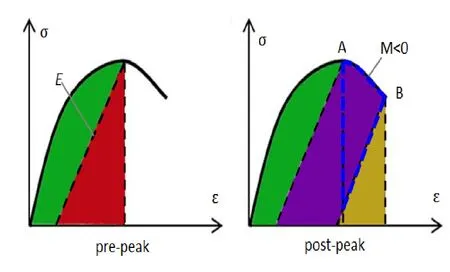
Figure 26: Schematic diagrams of energy conversion during concrete failure
5 Energy change in the structural failure process
5.1 Elastic strain energy criterion
The elastic strain energy criterion is based on the elastic strain energy density criterion.According to this criterion, the unit will break when the elastic strain energy released in the concrete unit reaches the required surface energy to failure, and a structural failure will occur when a certain number of units are destroyed. Therefore, the elastic strain energy reaches its maximum in the limit equilibrium state.
5.2 Computational model
The overflow section of the Long Xi-Kou Dam is selected as the research object. The model meshes are shown in Fig. 27-29. The dam foundation has no weak intercalated layer, and a thin layer element is placed on the dam foundation surface to simulate sliding failure. This dam uses the concrete damaged plastic model in ABAQUS, its foundation uses the D-P strength criterion, and its anti-sliding stability is analyzed by using the strength reduction method.

Figure 27: Whole mesh
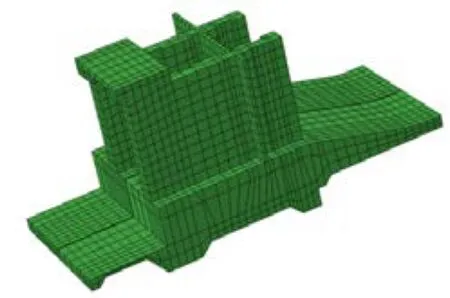
Figure 28: Dam mesh
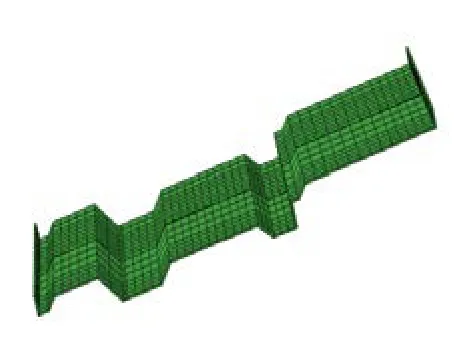
Figure 29: Thin layer element mesh
5.3 Conventional criteria in engineering
5.3.1 Convergence criterion
During the strength reduction process, the geological parameters of the foundation are reduced and the loads are kept unchanged. The non-convergence reduction factor is taken as the safety storage of dam deformation and failure until the calculation could not converge. When the reduction factor increases to 9, the iterative calculation of the structure does not converge in the simulation.
5.3.2 Development of the plastic zone
By using the CDP model to conduct a numerical simulation, the plastic strain and plastic zone in the dam foundation are developed along with an increasing reduction factor. A stability analysis is performed according to the range of the plastic zone and its connected state. The corresponding equivalent plastic strain zone with the reduction factor is developed as follows.

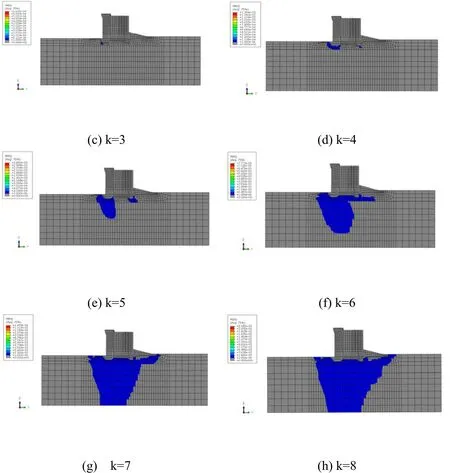
Figure 30: Development of the plastic zone with the reduction factor k
Fig. 30 (a)-(h) show that the equivalent plastic strain zone links up whenk≥6and does not link up whenk≤5. Therefore, the anti-sliding stability safety factor is 6 when the concrete gravity dam reaches its ultimate limit state. A connected plastic zone is a necessary yet insufficient condition for failure. The successful development of a plastic zone also greatly depends on a large, unlimited development of plastic deformation and displacement. Therefore, the results of this criterion show subjective arbitrariness.
5.3.3 Displacement catastrophe criterion
The catastrophe criterion judges the deformation instability of a structure based on the feature in which the displacement changing rate suddenly increases at key parts. In this paper, the feature point of the dam crest is chosen to analyze the relationship between displacement and reduction factor as shown in Fig. 31.
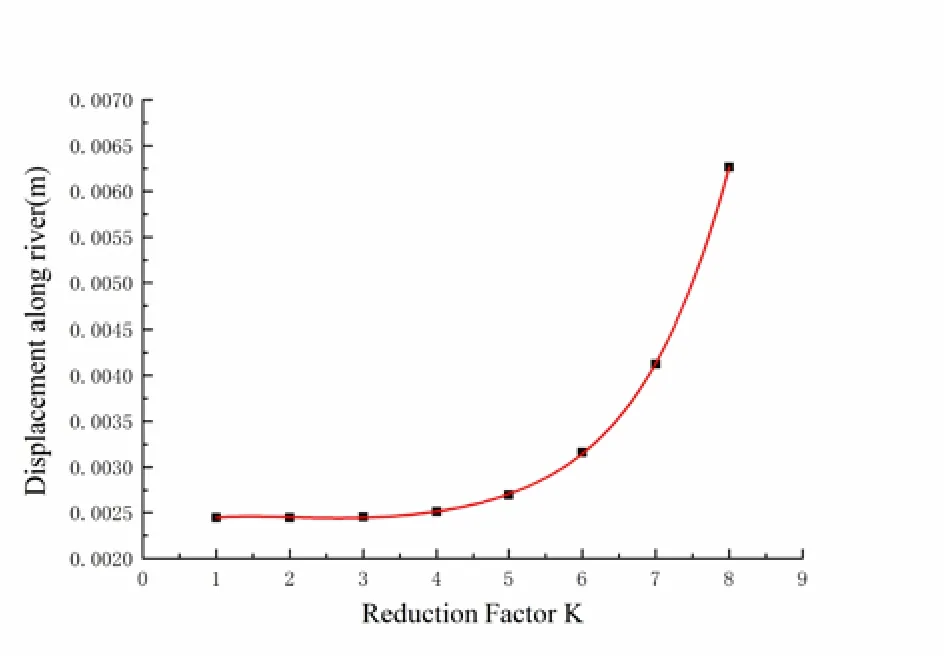
Figure 31: Curve of displacement and reduction factor K
Fig. 31 shows that the displacement catastrophe is not obvious enough. Therefore, the safety factor when the concrete gravity dam reaches its ultimate limit state is estimated to be about 7 according to experience. This safety factor reflects the limitation of the displacement catastrophe criterion. Different researchers will obtain different values if the displacement catastrophe is not obvious, and the value of safety factor also shows subjective arbitrariness.
5.4 Elastic strain energy criterion
The elastic strain energy criterion is used to analyze the structural failure of dams. The elastic strain energy change of the thin layer of a dam foundation surface during the strength reduction process is shown in Fig. 32.
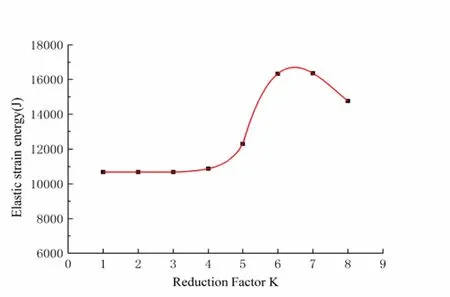
Figure 32: Curve of elastic strain energy and reduction factor K
According to the shape of the curve in Fig. 30, when the reduction factor is k≤4, the elastic strain energy has a very small growth rate, while the dam and the dam foundation are almost in the elastic stage. These findings are also verified in Figs. 30 (a)to (d). The elastic strain energy sharply increases when4<k≤6, and an increasing number of elements enters the plastic stage as shown in Fig. 30 (e). When6<k<7,the curve of the elastic strain energy and reduction factor K shows an inflection point,the reduction factor k is about 6.5 when the concrete gravity dam reaches its ultimate limit state, and the elastic strain energy reaches its maximum. Therefore, the anti-sliding stability safety factor is 6.5. Whenk>6.5, the elastic strain energy stops increasing and starts decreasing. This finding contradicts those presented in Chen et al.[Chen, Gu, Bao et al. (2016)], in which the elastic strain energy increases all the time,as well as reflects the stress state of the thin layer elements on the dam foundation surface over the failure point (point B), which could lead to a reduction in elastic strain energy.
6 Conclusion
a) A modified curve is proposed in this work and is deemed more reasonable compared with extant curves because εy(the strain corresponding to peak stress ft) is equal to the standard suggested value and the damage of the peak stress point is not equal to zero. The proposed and commonly used curves show the same trends and reach their maximum at the same position.
b) The maximum elastic strain energy density is located on the post-peak softening curve, which in turn is placed on the right side of peak stress point. The maximum elastic strain energy density approaches the peak stress point as the concrete strength grade increases. Therefore, the elastic strain energy density criterion is suitable for concrete, and the point of the maximum elastic strain energy density can be used to judge whether the first visible crack occurs at the material level.
c) The results of the elastic strain energy criterion are verified and are consistent with those obtained by using conventional criteria in engineering. Elastic strain energy is reversible unlike other energy, such as dissipation energy. In the whole strength reduction process, the elastic strain energy initially increases and then decreases,and the curve of the elastic strain energy and reduction factor k must have an inflection point that is objective and able to avoid subjective arbitrariness. Thus, the elastic strain energy criterion is suitable for engineering failure analysis at the structure level.
d) Elastic strain energy is a global scalar, while displacement is a local vector.Therefore, elastic strain energy is better to describe the whole structure. The elastic strain energy criterion avoids the problem of complicated stress field analysis around the crack tip as well as provides a new method for analyzing the stability of a gravity dam.
Acknowledgement: This research was supported by The National Natural Science Foundation of China (No. 51739006, 11132003).
Ayatollahi, M. R.; Sedighiani, K. Mode I fracture initiation in limestone by strain energy density criterion. Theoretical & Applied Fracture Mechanics, vol. 57, pp. 14-18.
Ai, C.; Zhang, J.; Li, Y. W.; Zeng, J.; Yang, X. L. et al. (2016): Estimation criteria for rock brittleness based on energy analysis during the rupturing process. Rock Mechanics & Rock Engineering, vol. 49, pp. 4681-4698.
Birtel, V.; Mark, P. (2006): Parameterised finite element modelling of RC beam shear failure. ABAQUS Users’ Conference, pp. 95-108.
Bresler, B.; Pister, K. S. (1958): Strength of concrete under combined stresses. Aci Structural Journal, vol. 1, pp. 41-56.
Chongshi, G.; Dong, Q.; Zhanchao, L.; Xueqin, Z. (2013): Study on semi-parametric statistical model of safety monitoring of cracks in concrete dams. Mathematical Problems in Engineering, pp. 831-842.
Chen, B.; Gu, C. S.; Bao, T. F.; Wu, B. B.; Su, H. Z. (2016): Failure analysis method of concrete arch dam based on elastic strain energy criterion. Engineering Failure Analysis, vol. 60, pp. 363-373.
Dang, F.; Fang, J.; Ding, W. (2015): Fractal comparison research of fracture of concrete samples under static and dynamic uniaxial tensile using CT. Chinese Journal of Rock Mechanics & Engineering, vol. 34, pp. 2922-2928.
Dawson, E. M.; Roth, W. H.; Drescher, A. (1999): Slope stability analysis by strength reduction. Geotechnique, vol. 49, pp. 835-840.
Guo, Z. (1997): Strength and deformation of concrete: Experimental basis and constitutive relation. Tsinghua University Press.
Griffiths, D. V.; Lane, P. A. (1999): Slope stability analysis by finite elements.Geotechnique, vol. 49, pp. 387-403.
Guo, Z.; Wang, C. (1991): Investigation of strength and failure criterion of concrete under multi-axial stresses. China Civil Engineering Journal, vol. 24, pp. 1-14.
Hsieh, S.; Chen, W. F.; Ting, E. C. (1979): An elastic-fracture model for concrete.Engineering Mechanics: ASCE, pp. 437-440.
Lee, J. H.; Fenves, G. L. (1998): Plastic-damage model for cyclic loading of concrete structures. Journal of Engineering Mechanics, vol. 124, pp. 892-900.
Lin, P.; Ma, T. H.; Liang, Z. Z.; Tang, C. A.; Wang, R. K. (2014): Failure and overall stability analysis on high arch dam based on DFPA code. Engineering Failure Analysis,vol. 45, pp. 164-184.
Lubliner, J.; Oliver, J.; Oller, S.; Onate, E. (1989): A plastic-damage model for concrete. International Journal of Solids & Structures, vol. 25, pp. 299-326.
Li, J.; Ren, X. D. (2009): Stochastic damage model for concrete based on energy equivalent strain. International Journal of Solids & Structures, vol. 46, pp. 2407-2419.
Matsui, T.; San, K. C. (1992): Finite element slope stability analysis by shear strength reduction technique. Soils Found, vol. 32, pp. 59-70.
Ottosen, N. S. (1977): A failure criterion for concrete. American Society of Civil Engineers Engineering Mechanics Division Journal, vol. 103, pp. 527-535.
Podgórski, J. (1985): General failure criterion for isotropic media. Journal of engineering mechanics, vol. 111, pp. 188-201.
Ren, Q. W.; Jiang, Y. Z. (2011): Ultimate bearing capacity of concrete dam involved in geometric and material nonlinearity. Science China Technological Sciences, vol. 54,pp. 509-515.
Ren, Q. W.; Xu, L. Y.; Wan, Y. H. (2007): Research advance in safety analysis methods for high concrete dam. Science China Technological Sciences, vol. 50, pp.62-78.
Sih, G. (1973): Some basic problems in fracture mechanics and new concepts.Engineering fracture mechanics, vol. 5, pp. 365-377.
Teng, S.; Liu, Y.; Lim, T. Y. D. (2014): Determination of fracture energy of ultra high strength concrete. Engineering Fracture Mechanics, vol. 131, pp. 602-615.
Tu, Y. L.; Liu, X. R.; Zhong, Z. L.; Li, Y. Y. (2016): New criteria for defining slope failure using the strength reduction method. Engineering Geology, vol. 212, pp. 63-71.
Tarasov, B.; Potvin, Y. (2013): Universal criteria for rock brittleness estimation under triaxial compression. International Journal of Rock Mechanics & Mining Sciences, vol.59, pp. 57-69.
WILLAM, K. J. (1975): Constitutive model for the triaxial behavior of concrete.International association for bridge and structural engineering proceedings. vol. 19, pp.1-30.
Xie, H.; Ju, Y.; Li, L. (2005): Criteria for strength and structural failure of rocks based on energy dissipation and energy release principles. Chinese Journal of Rock Mechanics and Engineering, vol. 24, pp. 3003-3010.
Yu, M. H. (2004): Unified Strength Theory. Springer, pp. 129-173.
Yupu, S.; Guofan, Z.; Fang, P.; Beilei, H. (1996): General failure criterion for different concrete materials under multiaxial stresses. China Civil Engineering Journal,vol. 29, pp. 25-32.
Zhang, S. R.; Wang, G. H.; Wang, C.; Pang, B. H.; Du, C. B. (2014): Numerical simulation of failure modes of concrete gravity dams subjected to underwater explosion.Engineering Failure Analysis, vol. 36, pp. 49-64.
Zhou, X. P. (2006): Triaxial compressive behavior of rock with mesoscopic heterogenous behavior: Strain energy density factor approach. Theoretical & Applied Fracture Mechanics, vol. 45, pp. 46-63.
Wu, J. Y.; Li, J.; Faria, R. (2006): An energy release rate-based plastic-damage model for concrete. International Journal of Solids & Structures, vol. 43, pp. 583-612.
Xie, H.; Ju, Y.; Li, L.; Peng, R. (2008): Energy mechanism of deformation and failure of rock masses. Chinese Journal of Rock Mechanics and Engineering, vol. 27, pp.1729-1739.
Xie, H.; Peng, R.; Ju, Y.; Zhou, H. (2005): On energy analysis of rock failure.Chinese Journal of Rock Mechanics and Engineering, vol. 24, pp. 2603-2608.
Xu, S. L.; Zhang, X. F. (2008): Determination of fracture parameters for crack propagation in concrete using an energy approach. Engineering Fracture Mechanics,vol. 75, pp. 4292-4308.
 Computer Modeling In Engineering&Sciences2018年1期
- Computer Modeling In Engineering&Sciences的其它文章
- Complex Modal Analysis for the Time-Variant Dynamical Problem of Rotating Pipe Conveying Fluid
- Despeckling of Ultrasound Images Using Modified Local Statistics Mean Variance Filter
- Numerical Simulation of High Speed Rotating Waterjet Flow Field in a Semi Enclosed Vacuum Chamber
- Stiffness Degradation Characteristics Destructive Testing and Finite-Element Analysis of Prestressed Concrete T-Beam
- A Novel Interacting Multiple-Model Method and Its Application to Moisture Content Prediction of ASP Flooding
