Energy Effcient Modelling of a Network
Anish Kumar Saha*, Koj Sambyo, Chandan Tilak Bhunia
Dept. of Computer Science and Engineering, NIT Arunachal Pradesh, India
I. INTRODUCTION
Demands of energy are growing day by day.The demands of energy in developing countries will be higher in the future. A major portion of electrical energy comes from fossil fuel, coals and natural gases. These conventional sources of energy increases the unavoidable future problem termed as “global warming and green house gases”. If we notice statistical data, according to CETE and Bell labs report, the volume of CO2emitted by ICT is near about 830 million tons every year, which is around 2% of the man made emission of the world. It has also projected that the amount of CO2emission will be approximately double in 2020. According to EIA report, fast developing countries like India and China will share half of the world increase power in 2040. One of the key areas where drastically increase power consumption is computer networking,data communication and data centers. Worldwide internet users are 3.17 billion in 2015,which is around 8% growth with respect to users in 2014. Users of internet in 2015 are almost 3 times user in 2005. Bianzino et al.[1] described different types of common strategies in energy efficient networking. These strategies are adaptive link rate, interface proxying, energy aware infrastructure, energy aware application, energy aware routing etc.Hasan et al. [2] described energy efcient cellular networking and they explained different common energy efficient research areas like,improvement in power amplifier, power saving protocol, energy aware cooperative management, management of relay & repeaters,picco/macro/ femto cells, energy aware medium access control etc. They showed different green metrics for measuring the efficiency of a system. Other than these, huge amount of energy is consuming in famous giant data centers. Data centers are generally less energy efcient. Data centers mostly consume power due to cooling and redundancy in network resources. According to DCE industry census 2013, globally data centers power demands increased more 19% from 2011 to 2012. The total energy consumption of global data centers is around 38GW, which is 316% higher figure from 12GW in 2007. Power usages effectiveness (PUE) of large data centers is nearly between 1.2-1.6. However, the PUE of medium and small size private organizations vary from 1.7 to 3.0, which is not a goodgure for efficient energy management system.Different approaches of energy efficient data centers are nano data centers, dynamic workload consolidation, sleeping scheduling, CPU frequency adjustment, lazy capacity provisioning etc [3-6]. Other than, for controlling resources andow rule modication, updated topology is important for any network. Saha et al. [15] showed how tond topology, loops in network. They briey explained link failure identication & recovery in software dened networking (SDN). Bruce Lowekamp et al.[16] proposed algorithm for topology discovery using SNBP MIBs information contents in large size bridged Ethernet network.
Networking devices are not fully energy proportional with respect to use. Power consumption has both static and dynamic consumption. One of the examples of dynamic consumption is data rate change. Change in data rate reduces additional power consumption in forwarding nodes. In this paper,different models are proposed. These models focus on minimum topology for allows under current situations. Here data rate change with enable/disable of edges is applied. These mathematical models are mixed integer linear programming optimization problems in nature.These models are explained with examples.
II. RELATED WORKS
L. Zhou et al. [18] investigated two properties namely, energy efciency and spectrum efciency in handheld mobile devices during video streaming. They combined both two parameters and proposed joint parameter algorithm. They showed the relationship between them and explained that these parameters could integrate in an energy efficient model in mobile Ad Hoc network. Liang Zhou [19]proposed sharing of same video contents in nearby mobile devices without re transmission to different devices from base station. Their method was decentralised approach and did not require any further central controller. Here,mobility velocity, video file size, communication cost, transmission radius, device and storage capacity was taken as computational parameters for device-to-device and base station-to-device communication. Hui Yang et al. [20] proposed MFVC model, which was multiple flow communication with ability of non-contiguous spectral fragment in a flexigrid optical network. Flows were split into multiple spectral and sent through the physical media using modulation. Resource allocations,guard band, number of splitows, delay constrain were taken as parameters. They showed less blocking probability without affecting other services and explained the design of transponder and control model. H. Yang et al. [21]presented Cross Stratum Optimization (CSO)as elastic data centers in SDN based optical network. The aim of their model was global optimization, QoS and accommodation of data center services under heterogeneous resources condition. H. Yang et al. [22] proposed SUDOI, which was an extension of earlier CSO model in ubiquitous data centre architecture.It managed resources based on blocking probability and resource occupation rate in optical SDN data centers. Their architecture was a multi layer and cross-stratus model from user access perspective. Different controllers were assigned in different network layers that gave hierarchy structure in central control in optical SDN.
Other than, Two types of well knowsows are Elephant flow and mice flow. Elephantows capture healthy amount of bandwidth in a link. Elephant flows, although very limited numbers, capture large capacity. Elephant flows affect the QoS for small sized flows,which are known miceows. Authors [23-26]proposed different techniques for identification of elephantows in a network. Z. Liu et al. [27] proposed effective management of elephantows in data center. Mori et al. [28]investigated the characteristic of aggregation and user trafcs and showed their relationship.They observed that traffic follows positively skewed (non-Gaussian) distributions. In this context, we propose two types of services namely “minimum bandwidth” and “trivialle transfer”.
Proposed Algorithms and mathematical models:
Here four different models are proposed.Each model has different purpose and function. Therst model “Minimum edge” determines the required minimum edges along with their different data rates to support all trafcs.Switch from higher to lower data rate saves
energy consumption in forwarding nodes. For instance, data rate change from 10 Mbps to 1Gbps increases 3W power consumption [1].This model minimizes power consumption by disabling more edges along with other edges to be set in lower data rates.

Table I. Summary of nomenclature.

Minimum edge model
Objective,

Subject to,Path selection

Edge selection for selected path

Rate switch and bandwidth capacity limitation

Edge selection for spanning tree

Spanning tree selection

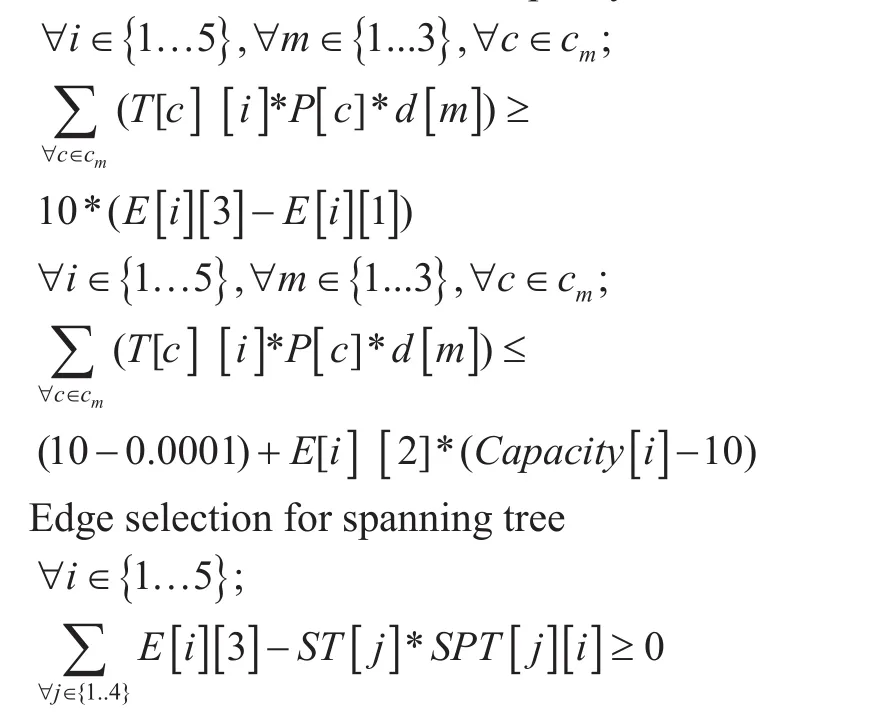
The objective (1) is a minimization function of additional power consumption of edges for their different data rates. The model optimizes in power consumption in edges through enable/disable and data rate change. Here data rate of edges is set in two different values, an intermediate value Θ and maximum capacity rate. It has six constrains. Constrain (2) entitled “Path selection” ensures, for a particular{Source, Destination} communication, only one path will be selected from a list of alternative paths. Constrain (3) entitled “Edge selection” ensures, a particular edge will be enabled if and only if at least one communication passes through this edge. Hence “Path selection”constrain (2) selects path for all communications and based on the selected path “Edge selection” constrain (3) sets the edge status.“Rate switch and bandwidth capacity limitation” constrains (4-5) set data rates for all edges. Constrain (4) sets the value of E[i][3]for lower data rate switch. In constrain (5), a small valueδis deducted from the limit Θ to convert from < to ≤ relation. It also ensures bandwidth limit of edges i.e., at E[i][3]=1 and E[i][2]=1, the sum of all required bandwidth for all communications passes through the edge should not cross its maximum bandwidth capacity limit. The different values of decision variable R are given in Table 02.
Constrain (7) entitled “Spanning tree selection” ensures that at least one spanning tree must maintain from a list of different spanning trees. “Spanning tree selection” constrain is used to maintain connectivity between all forwarding nodes. If we do not use this constrain then the model will give more optimized result but at the same time, some forwarding nodes may disconnected from the network after applying different power saving mode like port up/down, line card enable/disable etc. Constrain (6) ensures that all edges presented in a selected spanning tree should be enabled.

Table II. Different data rates for ith edge.
Minimum delay model
Objective,

Subject to,
Path selection

Edge selection for selected path

Rate switch and bandwidth capacity limitation
Edge Selection for spanning tree

Spanning tree selection

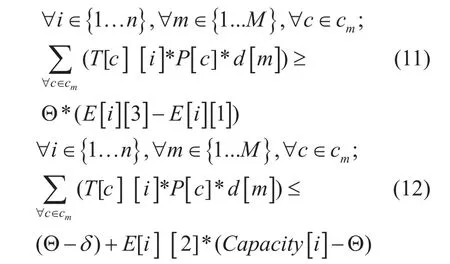
Network delay divides into four classes- processing, queuing, transmission and propagation. First three delays happen at router/switch. Propagation delay depends on media.Generally, more intermediate nodes in the path increases processing and transmission delay. In this regards, the second model entitled as “Minimum delay” considers delay as objective for all communications. Here we consider delay as total number of intermediate forwarding nodes from source to destination.More number of intermediate edges means more delays in a path. This model minimizes the “total delays” for allows. The term “total delay” means sum of all delays for all flows presented in a network. The objective (8) is a minimization function, which minimizes the“total delays” for allows. The model has six constrains. Constrain (9) ensures, selection of only one path from a set of alternative paths for all communications. Constrain (10) ensures that, if anyow passes through an edge then that edge will be enabled. Constrains (11-12) set data rate switch for all edges as well as ensures that bandwidth limit of edges should not cross. Constrains (13-14) ensure that at least one spanning tree must maintain for the network to make connectivity with different forwarding nodes. The model gives more priority in delay than energy saving.
Minimum change model
Objective,
Subject to,
Path selection

Edge selection for selected path

Rate switch and bandwidth capacity limitation
Edge Selection for spanning tree
Spanning tree selection
Sustain earlier topology

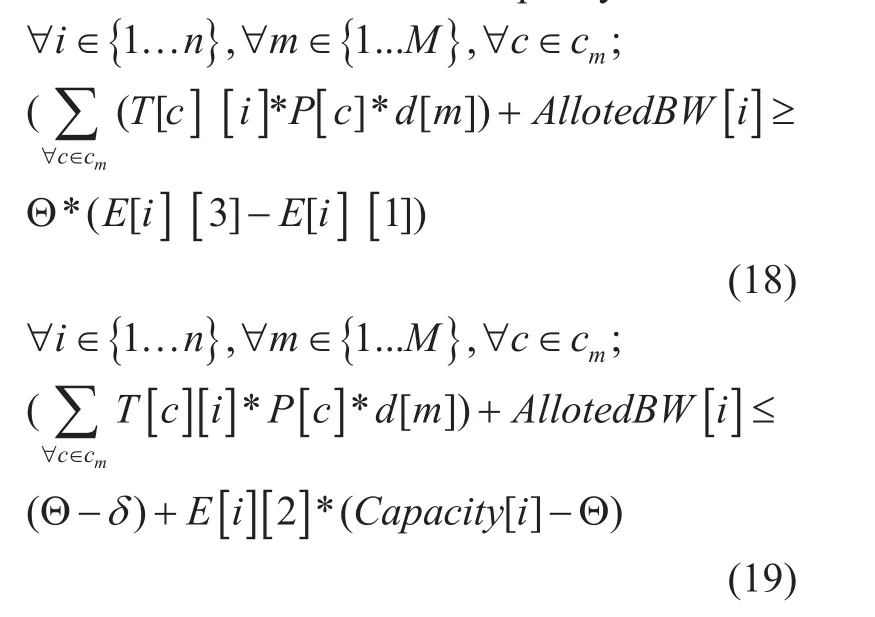
Generally, traffic changes randomly with respect to time and space in a network. It is undesirable to change or modifyow rules for oldows in every switch to cope with current flows for certain purposes. The third model“Minimum change” determines optimal power consumption using rate change & port up/down and at the same time, maintaining the earlier required topology for oldows. Since,earlier required topology is same, so further modification is not needed in old flow rules.The model adjusts new flows with old flows and determines optimal power consumption.The objective (15) is a minimization of additional power consumption in rate change or port up/down. It has total seven constrains.Constrains (16,17,20,21) are same as discussed in Minimum edge model. Since, matrix AllotedBW contains assigned bandwidth for all “minimum bandwidth” type old flows therefore, in constrains (18-19), a part Alloted-BW[i] is added with total bandwidth of current flows for all ithedge. Constrain (22) ensures that earlier enabled edges for old flows must set enable to maintain minimum change.
Multi flow model for “trivial file transfer” service
Objective,

Subject to,
Bandwidth capacity limitation

Maximum allotment of bandwidth for different paths

Here two types of services namely, “minimum bandwidth” and “trivial file transfer”are considered. In “minimum bandwidth”service, all flows must maintain a minimum bandwidth for all communication. First three models are for “minimum bandwidth” type service. However, in the forth model, allows are considered as “trivialle transfer” service.In “trivialle transfer” service, bandwidth and transmission time could vary in these types ofows. Forth model “Multiow” determines to sendles as quickly as possible using multiple flows. After delivering files through multiple flows, resources could be released early and be placed in power saving mode. Here multiple flows are created for a communication.Multi flow model is applied after applying one of the three models as discussed earlier.Resources are assigningrst to all “minimum bandwidth” service, then remaining resources are allowed to assign in “trivialle transfer”service. Here “minimum bandwidth” is giving high priority than “trivialle transfer” service.This is because time and bandwidth in “trivialle transfer” could vary comparing to “minimum bandwidth” service.
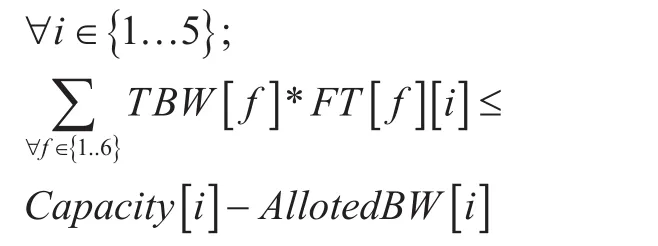
Here the objective (23) is to maximize the allocation of bandwidth for all multipleows for all communications. Constrain (24) entitled “Bandwidth capacity limitation” checks the sum of bandwidth for allows should not cross maximum limit of remaining bandwidth of every edges. Constrain (25) entitled “Maximum allotment of bandwidth for different paths” ensures allocated bandwidth should not cross maximum limit of bandwidth of the path. Suppose for thegure 01, remaining capacity of edges are E1= 5Mbps, E2= 10Mbps,E3= 4 Mbps and if a path contains E1, E2and E3edges, then path limit is minimum(10, 4, 5)Mbps or 4 Mbps. Since, all decision and other variables are real, so it is a simple optimization problem.
An example of minimum edge model is given for the network ingure 1.
The network has the following matrices and data,
• Total number of edges, n=5
•δ=0.0001
• θ=10Mbps
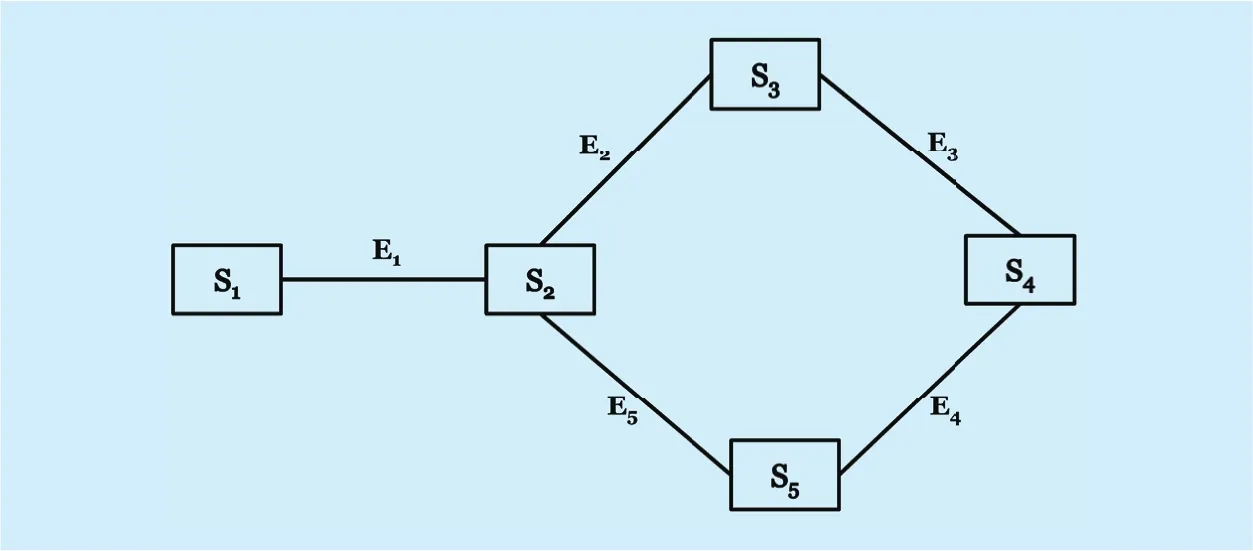
Fig. 1. An example of a network with ve switch and ve edges.
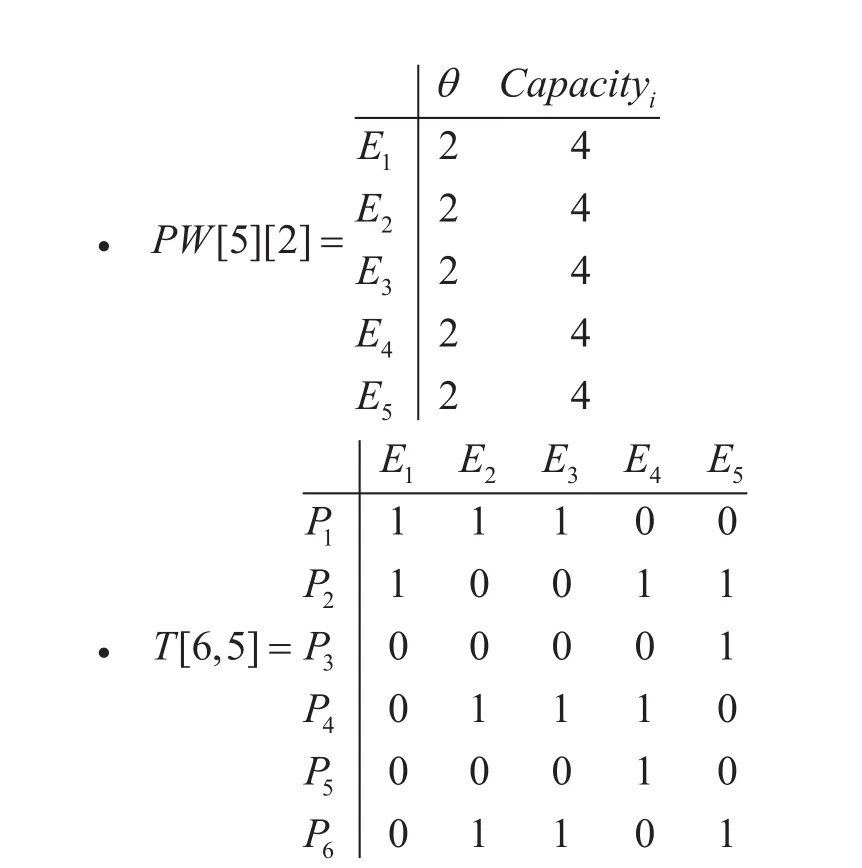
• Three communications are {S1,S4}, {S2,S5}and {S4,S5}
• All alternative paths for {S1,S4}, {S2,S5}and {S4,S5} arec1,c2andc3, and its values are,

Suppose the meaning ofc1={1,2} is,P1andP2are its two alternative paths as shown in the above matrix T.
• Total number of communications, M= 3
• Capacity={100,100, 50,50,50} in Mbps
• Demands for communication,d={500,800,600} in Kbps
• No of spanning trees taken, noSP=4
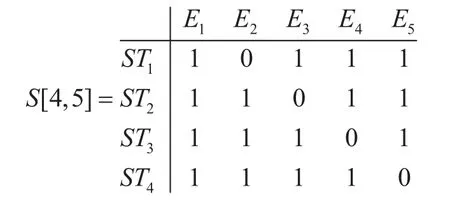
• List if spanning trees (S) are,
Minimum edge model
Objective,

Subject to,
Path selection

Edge selection for selected path

Rate switch and bandwidth capacity limitation
Spanning tree selection

Results:
E1=10, E2=0(Disabled), E3=10, E4=10,E5=10inMbps.
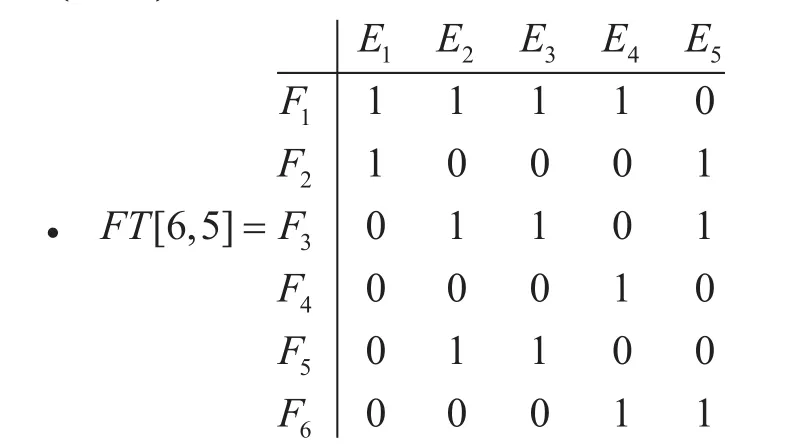
Another example is given for multi flow model for the same network ingure 01.
• AllotedBW={89,80,41,30,35} in Mbps.
• PathLimit={9,11,9,20,9,15} in Mbps
Objective,

Subject to,
Bandwidth capacity limitation
Maximum allotment of bandwidth for different paths

Results: Allotted bandwidths for all sixows are,
TBW1=0, TBW2=11, TBW3=4, TBW4=20,TBW5=5 and TBW6=0 in Mbps
Implementation and Computation time:
The models are MILP problems except multiow. MILP is np-hard in characteristics and takes higher time for computation for large value of inputs. To solve these models,GNU Linear Programming Kit(GLPK) is used. GLPK is an open source for large scale linear, integer, mixed integer programming solver. The proposed models are written in GNU MathProg modelling language.
An illustration of computational time for these methods has shown in Table 03. We have taken simultaneously different 100 and 50{source, destination} numbers of communications in Abilene topology. Total 65 numbers of different spanning trees have taken. Computation time for all models have measured under different numbers of alternative paths = 1, 2,3 and 4, for each {Source, Destination}. In all cases, minimum edge takes highest and multiow model takes lowest time in computation.
Some computational times are higher value, and in those cases, heuristic approach is used to reduce it. Here hybrid Pseudo-cost branching (PC) along with Integer Optimality(MIPgap) 0.05 is taken for reducing the computation time.
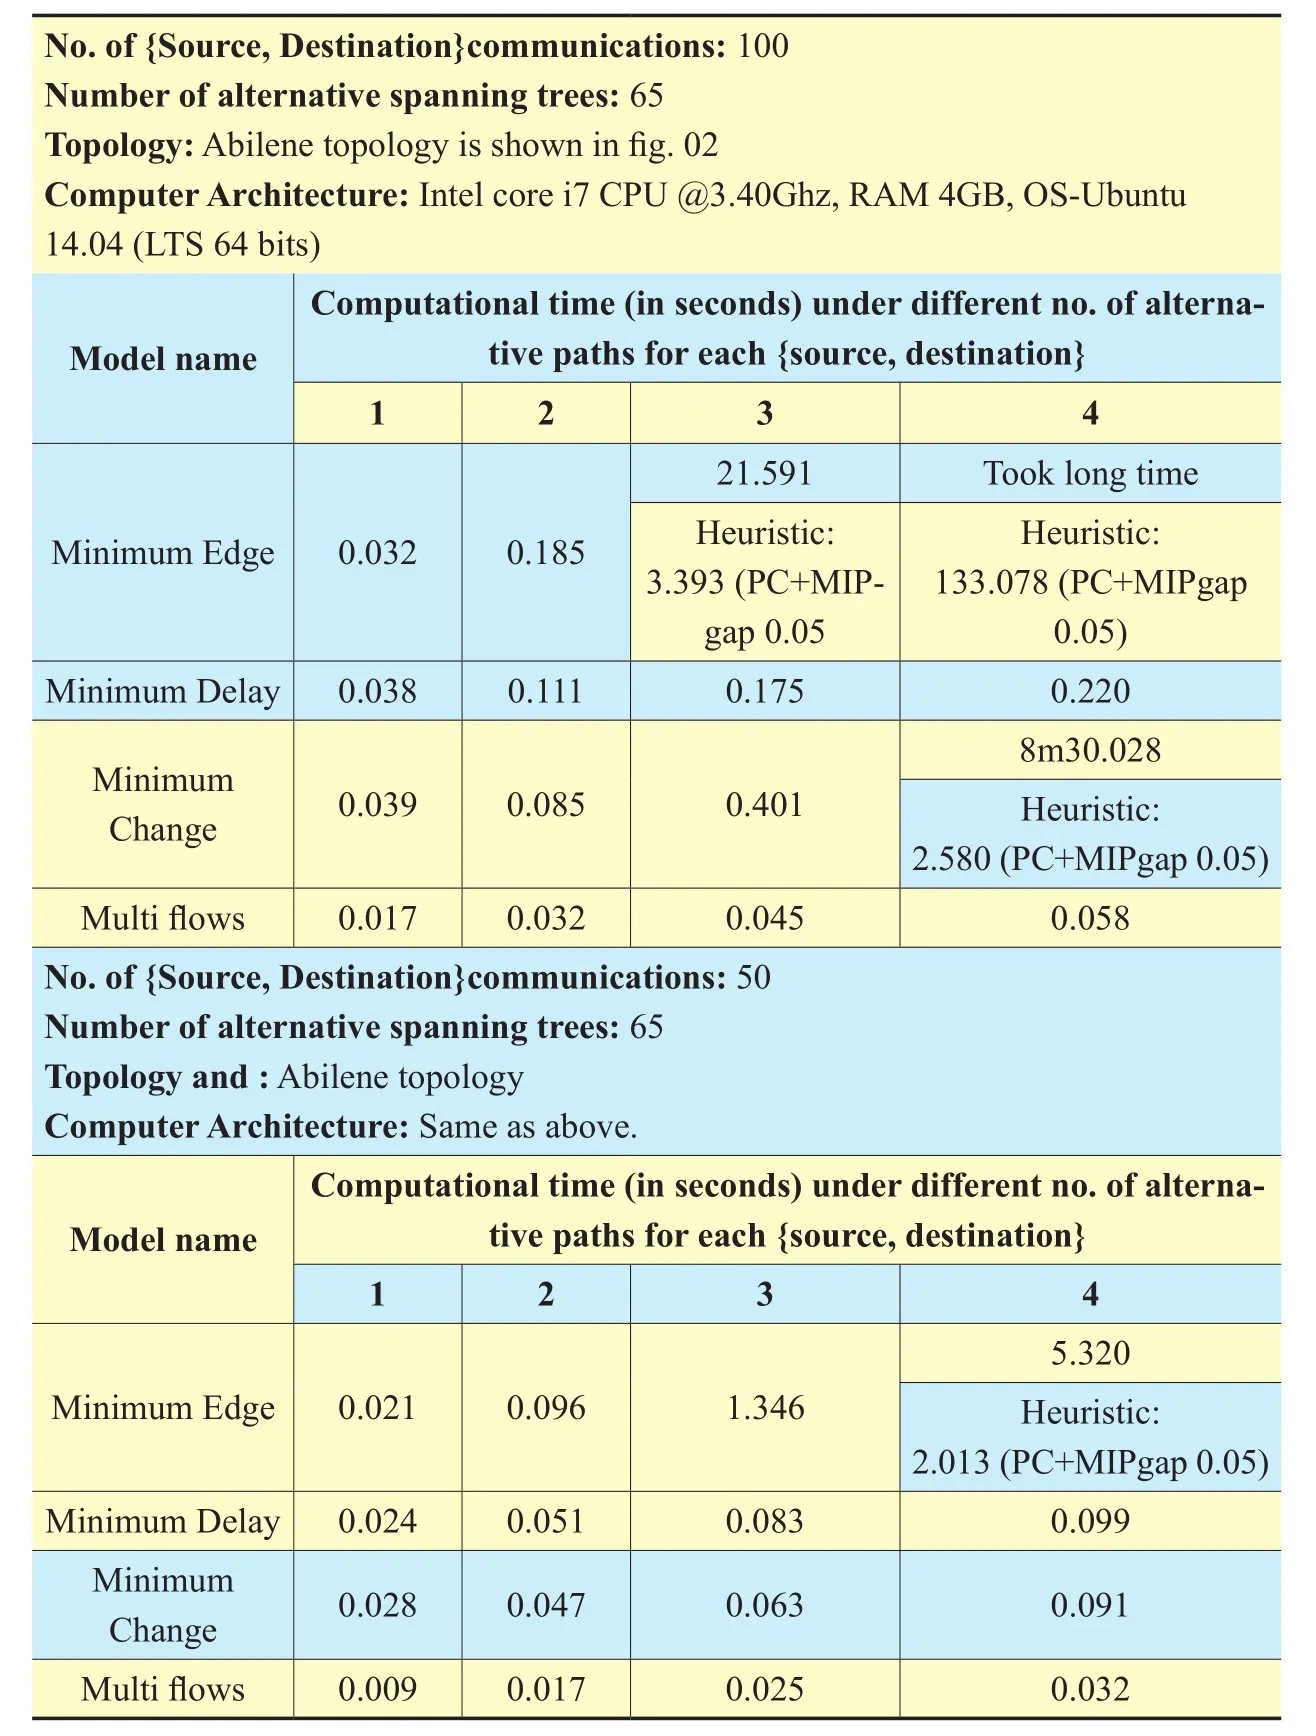
Table III. The computational times for proposed models with variation in number of alternative paths.
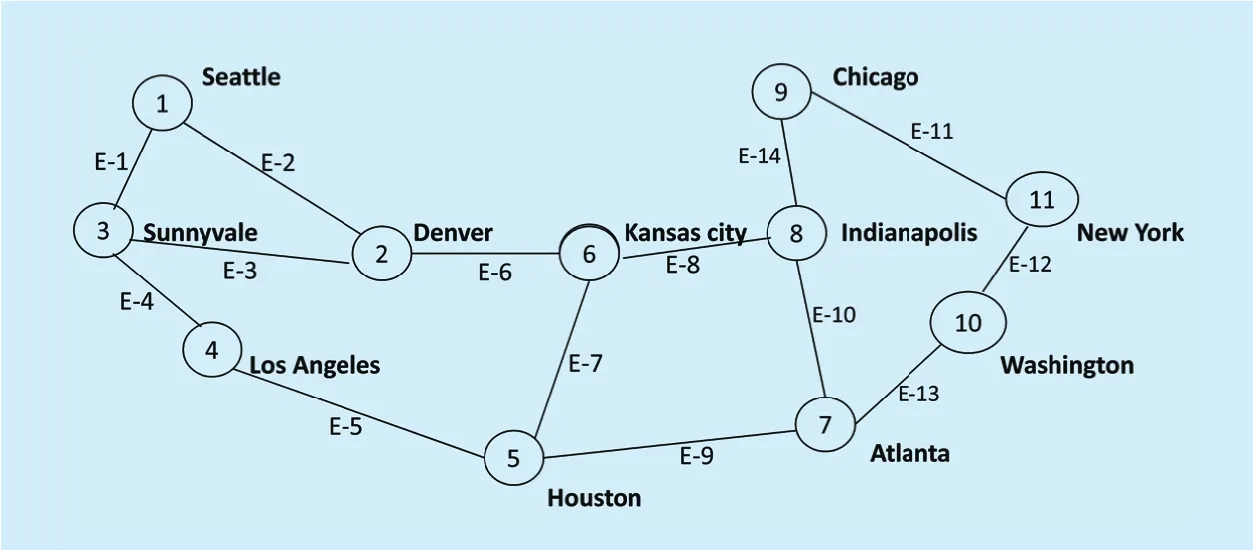
Fig. 2. Structure of Abilene network.
III. CONCLUSION
Here four different models are proposed in energy efficient networking. Minimum edge model provides more energy efciency but requires longer time for computation. Minimum Delay model gives faster delivery of packets due to less number of intermediate edges.Minimum change model is good for fewer changes in topology andow rules. It sustains earlier required topology and cope new communications with old communications. Since,old topology remains same, oldows need not be required to reroute and modified in flow rules. Above models are designed for “minimum bandwidth” type service. Unused edges are disabled and low utilized edges are set to lower data rate for further power saving. Multiow model is designed to transfersles quickly using multiple paths in “trivialle transfer”type service. Quick delivery of packets allows resources be placed early in power saving mode. Multiows model applied after applying one of the above three models. Therefore,“minimum bandwidth” is giving higher priority than “trivial file transfer” service. Energy efficiency is achieved using rate change and enable/disable of edges. More efcient model could be achieved by considering line cards,energy hungry TCAM memory, queuing delay effects etc in a switch. Our next plan is queuing delay with power saving in energy efcient networks.
[1] Bianzino, A.P.; Chaudet, C.; Rossi, D.; Rougier, J.,“A Survey of Green Networking Research,”Communications Surveys & Tutorials, IEEE, vol.14,no.1, First Quarter 2012, pp.3-20.
[2] Hasan, Z.; Boostanimehr, H.; Bhargava, V.K.,“Green Cellular Networks: A Survey, Some Research Issues and Challenges,”Communications Surveys & Tutorials, IEEE, vol.13, no.4, Fourth Quarter 2011, pp.524-540.
[3] M. Pedram, “Energy-Effcient Datacenters,”IEEE Transactions on Computer-Aided Design of Integrated Circuits and Systems, vol. 31, no. 10, Oct.2012, pp. 1465-1484.
[4] Cavdar, D.; Alagoz, F., “A survey of research on greening data centers,”Proc. Global Communications Conference (GLOBECOM), IEEE, 2012,pp. 3237-3242.
[5] Vytautas Valancius et al., “Greening the internet with nano data centers,” Proc. of the 5th international conference on Emerging networking experiments and technologies (CoNEXT ‘09),ACM, New York, NY, USA, 2009, pp. 37-48.
[6] L. L. H. Andrew et al., “Algorithms for dynamic capacity provisioning,” Proc. The 10th International Conference on Optical Internet(COIN2012), Yokohama, Kanagawa, 2012, pp.73-74.
[7] Brandon Heller et al., “ElasticTree: saving energy in data center networks,” Proc. of the 7th USENIX conference on Networked systems design and implementation (NSDI’10), USENIX Association, Berkeley, CA, USA, 2010, pp. 17-17.
[8] R. Wang et al., “Energy-aware routing algorithms in Software-Defined Networks,” Proc.of IEEE International Symposium on a World of Wireless, Mobile and Multimedia Networks 2014, Sydney, NSW, 2014, pp. 1-6.
[9] K. van der Veldt et al., “Carbon-aware path provisioning for NRENs,” Proc. International Green Computing Conference, Dallas, TX, 2014, pp.1-7.
[10] F. Giroire et al., “Optimizing rule placement in software-defined networks for energy-aware routing,”Proc. IEEE Global Communications Conference, Austin, TX,2014, pp. 2523-2529.
[11] R. Bruschiet al., “Green extension of Open-Flow,” Proc.26th International Teletraffic Congress (ITC), Karlskrona, 2014, pp. 1-6.
[12] M. Zhang et al., “GreenTE: Power-aware traffic engineering,”Proc. The 18th IEEE International Conference on Network Protocols, Kyoto,2010,pp. 21-30.
[14] Tatsuya Otoshi, Yuichi Ohsita, Masayuki Murata,Yousuke Takahashi, Keisuke Ishibashi, and Kohei Shiomoto, “Traffc prediction for dynamic traffc engineering,” Computer Networks, ACM, vol.85, C (July 2015), pp. 36-50.
[15] A K Saha et al., “Topology Discovery, Loop Finding and Alternative Path Solution in POX Controller”,Proc. of the International MultiConference of Engineers and Computer Scientists 2016(IMECS 2016), Hong Kong,Vol-2, 16-18 March 2016 , pp. 553-557.
[16] Bruce Lowekamp, David O’Hallaron, and Thomas Gross, “Topology discovery for large ethernet networks,”Proc. of the conference on Applications, technologies, architectures, and protocols for computer communications(SIGCOMM ‹01),ACM, New York, NY, USA,2001, pp. 237-248.
[17] R. Carpa, O. Glück and L. Lefevre, “Segment routing based traffic engineering for energy efficient backbone networks,”Proc. 2014 IEEE International Conference on Advanced Networks and Telecommuncations Systems (ANTS), New Delhi, 2014, pp. 1-6.
[18] L. Zhou, R. Q. Hu, Y. Qian and H. H. Chen, “Energy-Spectrum Efficiency Tradeoff for Video Streaming over Mobile Ad Hoc Networks,”IEEE Journal on Selected Areas in Communications,vol. 31, no. 5, May 2013, pp. 981-991.
[19] Liang Zhou, “Mobile Device-to-Device Video Distribution: Theory and Application,”ACM Trans. Multimedia Computing, Communications and Applications,”vol. 12, Issue 3, Article 38(March 2016), 23 pages.
[20] Hui Yanget al., “Multi-flow virtual concatenation triggered by path cascading degree inexible spectrum optical networks,”Proc. Optical Fiber Communication Conference and Exposition and the National Fiber Optic Engineers Conference (OFC/NFOEC), Anaheim, CA, 2013, pp. 1-3.
[21] H. Yanget al., “CSO: cross stratum optimization for optical as a service,”IEEE Communications Magazine, vol. 53, no. 8, August 2015, pp. 130-139.
[22] H. Yang, J. Zhang, Y. Zhao, J. Han, Y. Lin and Y.Lee, “SUDOI: software defined networking for ubiquitous data center optical interconnection,”IEEE Communications Magazine, vol. 54, no. 2,February 2016, pp. 86-95.
[23] Tatsuya Mori et al., “Identifying elephantows through periodically sampled packets,”Proc. of the 4th ACM SIGCOMM conference on Internet measurement (IMC ‘04). ACM, New York, NY,USA,2004, pp. 115-120.
[24] Lei Bai et al., “Algorithm based on multiple filters for elephant flows identification,” Proc.International Conference on Transportation,Mechanical, and Electrical Engineering (TMEE),Changchun, 2011, pp. 1084-1087.
[25] Lei Bai et al., “Using TCBF technique to realize elephantows identication,” Proc. International Conference on Transportation, Mechanical,and Electrical Engineering (TMEE), Changchun,2011, pp. 1080-1083.
[26] Lichang Che and Bin Qiu, “Landmark LRU: an effcient scheme for the detection of elephantows at internet routers,” IEEE Communications Letters, vol. 10, no. 7, July 2006, pp. 567-569.
[27] Z. Liu et al., “An Enhanced Scheduling Mechanism for Elephant Flows in SDN-Based Data Center,” Proc. IEEE 84th Vehicular Technology Conference (VTC-Fall), Montreal, QC, 2016, pp.1-5.
[28] T. Mori et al., “On the characteristics of Internet traffic variability: spikes and elephants,” Proc.International Symposium on Applications and the Internet, 2004, pp. 99-106.
- China Communications的其它文章
- Smart Caching for QoS-Guaranteed Device-to-Device Content Delivery
- HASG: Security and Effcient Frame for Accessing Cloud Storage
- An SDN-Based Publish/Subscribe-Enabled Communication Platform for IoT Services
- Probabilistic Model Checking-Based Survivability Analysis in Vehicle-to-Vehicle Networks
- A Survey of Multimedia Big Data
- CAICT Symposium on ICT In-Depth Observation Report and White Paper Release Announcing “Ten Development Trends of ICT Industry for 2018-2020”

