China’s Aluminum Processing Industry Showed Differentiation; High-end Aluminum Becomes a Breakthrough
China’s Aluminum Processing Industry Showed Differentiation; High-end Aluminum Becomes a Breakthrough
China’s aluminum processing industry showed differentiation, resulting in the unbalanced allocation of profits in domestic aluminum processing enterprises in 2016. Among them, the medium and low-end deep processing enterprises saw a profit decline, while high-end enterprises were the other case.
Due to a lack of R&D investment in aluminum processing, there is a large gap between China and foreign countries in terms of technical level. China is weak in developing aviation aluminum, passenger car aluminum plate, high-end aluminum foil and other high value-added products, let alone unstable product quality, high production costs, homogenized aluminum products – it still relies upon imports for some sophisticated products.
It is said that in 2016 aluminum deep processing enterprises generally saw a decline in profits, mainly due to increased costs and reduced processing fees. Speaking of which, a few years ago, especially during 2009 – 2013, downstream aluminum businesses received high profits, which attracted a lot of money into the aluminum processing enterprises. So during 2010-2015, domestic aluminum processing enterprises rapidly expanded production capacity, resulting in excess capacity.
At present, overcapacity is mainly seen in the field of low-end aluminum processing. Faced with this dilemma, these enterprises have to fight a “price war”, cutting processing fees to win the market. In the meantime, the domestic low-end deep processing market started to reduce capacity in 2015 and since then, many small enterprises died out due to broken chain of funds. As a result, the capacity is more concentrated in large professional enterprises able to reduce cost and secure money.
Currently, the medium and low-end aluminum deep processing industry is in a steady state. There is no more space for any reduction in processing fees and domestic processing enterprises are expected to maintain a stable profit level in 2017.
Meanwhile, highlights are to be found in these processing enterprises. In recent years, despite the lightweight trends in automotive sector, promotion of new energy vehicles, rapid development of aerospace and significant growing demand of high-end aluminum processing products, our domestic technology update cannot keep up with the market pace and fail to achieve mass production. As a result, we are reliant mostly on imports when it comes to high-end aluminum processing products. But currently many domestic aluminum enterprises are aiming at this market blank and looking ahead on the profound development of aluminum processing.
Looking at the global market, industry insider addressed that China’s aluminum processing products underwent anti-dumping and countervailing investigation and sanctions by a number of countries in the international market. Only those high-tech and high value-added aluminum products will win the competition in the international market.
Up to now, some large enterprises setting foot on high-end aluminum processing are:
CHALCO:
According to Ge Honglin, Aluminum Corporation of China Limited (CHALCO) is committed to creating a “Made in CHALCO” brand and building itself into a high-end aluminum goods, high-end parts and products supplier. In June 2016, CHALCO and Baosteel signed a cooperation framework agreement on jointly promoting the lightweight process technology, production mode, industrial form and business model. In the construction field, China Construction Aluminum New Material Co., Ltd. jointly invested by CHALCO and China State Construction Engineering Corporation (CSCEC), and CHINALCO Aluminum Foil Co., Ltd. invested by CHALCO were established, working on the development of aluminum building templates, high-end aluminum foil respectively. Also as aluminum goods supplier, CHALCO produced all aluminum train skins already put in use, and all aluminum commercial vehicles promoted in full swing. What’s more, CHALCO worked with aircraft manufacturers and shipbuilders to develop aluminum goods for large aircrafts and ships.
Nanshan Aluminum:
In 2016, Shandong Nanshan Aluminum Co., Ltd. mainly worked on developing new energy battery foil in the area of aluminum foil; in the industrial materials sector, Nanshan Aluminum continued to strengthen its strategic cooperation with CSR Qingdao Sifang and CIMC, and enhanced order mining, customer development and new product research in the areas of aerospace, high-speed rail, power tubes/rods, containers, conductive rails, semi-trailer, tanker, air-cooled system, subway screen door, etc.
Particularly noteworthy is that the company’s endeavor in the aviation sector bore great fruits. In October 2016, the company signed a supply agreement with Boeing Airlines to enter the aviation aluminum field, laying a solid foundation for the future increase of aluminum manufacturing business, expansion of aluminum extrusion and aluminum titanium forging business. The company will compete directly with Alcoa and other international aluminum giants to seize the high-end aluminum processing market.
Mingtai Aluminum:
Henan Mingtai Aluminum Industry Co., Ltd. said that the company plans to raise 1.22 billion yuan to expand the rolling plate production capacity to 125,000 tons/year and endeavor in the automotive sheet market. Taking into account the numerous vehicle and parts production bases in Henan, the company advances steadily into the deep processing area, and is expected to further enhance the profitability of aluminum sheet.
China Zhongwang:
China Zhongwang Holdings Limited has been committed to high-end aluminum processing in recent years. Tianjin Zhongwang’s aluminum materials project will be put into production, with the first production line mainly producing aluminum alloy plates, including transport plates and chemical container plates used for ships, commercial vehicles, special vehicles and rail vehicles, etc. As currently China relies mainly on imports for these products, this effort will help make up the blank in the domestic high-end aluminum processing and aluminum alloy thick plate market.
The author believes that the high-end aluminum market has a great potential under favorable state policies. In the future the overall profits of high-end aluminum processing enterprises will continue to rise, while the unit profits and processing fees would remain relatively stable.
(End of December. 2016)

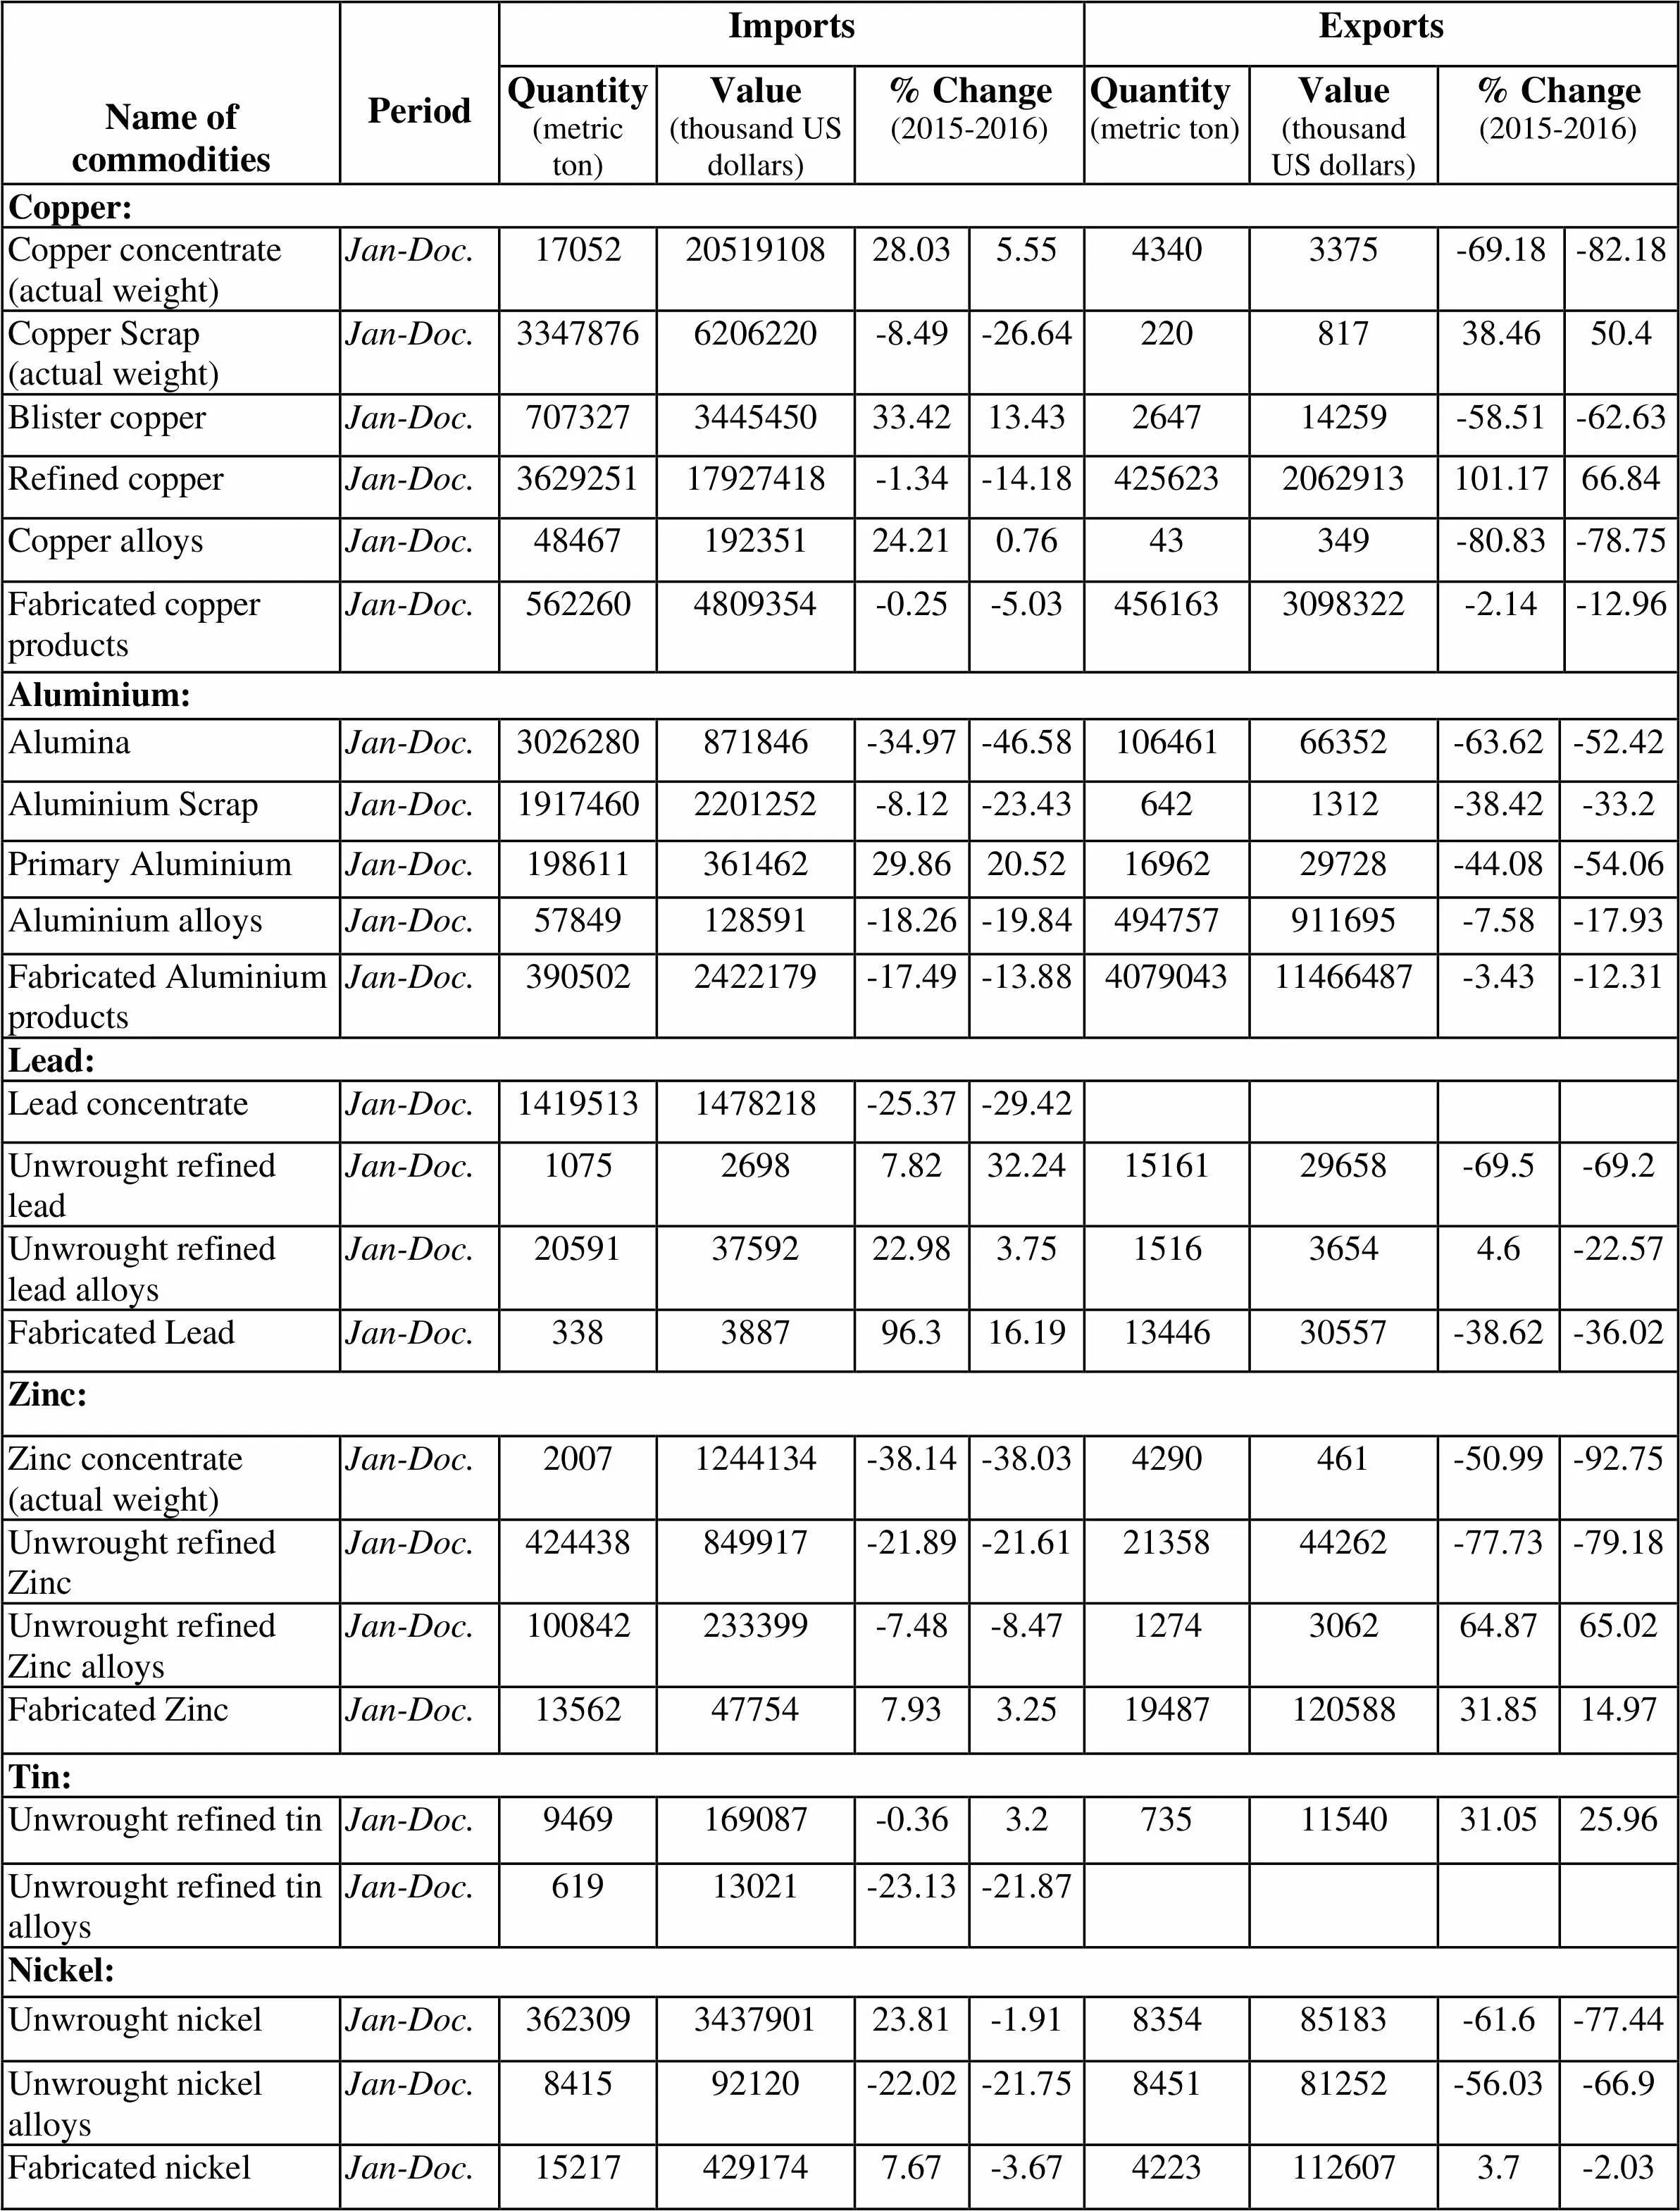
Name of commoditiesPeriodImportsExportsQuantity (metric ton)Value (thousand US dollars)% Change (2015-2016)Quantity (metric ton)Value (thousand US dollars)% Change (2015-2016)Copper:Copper concentrate (actual weight)Jan-Doc.170522051910828.035.5543403375-69.18-82.18Copper Scrap (actual weight)Jan-Doc.33478766206220-8.49-26.6422081738.4650.4Blister copperJan-Doc.707327344545033.4213.43264714259-58.51-62.63Refined copper Jan-Doc.362925117927418-1.34-14.184256232062913101.1766.84Copper alloysJan-Doc.4846719235124.210.7643349-80.83-78.75Fabricated copper productsJan-Doc.5622604809354-0.25-5.034561633098322-2.14-12.96Aluminium:AluminaJan-Doc.3026280871846-34.97-46.5810646166352-63.62-52.42Aluminium ScrapJan-Doc.19174602201252-8.12-23.436421312-38.42-33.2Primary AluminiumJan-Doc.19861136146229.8620.521696229728-44.08-54.06Aluminium alloysJan-Doc.57849128591-18.26-19.84494757911695-7.58-17.93Fabricated Aluminium productsJan-Doc.3905022422179-17.49-13.88407904311466487-3.43-12.31Lead:Lead concentrateJan-Doc.14195131478218-25.37-29.42Unwrought refined leadJan-Doc.107526987.8232.241516129658-69.5-69.2Unwrought refined lead alloys Jan-Doc.205913759222.983.75151636544.6-22.57Fabricated LeadJan-Doc.338388796.316.191344630557-38.62-36.02Zinc:Zinc concentrate (actual weight)Jan-Doc.20071244134-38.14-38.034290461-50.99-92.75Unwrought refined ZincJan-Doc.424438849917-21.89-21.612135844262-77.73-79.18Unwrought refined Zinc alloysJan-Doc.100842233399-7.48-8.471274306264.8765.02Fabricated ZincJan-Doc.13562477547.933.251948712058831.8514.97Tin:Unwrought refined tin Jan-Doc.9469169087-0.363.27351154031.0525.96Unwrought refined tin alloysJan-Doc.61913021-23.13-21.87Nickel:Unwrought nickel Jan-Doc.362309343790123.81-1.91835485183-61.6-77.44Unwrought nickel alloysJan-Doc.841592120-22.02-21.75845181252-56.03-66.9Fabricated nickelJan-Doc.152174291747.67-3.6742231126073.7-2.03

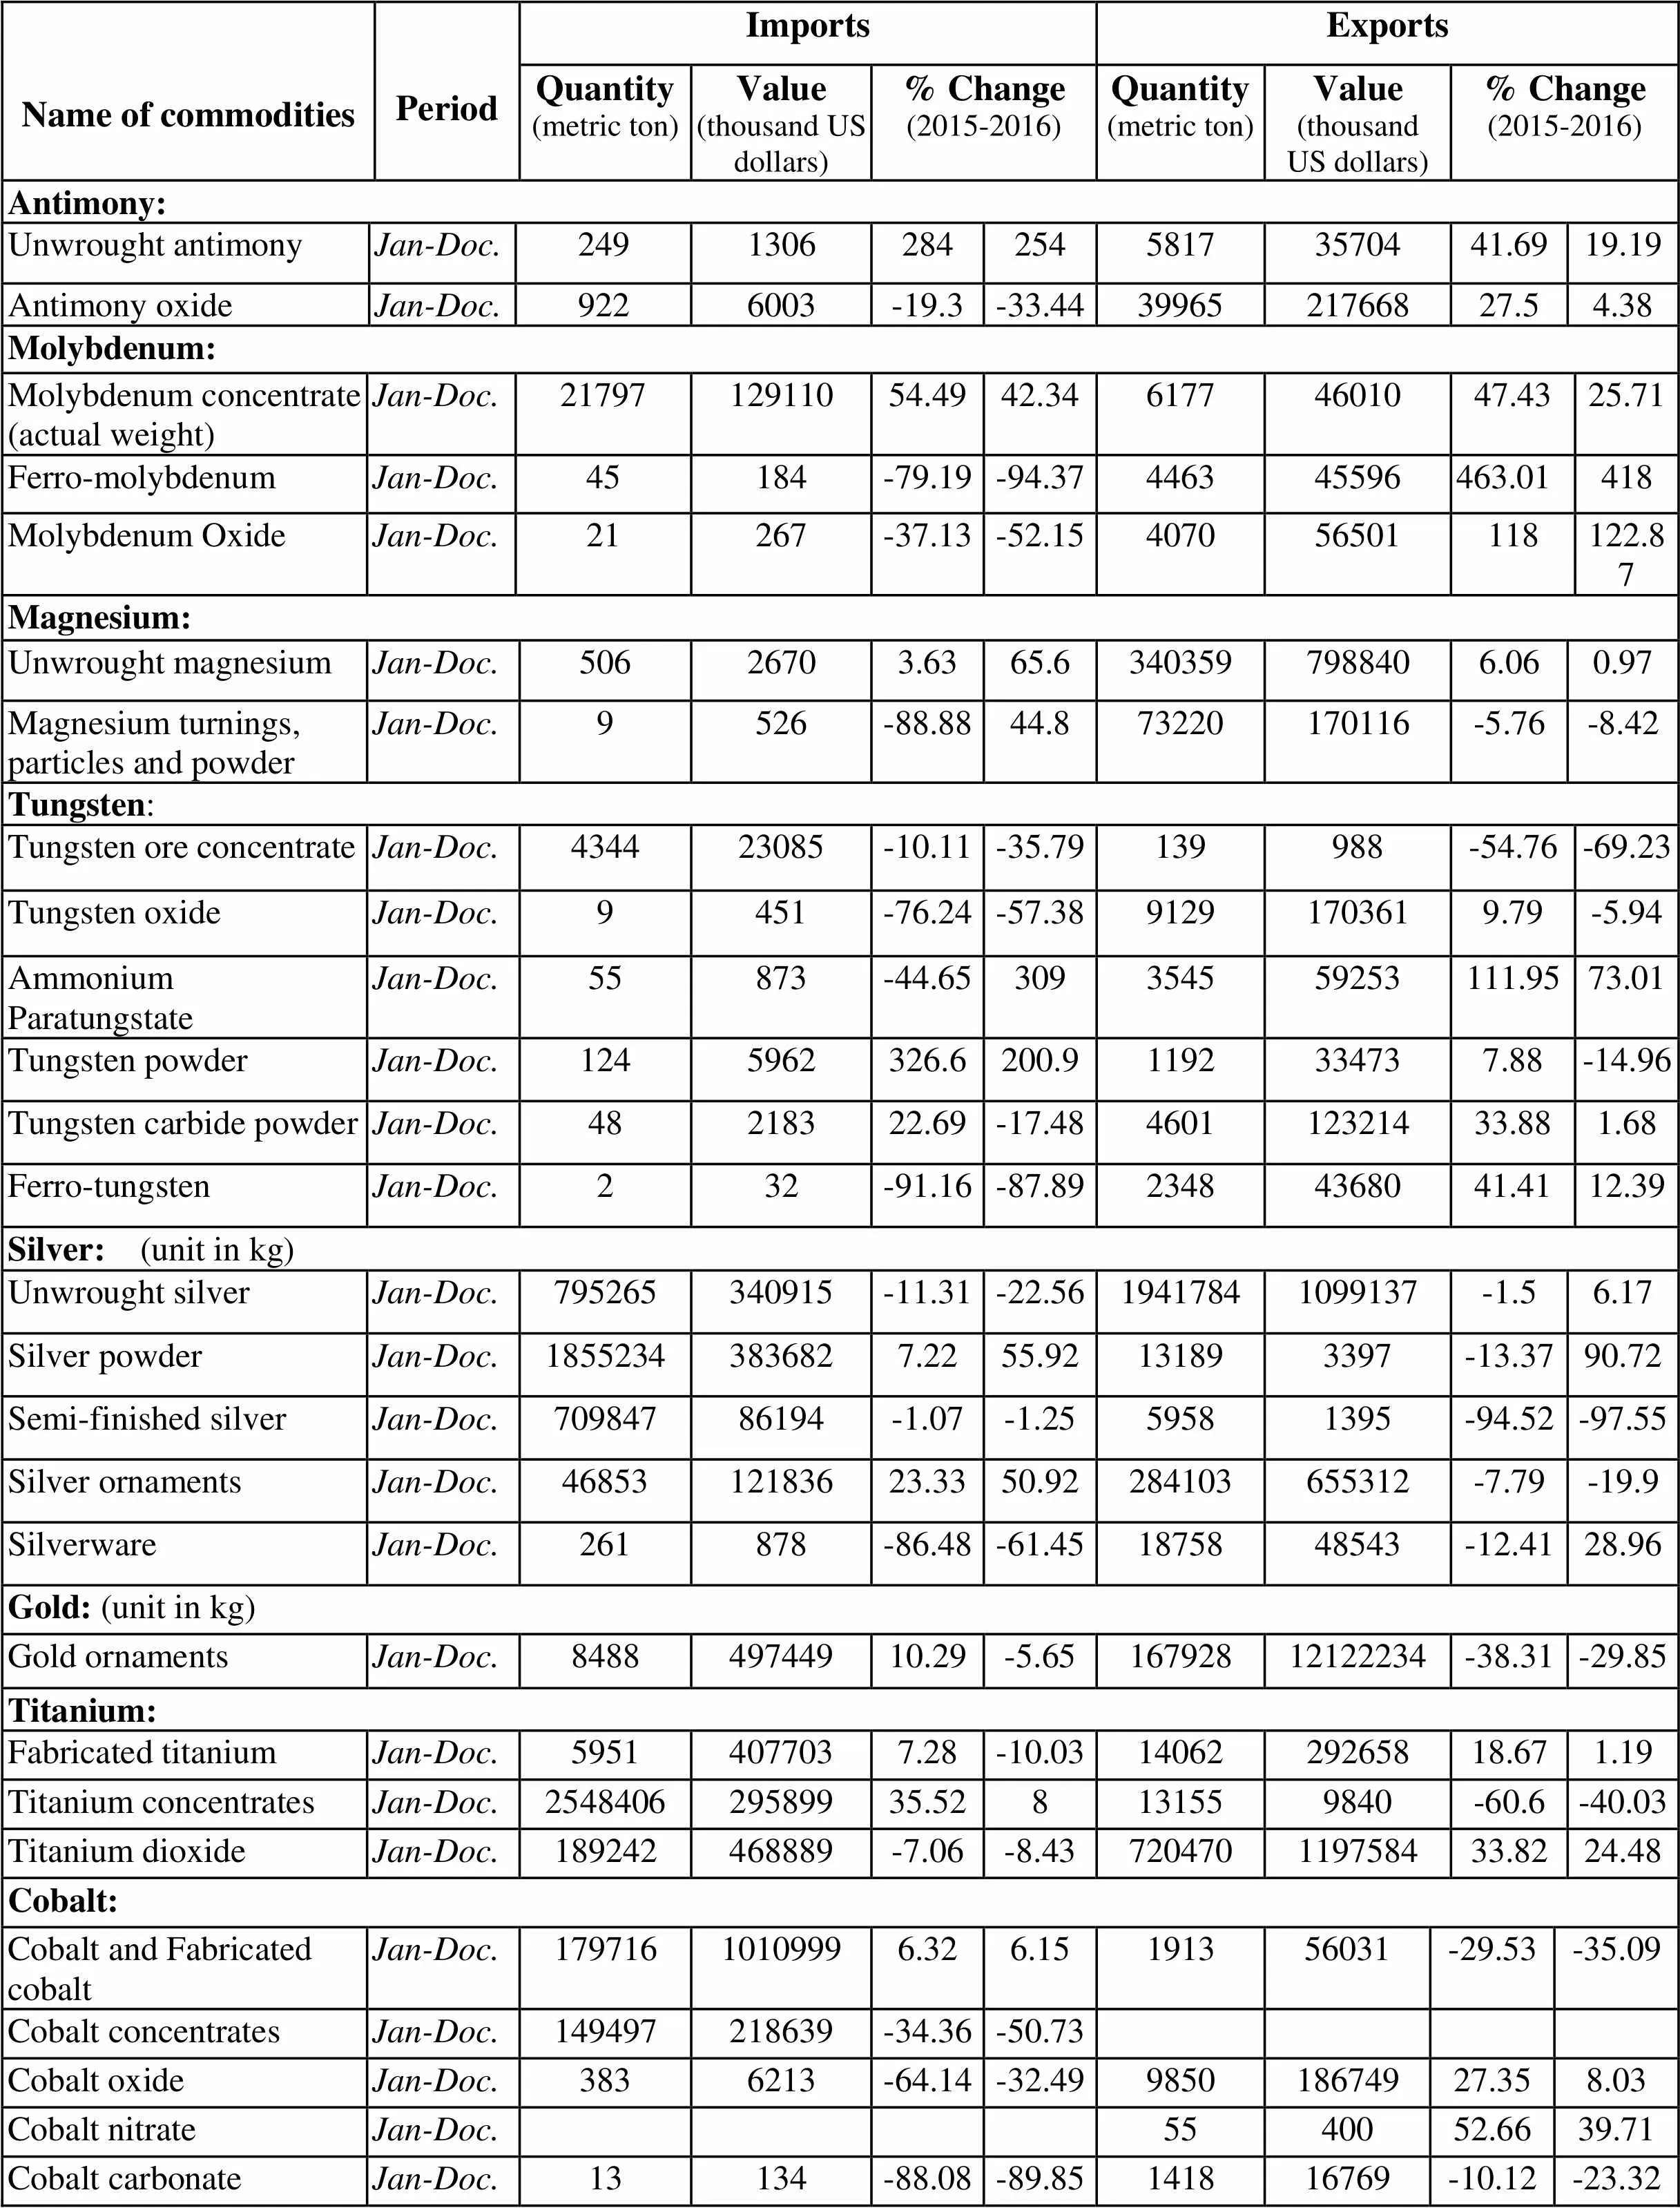
Name of commoditiesPeriodImportsExportsQuantity (metric ton)Value (thousand US dollars)% Change (2015-2016)Quantity (metric ton)Value (thousand US dollars)% Change (2015-2016)Antimony:Unwrought antimony Jan-Doc.249130628425458173570441.6919.19Antimony oxideJan-Doc.9226003-19.3-33.443996521766827.54.38Molybdenum:Molybdenum concentrate (actual weight)Jan-Doc.2179712911054.4942.3461774601047.4325.71Ferro-molybdenumJan-Doc.45184-79.19-94.37446345596463.01418Molybdenum OxideJan-Doc.21267-37.13-52.15407056501118122.87Magnesium:Unwrought magnesiumJan-Doc.50626703.6365.63403597988406.060.97Magnesium turnings, particles and powderJan-Doc.9526-88.8844.873220170116-5.76-8.42Tungsten:Tungsten ore concentrateJan-Doc.434423085-10.11-35.79139988-54.76-69.23Tungsten oxideJan-Doc.9451-76.24-57.3891291703619.79-5.94Ammonium Paratungstate Jan-Doc.55873-44.65309354559253111.9573.01Tungsten powderJan-Doc.1245962326.6200.91192334737.88-14.96 Tungsten carbide powderJan-Doc.48218322.69-17.48460112321433.881.68 Ferro-tungstenJan-Doc.232-91.16-87.8923484368041.4112.39 Silver: (unit in kg) Unwrought silverJan-Doc.795265340915-11.31-22.5619417841099137-1.56.17 Silver powderJan-Doc.18552343836827.2255.92131893397-13.3790.72 Semi-finished silverJan-Doc.70984786194-1.07-1.2559581395-94.52-97.55 Silver ornamentsJan-Doc.4685312183623.3350.92284103655312-7.79-19.9 Silverware Jan-Doc.261878-86.48-61.451875848543-12.4128.96 Gold: (unit in kg) Gold ornamentsJan-Doc.848849744910.29-5.6516792812122234-38.31-29.85 Titanium: Fabricated titaniumJan-Doc.59514077037.28-10.031406229265818.671.19 Titanium concentratesJan-Doc.254840629589935.528131559840-60.6-40.03 Titanium dioxideJan-Doc.189242468889-7.06-8.43720470119758433.8224.48 Cobalt: Cobalt and Fabricated cobaltJan-Doc.17971610109996.326.15191356031-29.53-35.09 Cobalt concentratesJan-Doc.149497218639-34.36-50.73 Cobalt oxideJan-Doc.3836213-64.14-32.49985018674927.358.03 Cobalt nitrateJan-Doc.5540052.6639.71 Cobalt carbonateJan-Doc.13134-88.08-89.85141816769-10.12-23.32
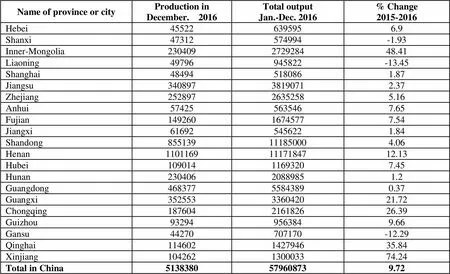
Unit: thousand ton

Name of province or cityProduction inDecember. 2016Total outputJan.-Dec. 2016% Change2015-2016 Hebei455226395956.9 Shanxi47312574994-1.93 Inner-Mongolia230409272928448.41 Liaoning49796945822-13.45 Shanghai484945180861.87 Jiangsu34089738190712.37 Zhejiang25289726352585.16 Anhui574255635467.65 Fujian14926016745777.54 Jiangxi616925456221.84 Shandong855139111850004.06 Henan11011691117184712.13 Hubei10901411693207.45 Hunan23040620889851.2 Guangdong46837755843890.37 Guangxi352553336042021.72 Chongqing187604216182626.39 Guizhou932949563849.66 Gansu44270707170-12.29 Qinghai114602142794635.84 Xinjiang104262130003374.24 Total in China5138380579608739.72
 China Nonferrous Metals Monthly2017年3期
- China Nonferrous Metals Monthly的其它文章
- China's Scarce Mineral Resources Trade Policy Shall Follow the Pace of the Times
- Listed Lithium Companies Released Last Year’s Performance – Who Enjoyed the Bonus of the Era?
- Sichuan: Create Upgraded Vanadium and Titanium Rare Earth
- Forecast and Analysis of China’s Lithium Battery Industry in the Next 5 Years
