喹啉类单核锰(Ⅱ)和钴(Ⅱ)配合物的合成、结构、DNA/BSA键合及DNA切割活性
张永坡 杨佳佳 吕佳苑 高春艳 赵晋忠
喹啉类单核锰(Ⅱ)和钴(Ⅱ)配合物的合成、结构、DNA/BSA键合及DNA切割活性
张永坡杨佳佳吕佳苑高春艳*赵晋忠*
(山西农业大学文理学院,太谷030801)
合成了2个结构类似的喹啉类单核锰和钴配合物[ML(H2O)3]·H2O,其中M为Mn(1)、Co(2),Na2L为8-(羧基钠甲氧基)喹啉-2-甲酸钠。运用红外光谱、元素分析和X射线单晶衍射表征了其结构。利用电子吸收和发射光谱法研究了配合物与CT-DNA及BSA的键合作用及配合物对DNA的切割作用。晶体解析结果表明2个配合物为同构结构,配合物中心均为七配位的畸变五角双锥结构。钴配合物2与CT-DNA的键合能力强于锰配合物1,两者与BSA的作用机理为静态淬灭机理,而键合常数值大小为1>2。在以H2O2作为诱导剂时,在同等条件下,2切割DNA的能力明显增强。通过加入自由基捕获剂证明了配合物对DNA的切割机理为氧化切割机理,其中活性氧为OH·。
配合物;喹啉类配体;DNA/BSA键合;DNA切割
0 Introduction
Metal complexes are a significant class of compounds with biological activities that can be potentially used in gene regulation,probing of DNA specific structures and interactions,and design of therapeutic agents[1-3].Since the discovery of antitumor activity of cisplatin in the 1960s[4-5],the research field of metal-based therapeutics has received considerable attention and broad interest[6-7].Metal complexes have natural propensity to interact with DNA due to their cationic characteristic,and based on theirwide spectrum of ligands and broad range of structural geometries[8]as well as kinetic properties and mechanisms of drug action[9].
It has been widely accepted that DNA is the primary biological targets of metal-based therapeutics in vivo[10].Interactions of metal complexes with DNA range from electrostatic interaction to strong covalent bonding,DNA intercalation,groove binding,hydrogen -bonding with ligands,and cleavage of DNA[11-14].Transition metal complexes as synthetic metallonucleases have been studied extensively due to their supporting a multitude of coordination numbers and geometries. Among them,application of cobalt and manganese are important because of their biologically relevant and lessertoxicity[15-16].Mn and Co are widely distributed in naturalnucleases.Severalmetalloenzymes in biosystem require Mn or Co as cofactor for their catalytic activities.This prompted us to study the DNA interaction as well as nuclease activity of Mn and Co complexes.
Apart from the choice of metal ion centers, purposeful design of these metal-based pharmaceuticals mainly depends on the various ligand frameworks.Structures and functionalities of ligands can significantly alter the biological properties by modifying the physical and chemical properties of the ion (s),including limiting the adverse effects of metal ion overload,inhibiting selected metalloenzymes,and facilitating metal ion redistribution[8].Due to coplanar aromatic rings,quinoline is regarded as an efficient DNA intercalating group.8-Hydroxylquinoline is a monoprotic bidentate chelating agent able to form a bis-substituted metal complex that inhibited proteasome activity,resulting in proliferation suppression and apoptosis induction in cultured breast and prostate cancer cells,showing potential anticancer activity[17-18].
Herein,we selected a typical 2-carboxyl and 8-oxo-ethyl acetate derived quinoline as ligand(Scheme 1).Similar hepta-coordinated Mn(Ⅱ)and Co(Ⅱ)compounds have been synthesized and characterized.In this paper an attempt has been made to investigate the effect of two different metal ions in the same ligand environment on the DNA/BSA binding ability ofthe complexes.

Scheme 1 Synthesis of Na2L(sodium 8-(carboxylatomethoxy)quinoline-2-carboxylate)
1 Experimental
1.1Materials and methods
All reagents and solvents were purchased from commercial sources and used without further purification.Plasmid pBR322 DNA,calf thymus(CTDNA),bovine serum albumin(BSA)and ethidium bromide(EB)were purchased from Sigma-Aldrich. Stock solutions of Mn(Ⅱ)(1.0 mmol·L-1in 32%DMF/ H2O)and Co(Ⅱ)(1.0 mmol·L-1in 6%DMF/H2O) complexes were stored at 4℃and prepared to series concentrations for all experiments.Phosphate buffer and Tris-HCl solution were prepared using tripledistilled deionized sonicated water.Elemental analyses for C,H and N were performed on a Perkin-Elmer analyzer.IR spectra were obtained on a Perkin-Elmer FTIR spectrometer in the range of 4 000~400 cm-1.Electronic spectra were measured on a JASCO V-570 spectrophotometer.Fluorescence spectral data were collected on a MPF-4 fluorescence spectrophotometer at room temperature.Gel Imaging and documentation DigiDoc-It System were assessed using Labworks Imaging and UVI(England)Analysis Software.
1.2Preparation of compounds
1.2.1Synthesis ofthe ligand Na2L
Ligand Na2L was prepared using a similar method of the literature[19].A mixture of 8-hydroxy-2-methylquinoline(2.4 g,15 mmol),ethyl bromoacetate (2.5 g,15 mmol)and powdered K2CO3(8 g,58 mmol) in acetone(30 mL)was refluxed for 24h.After cooled to room temperature,the mixture was centrifuged and filtered.The filtrate was evaporated to generate crude oilresidue,which was redissolved in 25 mL ofdioxane. 1.8 g SeO2(16 mmol)was added and the mixture was refluxed under an open air for 10 h.After cooled,the solvent was removed under vacuum.50 mL 0.5 mol· L-1HCl was added and the mixture was extracted by ethyl acetate.The organic phase was combined and concentrated to generate crude oil residue.The residue was redissolved in 25 mL of ethanol,and a solution of NaOH(1.8 g,45 mmol)in water(10 mL) was slowly added.The mixture was refluxed for 2 h. 25 mL of ethanol was added and the mixture was cooled to temperature slowly and dark yellow solid precipitated.The product was isolated by filtration and washed with cold ethanol,with a yield of 47%. Elemental analysis calcd.for C12H7NNa2O5(%):C, 49.50;H,2.42;N,4.81.Found(%):C,49.41;H,2.67; N,4.79.FTIR(KBr,cm-1):3 348,1 615,1 507,1 480, 1 421,1 385,1 315,1 265,1 107,948,824.
1.2.2Synthesis of[MnL(H2O)3]·H2O(1)
To an aqueous solution(5 mL)of MnCl2·4H2O (0.2 mmol,39.6 mg)was added a methanol solution (15 mL)of Na2L(0.2 mmol,58.2 mg).The resulting mixture was stirred for 3 h at room temperature.After filtration,yellow prism crystals suitable for X-ray diffraction were obtained by slow evaporation of the filtrate after ten days,which were collected by filtration,washed with diethyl ether and dried in air (Yield:28%).Elemental analysis calcd.for C12H7MnNO9(%):C,39.58;H,1.94;N,3.85.Found (%):C,39.49;H,2.01;N,3.78.FTIR(KBr,cm-1): 3 333,1 634,1 506,1 480,1 420,1 380,1 318,1 262, 1 108,946,924,821,614.
1.2.3Synthesis of[CoL(H2O)3]·H2O(2)
Complex 2 was prepared using a similar procedure with the case of 1,using Co(NO3)2·6H2O instead of adding MnCl2·4H2O to the reaction mixture.Red prism crystals suitable for X-ray diffraction were precipitated by slow evaporation of the filtrate after seven days,which were collected by filtration,washed with cold diethyl ether and dried in vacuum(Yield: 37%).Elemental analysis calcd.for C12H7CoNO9(%): C,39.15;H,1.92;N,3.80.Found(%):C,39.08;H, 1.99;N,3.62.FTIR(KBr,cm-1):3 381,1 624,1 509, 1 480,1 423,1 383,1 316,1 266,1 110,948,884, 822,697.
1.3X-ray crystallography
Single crystals of the complexes with suitable size(0.20 mm×0.10 mm×0.05 mm for 1 and 0.25 mm×0.20 mm×0.10 mm for 2)were selected.X-ray diffraction data were collected on a Bruker Smart 1000 CCD diffractometer using Mo Kαradiation(λ= 0.071 073 nm)with theω-2θscan technique.Diffraction data were collected at 113(2)and 293(2)K for 1 and 2,respectively.All the crystal structures were solved using direct methods(SHELXS-97)[20]and refined with full-matrix least-squares technique on F2using the SHELXL-97[21].The hydrogen atoms were added theoretically,and riding on the concerned atoms and refined with fixed thermal factors. Crystallographic data details and structure refinement parameters are presented in Table 1.Selected bond lengths and angles are listed in Table S1.
CCDC:1040326,1;1040325,2.
1.4DNA-binding and cleavage experiments
DNA-binding and cleavage experiments were conducted using the similar methods described previously[22-24].Electronic absorption spectroscopy was an effective method in examining the binding mode of DNA with the metal complex[25].Specifically,concentration of CT-DNA was measured from the UV absorption intensity at 260 nm with a molar extinction coefficient of 6 600 L·mol-1·cm-1[26].The DNA was demonstrated sufficiently free of protein as a ratio of 1.8~1.9 was obtained for the absorbance at 260 nm and 280 nm ofthe CT-DNA solution,which was carried out in 5 mmol·L-1Tris-HCl/50 mmol·L-1NaCl buffer (pH=7.2)[25].The absorption spectra of the complexes binding to DNA were performed by increasing addition of CT-DNA to the complexes in Tris-HCl buffer(pH=7.2).

Table 1 Crystallographic data for complexes 1 and 2
The fluorescence spectra were recorded at room temperature with excitation at 510 nm and emission at about 602 nm.The relative binding of complexes to CT-DNA were carried out with an EB-bound CT-DNA solution in 5 mmol·L-1Tris-HCl and 50 mmol·L-1NaClbuffer(pH=7.2).Absorption titration experiments were performed by titrating complexes into EB-DNA solution,which contains 2.4×10⁻⁶mol·L-1EB and 4.8×10⁻⁵mol·L-1CT-DNA.
To explore the DNA cleavage abilities of complexes,the supercoiled(SC)pBR322 plasmid DNA as a substrate was incubated with complexes.The DNA cleavage experiments were performed by agarose gel electrophoresis,Details of the measurement was carried out as follows:A solution of pBR322 DNA (0.1μg·μL-1)in Tris-HCl(50 mmol·L-1)and NaCl (18 mmol·L-1)buffer(pH=7.2)was treated with 1 and 2.After incubation at 37℃for 3 h,the buffer of bromophenol blue(0.25%),glycerol(45%)and EDTA (2 mmol·L-1))was added.The samples were electrophoresed at 120 V on 0.9%agarose gel for 2 h,using Tris-boric acid-EDTA buffer.The extent of cleavage ofthe super coiled DNA(SC DNA)was determined by measuring the intensities of the bands,which were visualized by UV light and photographed using the Gel Documentation System[27].
Cleavage mechanistic of pBR322 DNA was investigated in the presence of reaction inhibitors and standard radical scavengers.KI,NaN3,methyl green,SYBR green,EDTA and SOD were used as standard radical scavengers,which were added to pBR322 DNA prior to complex loading.After the addition of complex,cleavage experiment was initiated,and it was quenched with addition of 2μL buffer.Further analysis was carried out using the above standard method.
1.5Protein binding studies
The protein binding study was conducted with tryptophan fluorescence quenching experiments using BSA stock solution(1.5 mmol·L-1)in 10 mmol·L-1phosphate buffer(pH=7.0)[23].Briefly,a similar stock solution was prepared as the DNA binding experiments,except that phosphate buffer was used instead of Tris-HClbuffer.Fluorescence spectra were recorded at room temperature with excitation wavelength of BSA at 280 nm and emission at 342 nm.The concentration of BSA was kept constant(36.6μmol·L-1) while the complex concentration varying from 0 to 6.39μmol·L-1.Absorption titration experiments with BSA(15μmol·L-1)were carried out in the absence and presence of complex(2μmol·L-1)(pH=7.0).
2 Results and discussion
2.1Description of the crystal structures
Mononuclear complexes 1 and 2 have been structurally characterized by X-ray crystallography. Since the two complexes are isostructural,the molecular structure of 1 was shown representatively in Fig.1(A similar structure of 2 was shown as Fig.S1). Parameters of refinement process and selected bond lengths and angles are listed in Table 1 and S1, respectively.
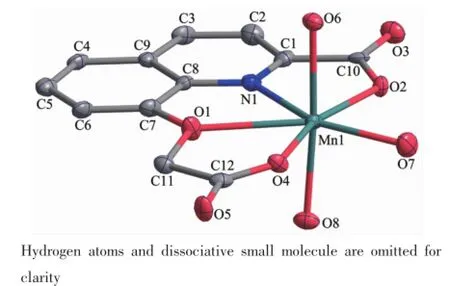
Fig.1 ORTEP view of the molecular structure and atomlabeling scheme of complex 1 with 30% probability ellipsoid
The complexes are isostructural and crystallize in a triclinic cell with P1 space group.Both metal centers are hepta-coordinated with O6Ndonor sets and the geometry around metal centers can be best described as distorted pentagonal bipyramidal.It is worth mentioning that weak M-O(1)coordinated interactions(Mn(1)-O(1)0.249 7(10)nm,Co(1)-O(1) 0.251 4(7)nm)exist in the[ML(H2O)3]units,which are supposed to be caused by the rigid structure of 8-hydroxy-2-methylquinoline[19].The nitrogen atom(N(1)), three oxygen atoms(O(1),O(2)and O(4))of the ligand and an oxygen atom(O(7))ofcoordinate water molecule form the basal plane.Another two oxygen atoms(O(6) and O(8))ofwater molecule occupy the axial positions with normal M-O bond distances,and the trans-axial angles(O6-M-O8)are 176.8(4)°for 1 and 174.9(3)°for 2,respectively.The angles(Table S1)around the metal ion within the pentagonal basal plane vary from 64.3(4)°to 81.4(4)°for complex 1(64.0(2)°~80.7(3)° for complex 2),and the sum of angles spanning these five bonds is 360°for complex 1(360.2°for complex 2),underscoring the flat nature of this equatorial plane.
2.2DNA-binding and cleavage activities
2.2.1DNA-binding studies
The interaction of complexes with CT-DNA was monitored by absorption spectral titrations.The typical titration curve as wellas a plot of(εa-εf)/(εbεf)versus cDNAfor the titration of DNA to complex 2 is shown in Fig.2(similar spectrum of 1 is provided as Fig.S2).The observed intense absorption peaks at 217~221 nm for the two complexes are assigned to theπ-π*transition of intraligand.Addition of increasing amounts of CT-DNA results in an appreciable hypochromism of complexes and slight red shifts(3 nm)in band position,which indicates partial intercalation between complexes and DNA[28].Due to the strong stacking interaction between an aromatic chromophore and the base pairs of DNA,the intercalation between complexes and DNA would lead to hypochromism or bathochromism in UV absorptionspectra.In order to determine the binding strength of the complexes with CT-DNA,the intrinsic binding constants Kbfor complexes 1 and 2 were determined from the spectral titration according to the following equation[29]:cDNA/(εa-εf)=cDNA/(εb-εf)+1/[Kb(εb-εf)],where cDNAis the DNA concentration in nucleotides.The apparentabsorption coefficientεa,εbandεfcorrespond to the extinction coefficient observed for the charge transfer absorption band at a given DNA concentration,the complex free in solution,the complex when fully bound to DNA,respectively.The binding constant Kbvalues(Table 2)follow the order:2 (7.45×10⁵L·mol-1)>1(4.09×10⁵L·mol-1),which suggest that complex 2 has stronger binding affinity than 1.

Fig.2 Absorption spectra of complex 2(2.5μmol·L-1, 0.015%DMF/H2O)in the absence(dashed line) and presence(solid line)of increasing amounts of CT-DNA in 5 mmol·L-1Tris-HCl/50 mmol·L-1NaCl buffer(pH=7.2)

Table 2 DNA and BSA binding data for complexes 1 and 2

Fig.3(a)Fluorescence emission spectra of the EB(2.4μmol·L-1)bound to CT-DNA(48μmol·L-1)system in the absence (dashed line)and presence(solid lines)of complex 2;(b)Plots of I0/I versus the concentrations of complexes 1 and 2
As a means for better understanding of the interaction of the compound with DNA,fluorescence spectral measurements were performed on CT-DNA by varying the concentration of the complexes.Since no luminescence is observed for both complexes at room temperature,ethidium bromide(EB)was employed as fluorescence probe and the binding propensity of the complexes to CT-DNA is evaluated by fluorescence emission intensity of EB bound to DNA.Due to the strong intercalation to the adjacent DNA base pairs, EB could emit intense fluorescent light in the presence of DNA[30]and could be quenched by addition of another molecule.Fig.3(a)shows the relativebinding propensity of the complex 2 to EB bound CTDNA and similar spectrum of 1 is presented as Fig. S3.Plots of I0/I versus ccomplexfor the quenched intensity of 1~2 to EB-DNA is shown in Fig.3(b).The reduction extent of the emission intensity at 602 nm (510 nm excitation)provides an evaluation of the binding propensity of the complex to DNA.On the basis of the Stern-Volmer equation[31],I0/I=1+KcQ,in which I0and I represent the fluorescence intensities in the absence and presence of quencher,K is the Stern-Volmer quenching constant,and cQis the concentration of the quencher,the quenching plots showed that the quenching of EB bound to CT-DNA by complex 1 or 2 is in agreement with the linear Stern-Volmer equation,which also indicates that the complexes performed good bind ability to DNA. According to equation KEBcEB=Kappccomplex,where the ccomplexwas the concentration value at half reduction of the fluorescence intensity of EB,and KEBwas a constant of 1.0×10⁷mol·L-1(cEB=2.4μmol·L-1).The calculated apparent binding constant values(Kapp) (Table 2)follow the order:2(6.76×10⁵L·mol-1)>1 (4.16×10⁵L·mol-1),which is consistent with the results of Kbvalues by UV spectroscopy.The two complexes show better binding propensity than the previous reported Co(Ⅱ)and Mn(Ⅱ)complexes[32-34].On the whole,the binding constants are less than that of the classical intercalators and metallointercalators(107L·mol-1)[35],indicating medium binding strength of the complexes with CT-DNA.
2.2.2DNA cleavage studies
The concentration-dependent DNA cleavage activity by complex 2 was observed without any external agents,as shown in Fig.4(a)(similar study of 1 is presented as Fig.S4(a)).2 could notinduce obvious DNA cleavage with the increase of concentration(50~650μmol·L-1),while the percentages of FormⅠ(SC DNA)and FormⅡ(NC DNA)of complex 1 both gradually reduce with the increase of concentration, which suggests thatthe complex partially degraded SC DNA into undetectable minor fragments[36].
The concentration-dependent DNA cleavage activities by complex 1 and 2 were also performed in the presence of reductive reagent H2O2.The results showed that DNA cleavage efficiency of complex 2 exhibited remarkable increases at the same conditions (Fig.4(b)).It has been observed that complex 2 is an efficient cleaver of SC DNA and produces~93%of NC DNA at 20μmol·L-1concentration,which implies that H2O2plays a vital role as a revulsant or an activator.While 1 shows relatively weak chemical nuclease activity which implies little impact on the reductive reagent.As shown in the Fig.S4(b)and Fig. 4(b),at 50μmol·L-1concentration,the DNA cleavage efficiencies(FormⅠinto FormⅡand FormⅢ) follow the order of 2(90.3%FormⅡand 9.7%FormⅢ)>1(47.5%FormⅡ).

Fig.4 Gel electrophoresis diagram showing the cleavage of p BR322 DNA(0.1μg·μL-1)at different complex concentrations in Tris-HCl/NaCl buffer(pH=7.2)and 37℃
In order to get further information about the reactive oxygen species(ROS)which was responsible for the DNA damage,the potential DNA cleavage mechanism of the complexes in the presence of H2O2were investigated.Series of DNA cleavage experiments (Fig.5 and Fig.S5)were performed using additional reagents like KIas hydroxylradical(OH·)scavengers, NaN3as singlet oxygen(1O2)quencher,methyl green as DNA major groove-binder,SYBR green as DNA minor groove-binder,EDTA as the chelator of complexes and superoxide dismutase(SOD)as O2-·radical scavenger.As Fig.5 shows,the complexes showed complete or partial inhibition in the DNA-cleavageactivity in the presence of the hydroxyl radial scavenger KI,no obvious inhibitions were observed for other radical scavengers(Fig.6),which suggested the involvementofhydroxyl radicals(OH·)as reactive oxygen species.The EDTA,a metal chelating agent that strongly binds to Mmetal chelating agent that strongly binds toforming a stable complex, can efficiently inhibit DNA cleavage,indicating the metal ion play the key role in the cleavage.Moreover, the additions of DNA major groove-binder methyl green and minor groove-binder SYBR Green showed no inhibition DNA cleavage by complexes 1 and 2, which suggested that the complexes didn′t bind at the grooves of DNA[37].

Fig.5 Cleavage of plasmid pBR322 DNA(0.1μg·μL-1)in presence of 35μmol·L-1complex 2 (0.1%DMF/H2O)and different inhibitors after 3 h incubation at 37℃
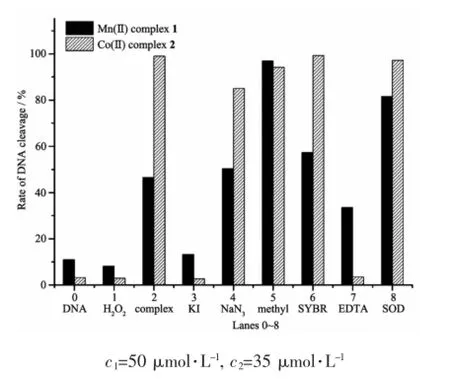
Fig.6 Histogram of relative amounts according to Fig.S5 and Fig.5 shows the cleavage of plasmid pBR322 DNA(0.1μg·μL-1)in presence of complex and different inhibitors after 3 h incubation at 37℃
2.3Protein binding studies
The interactions between drugs with blood plasma proteins have attracted increasing research interest in recent years,particularly regarding serum albumin.Since serum albumin constitutes more than half of the total protein in blood plasma and it plays an important role in drug transport and drug metabolism[37-38],and may lead to enhancement of the biological properties of the original drug[39].Bovine serum albumin(BSA)is extensively studied for its structuralhomology with human serum albumin(HSA). The fluorescence property of BSA is due to the presence of tryptophan,tyrosine and phenylalanine residues,and tryptophan is the most primary contributor[38].Fig.7(a)shows the fluorescence emission spectrum of BSA with increasing concentration of complex 1(similar spectrum of2 is presented as Fig. S6).When complexes concentration was increased,the intensity of the characteristic broad emission band at 348 nm decreased regularly,which demonstrate that the interactions between complexes and BSA have indeed occurred.The fluorescence quenching can be described according to Stern-Volmer equation,F0/F= 1+Kqτ0cQ=1+KSVcQ.F0and F respectively represent the fluorescence intensities in the absence and presence ofquencher,Kqrepresents the quenching rate constant, τ0is the average life-time of biomolecule without quencher(about 10-8s)[31],KSVis the Stern-Volmer quenching constant and cQrepresents the quencher concentration.Fig.7(b)shows the Stern-Volmer plots of F0/F vs cQof the complexes,and KSVcan be obtained by the slope from the plot.Table 2 listed the values of KSVand Kqfor the interaction of the complexes with BSA and the KSVvalues follow the order:1(2.46×10⁴mol·L-1)>2(1.58×10⁴mol·L-1).
In general,quenching mechanisms can be classified as dynamic and static quenching.Dynamic quenching takes a process of interaction between the fluorophore and the quencher during the transientexistence of the exited state while static quenching tends to the formation offluorophore-quenchercomplex. The Kqvalues(~1012L·mol-1·s-1)of 1 and 2 are higher than the maximum scatter collision-quenching constantof diverse kinds of quenchers for biopolymers fluorescence(2×10¹⁰L·mol-1·s-1,the maximum possible value for dynamic quenching),suggesting the presence ofstatic quenching mechanism[40].
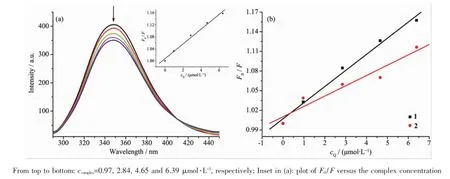
Fig.7(a)Fluorescence emission spectra of the BSA(36.6μmol·L-1)system in the absence(dashed line)and presence(solid lines)of complex 1;(b)Plot of F0/F versus the concentration of complexes 1 and 2
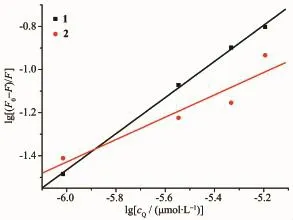
Fig.8 Plot of lg[(F0-F)/F]vs lgcQfor BSA in the presence of complexes 1 and 2
On the basis of the Scatchard equation[41]:lg[(F0-F)/F]=lg K+n lg cQ,for the static quenching interaction, the binding constant(K)and the number of binding sites(n)can be respectively calculated from the slope and the intercept of the double logarithm regression plots of lg[(F0-F)/F]versus lgcQ(Fig.8).Table 2 shows the K and n values following the order:1(3.67×10³L·mol-1,0.84)>2(48.2 L·mol-1,0.52),indicating that 1 exhibits higher binding constants for BSA than 2, which is inconsistent with the results of DNA interaction.As expected,the values of n are associated with binding constants K,which verify the conclusion[42]that a direct relation between the binding constant and number ofbinding sites.
UV-Vis absorption spectroscopy,which is a simple but effective method for detecting complex formation,was employed to detect changes of the intensity and wavelength of complex with BSA.The absorption band obtained in the spectra of 15μmol· L-1BSA at 279 nm in the absence of complex,and the intensity showed an increase without any shift after the addition of 2μmol·L-1Mn(Ⅱ)and Co(Ⅱ)complexes,respectively(Fig.9),which can be attributed to the formation of a ground state complex between metal complex and BSA[43].Mn(Ⅱ)complex showed a larger hyperchromism of 3.6%than that of Co(Ⅱ)complexes(0.9%),indicating that Mn(Ⅱ)behaved stronger ability of BSA binding,which was consistentwith the results offluorescence tests.
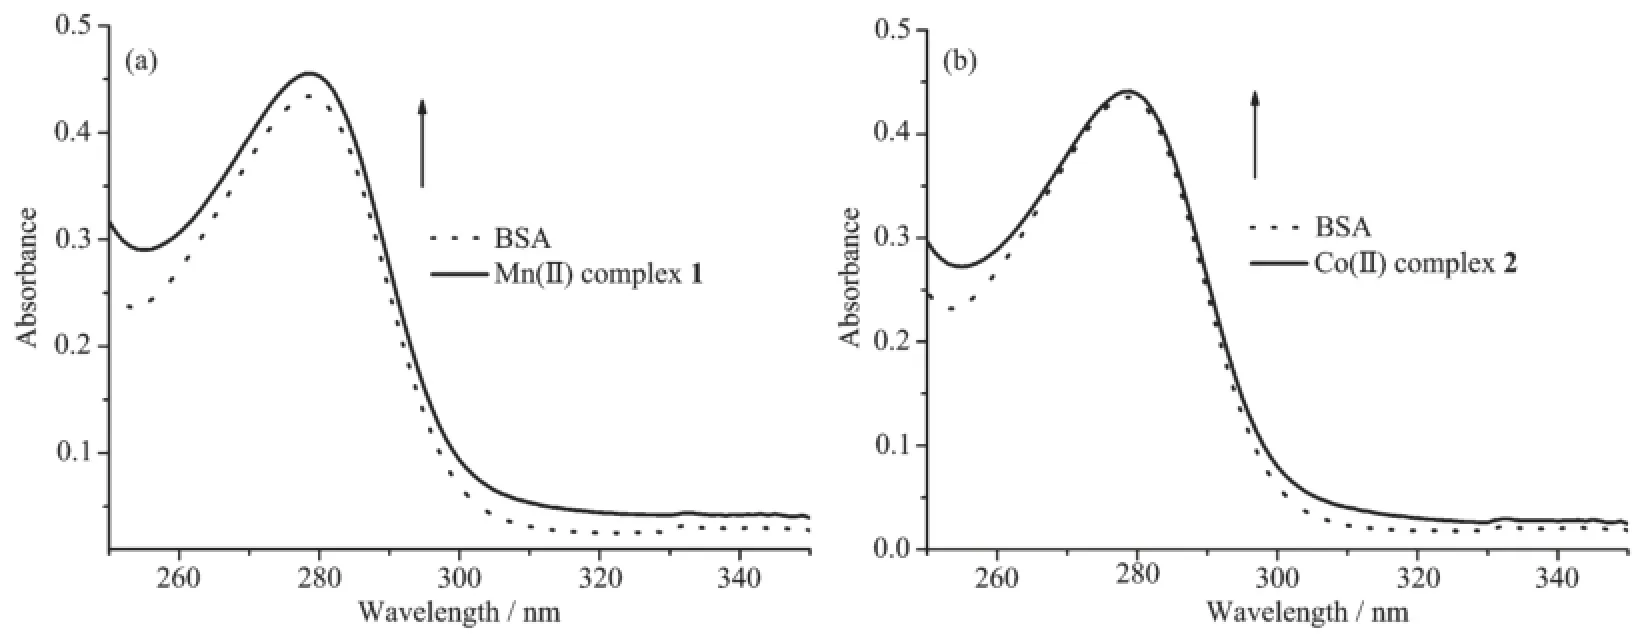
Fig.9 Absorption spectra of BSA(15μmol·L-1)in the absence(dot line)and presence(solid line)of complexes 1(a)and 2(b)(2μmol·L-1)in phosphate buffer(pH=7.0)
3 Conclusions
Two new mononuclear Mn(Ⅱ)and Co(Ⅱ)complexes have been synthesized and characterized by using various physico-chemicaltechniques.Crystalstructures of the complexes are isostructural and both metal centers are hepta-coordinated and the geometry can be described as distorted pentagonal bipyramidal.The complexes display binding propensity to the CT-DNA giving a relative order:2(Co(Ⅱ)complex)>1(Mn(Ⅱ)complex).Compared with complex 1,the DNA cleavage efficiency of 2 exhibited more remarkable increases at the same condition in the presence of H2O2.Oxidative mechanism has been demonstrated by adding standard radical scavengers and the reactive oxygen species (ROS)responsible for the DNA cleavage is likely hydroxyl radicals(OH·).While binding abilities of the complexes to BSA are inconsistentwith the results of DNA interaction which follow the order:1>2,and the quenching mechanisms of BSA by the complexes are static procedures.
Acknowledgements:This work was supported by the PhD Research Startup Foundation of Shanxi Agricultural University(Grants No.2013YJ40 and 2013YJ41),Science and Technology Innovation Fund of Shanxi Agricultural University (Grants No.2014005 and 2014013),College students Innovation and Entreprenecuship Training Project of Shanxi province (Grants No.2015085 and 2015/06)and the Key Scientific Research Projects of Coal Fund in Shanxi(Grant No.FT201402-01).
Supporting information is available athttp://www.wjhxxb.cn
References:
[1]Barone G,Terenzi A,Lauria A,et al.Coord.Chem.Rev., 2013,257(19):2848-2862
[2]Jiang Q,Xiao N,Shi P,et al.Coord.Chem.Rev.,2007,251 (15):1951-1972
[3]Pages B J,Ang D L,Wright E P,et al.Dalton Trans.,2015, 44(8):3505-3526
[4]Rosenberg B,Van Camp L,Krigas T.Nature,1965,205:698-699
[5]Rosenberg B,Van camp L.Nature,1969,222:385-386
[6]Mjos K D,Orvig C.Chem.Rev.,2014,114(8):4540-4563
[7]Wilson J J,Lippard S J.Chem.Rev.,2013,114(8):4470-4495
[8]Storr T,Thompson K H,Orvig C.Chem.Soc.Rev.,2006,35 (6):534-544
[9]Reedijk J.Proc.Natl.Acad.Sci.U.S.A.,2003,100(7):3611-3616
[10]Komor A C,Barton J K.Chem.Commun.,2013,49(35):3617 -3630
[11]Leung C H,He H Z,Liu L J,et al.Coord.Chem.Rev., 2013,257(21):3139-3151
[12]Liu H K,Sadler P J.Acc.Chem.Res.,2011,44(5):349-359
[13]Aiba Y,Sumaoka J,Komiyama M.Chem.Soc.Rev.,2011, 40(12):5657-5668
[14]Munteanu C R,Suntharalingam K.Dalton Trans.,2015,44 (31):13796-13808
[15]Ghosh K,Tyagi N,Kumar P.Inorg.Chem.Commun.,2010, 13(3):380-383
[16]Ghosh K,Mohan V,Kumar P,et al.Polyhedron,2013,49(1): 167-176
[17]Daniel K G,Chen D,Orlu S,et al.Breast Cancer Res.,2005,7(6):R897-R908
[18]Chen D,Peng F,Cui Q C,et al.Front.Biosci.,2005,10(2): 2932-2939
[19]Zheng Q,Wang S,Liu W.Tetrahedron,2014,70(42):7686-7690
[20]Sheldrick G M.SHELXS-97,Program for the Solution of Crystal Structure,University of Göttingen,Germany,1997.
[21]Sheldrick G M.SHELXL-97,Program for the Refinement of Crystal Structure,University of Göttingen,Germany,1997.
[22]Gao C Y,Ma Z Y,Zhang Y P,et al.RSC Adv.,2015,5(39): 30768-30779
[23]Gao C Y,Qiao X,Ma Z Y,et al.Dalton Trans.,2012,41 (39):12220-12232
[24]Zhang Y P,Ma Z Y,Gao C Y,et al.New J.Chem.,2016,40 (9):7513-7521
[25]Marmur J.J.Mol.Biol.,1961,3(2):208-218
[26]Gultneh Y,Khan A R,Blaise D,et al.J.Inorg.Biochem., 1999,75(1):7-18
[27]Bernadou J,Pratviel G,Bennis F,et al.Biochemistry,1989, 28(18):7268-7275
[28]Baldini M,Belicchi-Ferrari M,Bisceglie F,et al.Inorg. Chem.,2004,43(22):7170-7179
[29]Wolfe A,Shimer Jr G H,Meehan T.Biochemistry,1987,26 (20):6392-6396
[30]Meyer-Almes F J,Porschke D.Biochemistry,1993,32(16): 4246-4253
[31]Lakowicz J R,Weber G.Biochemistry,1973,12(21):4171-4179
[32]Ramachandran E,Thomas S P,Poornima P,et al.Eur.J. Med.Chem.,2012,50:405-415
[33]Kellett A,O′Connor M,McCann M,et al.MedChemComm, 2011,2(7):579-584
[34]Wu H,Shi F,Wang X,et al.Transition Met.Chem.,2014, 39(3):261-270
[35]Cory M,McKee D D,Kagan J,et al.J.Am.Chem.Soc., 1985,107(8):2528-2536
[36]Ramakrishnan S,Shakthipriya D,Suresh E,et al.Inorg. Chem.,2011,50(14):6458-6471
[37]Gibellini D,Vitone F,Schiavone P,et al.J.Clin.Virol., 2004,29(4):282-289
[38]Lakowicz J R.Principles of Fluorescence Spectroscopy.3rd Ed.New York:Springer,2006:530-573
[39]Villarreal W,Colina-Vegas L,Rodrigues de Oliveira C,et al. Inorg.Chem.,2015,54(24):11709-11720
[40]Ware W R.J.Phys.Chem.,1962,66(3):455-458
[41]Scatchard G.Ann.N.Y.Acad.Sci.,1949,51(4):660-672
[42]Sathyadevi P,Krishnamoorthy P,Butorac R R,et al.Dalton Trans.,2011,40(38):9690-9702
[43]Hu Y J,Ou-Yang Y,Dai C M,et al.Biomacromolecules, 2009,11(1):106-112
Syntheses,Structures,DNA/BSA Binding and DNA Cleavage of Mononuclear Manganese(Ⅱ)and Cobalt(Ⅱ)Complexes with N,O-Chelating Quinoline Derivative Ligand
ZHANG Yong-Po YANG Jia-Jia LÜJia-Yuan GAO Chun-Yan*ZHAO Jin-Zhong*
(College of Arts and Sciences,Shanxi Agricultural University,Taigu,Shanxi 030801,China)
Two new mononuclear complexes[ML(H2O)3]·H2O(M=Mn(1)and Co(2))ofquinoline derivative ligand (Na2L=sodium 8-(carboxylatomethoxy)quinoline-2-carboxylate)have been synthesized and characterized.The complexes are isostructural and both metal centers are heptacoordinated with O6N donor sets and the geometry around metal centers can be best described as distorted pentagonal bipyramidal.Interactions of the complexes with CT-DNA and BSA have been explored by absorption and emission spectralmethods.Binding abilities of the complexes to CT-DNA display a relative order:2>1,while the quenching mechanisms of BSA by both complexes are static procedures and the binding constant values follow the order:1>2.In the presence of H2O2as a revulsant or an activator,compared with complex 1,the DNA cleavage efficiency of 2 exhibited more remarkable increases at the same conditions.Oxidative mechanism has been demonstrated by adding standard radical scavengers and the reactive oxygen species(ROS)responsible for the DNA cleavage is likely hydroxyl radicals (OH·).CCDC:1040326,1;1040325,2.
complexes;quinoline ligand;DNA/BSA binding;DNA cleavage
O614.71+1;O614.81+2
A
1001-4861(2016)12-2172-11
10.11862/CJIC.2016.265
2016-06-15。收修改稿日期:2016-09-29。
山西农业大学引进人才科研启动金(No.2013YJ40,2013YJ41)、山西农业大学科技创新基金(No.2014013,2014005)、山西农业大学大学生科技创新项目(No.13-017,2015085)、山西省高等学校大学生创新创业训练项目(No.2015085,2015106)和山西省煤基重点项目(No.FT201402-01)资助。
*通信联系人。E-mail:gaocynk@163.com,zhaojinzhongnd@126.com;会员登记号:S06N2534M1605。

