Texture image classification with discriminative neural networks
Yang Song(),Qing Li,Dagan Feng,Ju Jia Zou,and Weidong Cai
Research Article
Texture image classification with discriminative neural networks
Yang Song1(),Qing Li1,Dagan Feng1,Ju Jia Zou2,and Weidong Cai1
Texture provides an important cue for many computer vision applications,and texture image classification has been an active research area over the past years.Recently,deep learning techniques using convolutional neural networks(CNN)have emerged as the state-of-the-art:CNN-based features provide a significant performance improvement over previous handcrafted features.In this study,we demonstrate that we can further improve the discriminative power of CNN-based features and achieve more accurate classification of texture images.In particular,we have designed a discriminative neural network-based feature transformation(NFT)method,with which the CNN-based features are transformed to lower dimensionality descriptors based on an ensemble of neural networks optimized for the classification objective. For evaluation,we used three standard benchmark datasets(KTH-TIPS2,FMD,and DTD) for texture image classification. Our experimental results show enhanced classification performance over the state-of-the-art.
texture classification;neural networks;feature learning;feature transformation
1 Introduction
Texture is a fundamental characteristic of objects, and classification of texture images is an importantcomponent in many computer vision tasks such as material classification,object detection,and scene recognition.It is however difficult to achieve accurate classification due to the large intra-class variation and low inter-class distinction[1,2].For example, as shown in Fig.1,images in the paper and foliage classes have heterogeneous visual characteristics within each class,while some images in the paper class show similarity to some in the foliage class.
1 School of Information Technologies,the University of Sydney,NSW 2006,Australia.E-mail:Y.Song,yang. song@sydney.edu.au();Q.Li,qili4463@uni.sydney. edu.au;D.Feng,dagan.feng@sydney.edu.au;W.Cai, tom.cai@sydney.edu.au.
2 School of Computing,Engineering and Mathematics, Western Sydney University,Penrith,NSW 2751, Australia.E-mail:J.Zou@westernsydney.edu.au.
Manuscript received:2016-08-02;accepted:2016-09-21
Design of feature descriptors that can well accommodate large intra-class variation and low inter-class distinction has been the focus of research in most studies. Until recently,the predominant approach was based on mid-level encoding of handcrafted local texture descriptors.For example, the earlier methods use vector quantization based on clustering to encode the local descriptors into a bag-of-words[3–7].More recent methods show that encoding using Fisher vectors is more effective than vector quantization[8,9].Compared to bag-of-words,the Fisher vector representation based on Gaussian mixture models(GMM)is able to better exploit the clustering structure in
the feature space and provide more discriminative power for images with low inter-class distinction. When designing local descriptors,feature invariance to transformations is often a key consideration. For example,the scale-invariant feature transform (SIFT)[10],local binary patterns(LBP)and their variations[11–13],basic image features[14],and fractal analysis[2,15]are commonly used.
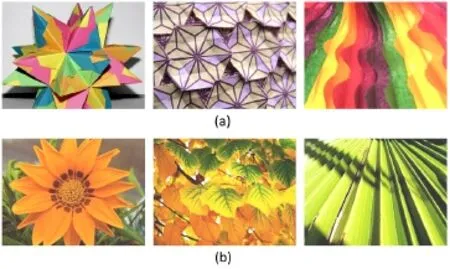
Fig.1 Sample images from the FMD dataset in the(a)paper and (b)foliage classes.
Recent studies in texture image classification have shown that features generated using convolutional neural networks(CNN)[16]are generally more discriminative than those from previous approaches. Specifically,the DeCAF and Caffe features,which are computed using the pretrained ImageNet models, provide better classification performance than the Fisher vector encoding of SIFT descriptors on a number of benchmark datasets[9,17].The current state-of-the-art[18,19]in texture image classification is achieved using CNN-based features generated from the VGG-VD model[20].Using the VGG-VD model pretrained on ImageNet, the FV-CNN descriptor is generated by Fisher vector(FV)encoding of local descriptors from the convolutional layer[18],and the B-CNN descriptor is computed by bilinear encoding[19].These two descriptors have similar performance,providing significant improvement over previous approaches. By integrating FV-CNN and the descriptor from the fully-connected layer(FC-CNN),the best classification performance is obtained[18]. In all these approaches,a support vector machine(SVM) classifier with linear kernel is used for classification.
A common trait of these CNN-based features is their high dimensionality.With 512-dimensional local descriptors,the FV-CNN feature has 64k dimensions and B-CNN has 256k dimensions. Although an SVM classifier can intrinsically handle high-dimensional features, it has been noted that there is high redundancy in the CNN-based features,but dimensionality reduction using principal component analysis(PCA)has little impact on the classification performance[18].This observation prompts the following question:is it possible to have an algorithm that can reduce the feature redundancy and also improve the classification performance?
There have been many dimensionality reduction techniques proposed in the literature and a detailed review of well-known techniques can be found in Refs.[21,22].Amongst them,PCA and linear discriminant analysis(LDA)are representative of the most commonly used unsupervised and supervised algorithms,respectively.With these techniques, the resultant feature dimension is limited by the number of training data or classes,and this can result in undesirable information loss.A different approach to dimensionality reduction is based on neural networks[23–25].These methods create autoencoders,which aim to reconstruct the high-dimensional input vectors in an unsupervised manner through a number of encoding and decoding layers.The encoding layers of the network produce the reduced dimensionality features.The sizes of the layers are specified by the user and hence autoencoders provide flexibility in choosing the feature dimension after reduction.However, autoencoders tend to result in lower performance than PCA in many classification tasks[21].In addition,to the best of our knowledge,there is no existing study that shows dimensionality reduction methods can be applied to CNN-based methods(especially FC-CNN and FV-CNN)to further enhance classification performance.
In this paper,we present a texture image classification approach built upon CNN-based features.While the FC-CNN and FV-CNN descriptors are highly effective,we hypothesize that further reducing the feature redundancy would enhance the discriminative power of the descriptors and provide more accurate classification.We have thus designed a new discriminative neural networkbased feature transformation(NFT)method with this aim. Compared to existing neural networkbased dimensionality reduction techniques that employ the unsupervised autoencoder model[23–25],our NFT method incorporates supervised label information to correlate feature transformation with classification performance. In addition,our NFT method involves an ensemble of feedforward neural network(FNN)models,by dividing the feature descriptor into a number of blocks and training one FNN for each block.This ensemble approach helps to reduce the complexity of the individual models and improve the overall performance. We also note that in order to avoid information loss when reducing feature redundancy,our NFT method does
not greatly reduce the feature dimension,and the transformed descriptor tends to have a much higher dimensionality than those resulted from the usual dimensionality reduction techniques.
Our experiments were performed on three benchmark datasets commonly used for texture image classification:the KTH-TIPS2 dataset[26], the Flickr material dataset(FMD)[27],and the describable texture dataset(DTD)[9].We show that improved performance is obtained over the state-ofthe-art on these datasets.
The rest of the paper is organized as follows. We describe our method in Section 2.Results, evaluation,and discussion are presented in Section 3.Finally,we conclude the paper in Section 4.
2 Our approach
Our method has three components:CNN-based texture feature extraction,feature transformation based on discriminative neural networks,and classification of the transformed features using a linear-kernel SVM.Figure 2 illustrates the overall framework of our method.
2.1 CNN-based feature extraction
During texture feature extraction,we use two types of feature descriptors(FC-CNN and FVCNN)that have recently shown state-of-the-art texture classification performance[18].With FCCNN,the VGG-VD model(very deep with 19 layers) pretrained on ImageNet[20]is applied to the image. The 4k-dimensional descriptor extracted from the penultimate fully-connected(FC)layer is the FCCNN feature.This FC-CNN feature is the typical CNN descriptor when pretrained models are used instead of training a domain-specific model.
Differently from FC-CNN,FV-CNN involves Fisher vector(FV)encoding of local descriptors[28]. Using the same VGG-VD model, the 512-dimensional local descriptors from the last convolutional layer are pooled and encoded using FVs to obtain the FV-CNN feature.During this process,the dense local descriptors are extracted at multiple scales by scaling the input image to different sizes(2s,s=-3,-2.5,...,1.5).A visual vocabulary of 64 Gaussian components is then generated from the local descriptors extracted from the training images,and encoding is performed based on the first and second order differences between the local descriptors and the visual vocabulary.The FV-CNN feature has dimension 512×64×2=64k.
2.2 FNN-based feature transformation
Since the FC-CNN and FV-CNN descriptors have high dimensionality,we expect there to be some redundancy in these features,and that the discriminative power of these descriptors could be improved by reducing the redundancy.We have thus designed a discriminative neural networkbased feature transformation(NFT)method to perform feature transformation;the transformed descriptors are then classified using a linear-kernel SVM.We choose to use FNN as the basis of our NFT model,since the multi-layer structure of FNN naturally provides a dimensionality reduction property using the intermediate outputs.In addition, the supervised learning of FNN enables the model to associate the objective of feature transformation with classification.In this section,we first give some preliminaries about how FNN can be considered as a dimensionality reduction technique,and then we describe the details of our method.
2.2.1 Preliminary
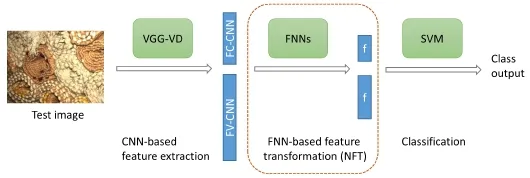
Fig.2 Method.
Various kinds of artificial neural networks can be used to classify data. One of the basic forms is
the feedforward neural network(FNN)[29],which contains an input layer,multiple hidden layers,and an output layer.The interconnection between layers of neurons creates an acyclic graph,with information flowing in one direction to produce the classification result at the output layer.
Figure 3 shows a simple FNN model with one hidden layer of 4 neurons and one output layer corresponding to two classes.The functional view of this model is that first the 10-dimensional input x is transformed into a 4-dimensional vector h by multiplying a weight matrix W∈R4×10by x,adding a bias b,and passing through an activation function (typically tanh,the hyperbolic tangent sigmoid transfer function).Then similarly h is transformed to the 2-dimensional label vector y.The weight matrix and bias can be learned using backpropagation.
Here,rather than using the output y as the classification result,we can consider the intermediate vector h as a transformed representation of the input x,and h can be classified using a binary SVM to produce the classification outputs.This design forms the underlying concept of our NFT method.
2.2.2 Algorithm design
In our NFT method,the intermediate vector from the hidden layer of FNN is used as the transformed feature.There are two main design choices to make when constructing this FNN model,corresponding to the various layers of the network.
Firstly,we define the input and output layers.The output layer simply corresponds to the classification output,so the size of the output layer equals the number of image classes in the dataset. For the input layer,while it would be intuitive to use the FC-CNN and FV-CNN feature vectors directly,the high dimensionality of these features would cause difficulty in designing a suitable network architecture (i.e.,the number of hidden layers and neurons). Our empirical studies furthermore showed that using the features as input does not provide enhanced classification performance. Instead,therefore,we designed a block-based approach,in which the FCCNN and FV-CNN features are divided into multiple blocks of much shorter vectors,and each of the blocks is used as the input:given the original feature dimension d,assume that the features are divided into blocks of n dimensions each.We create one FNN for each block with n as the size of input layer.An ensemble of d/n FNNs is thus created.

Fig.3 A simple FNN model.
Next,the hidden layers must be determined;all d/n FNNs employ the same design. Specifically, we opt for a simple structure with two hidden layers of size h and h/2 respectively.We also specify h≤n so that the transformed feature has lower dimensionality than the original feature. The simple two-layer structure helps to enhance the efficiency of training of the FNNs,and our experiments demonstrate the effectiveness of this design.Nevertheless,we note that other variations might achieve better classification performance, especially if our method is applied to different datasets.
The intermediate vector outputs of the second hidden layer of all d/n FNNs are concatenated as the final transformed feature descriptor. Formally,define the input vector as x∈Rn×1.The intermediate vector v∈R(h/2)×1is derived as

where W1∈ Rh×nand W2∈ R(h/2)×hare the weight matrices at the two hidden layers,and b1∈Rh×1and b2∈R(h/2)×1are the corresponding bias vectors.These W and b parameters are learned using the scaled conjugate gradient backpropagation method.To avoid unnecessary feature scaling, the tanh function is not applied to the second hidden layer.Instead,L2 normalization is applied to v before concatenation to form the transformed feature descriptor f,which is of size hd/(2n).Since h≤n,the dimensionality of f is at most half of that of the original feature. Figure 4 illustrates the feature transformation process using our NFT model,and Fig.5 shows the overall information flow.
3 Experimental results
3.1 Datasets and implementation
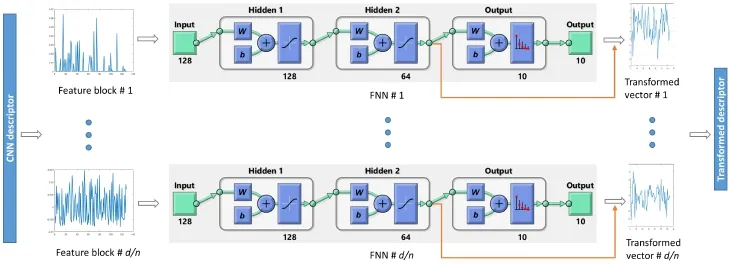
Fig.4 How our NFT method transforms CNN-based features using an ensemble of FNNs,for the FMD dataset with 10 output classes.The CNN-based feature descriptor is divided into blocks of size n=128,and one FNN is constructed for each feature block.The two hidden layers have sizes of h=128 and h/2=64,respectively.The dimensionality of the final transformed descriptor f is half of that of the original CNN-based descriptor.
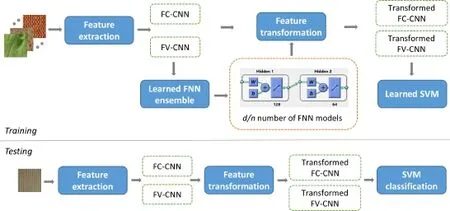
Fig.5 Information flow.During training,an ensemble of FNN models is learned for feature transformation,and a linear-kernel SVM is learned from the transformed descriptors.Given a test image,the FC-CNN and FV-CNN descriptors are extracted and then transformed using the learned FNN ensemble,and SVM classification is finally performed to label the image.
In this study,we performed experiments using three benchmark datasets:KTH-TIPS2,FMD,and DTD. The KTH-TIPS2 dataset has 4752 images in 11 material classes such as brown bread,cotton,linen, and wool.FMD has 1000 images in 10 material classes,including fabric,foliage,paper,and water. DTD contains 5640 images in 47 texture classes including blotchy,freckled,knitted,meshed,porous, and sprinkled.These datasets present challenging texture classification tasks and have frequently been used in earlier studies.
Following the standard setup used in earlier studies[9],we perform training and testing as follows.For the KTH-TIPS2 dataset,one sample (containing 108 images)from each class was used for training and three samples were used for testing.For FMD,half of the images were selected for training and the other half for testing.For DTD,2/3 of the images were used for training and 1/3 for testing. Four splits of training and testing data were used for evaluation of each dataset.Average classification accuracy was computed from these tests.
Our program was implemented using MATLAB. The MatConvNet[30]and VLFeat[31]packages were used to compute the FC-CNN and FV-CNN features.The FNN model was generated using the patternnet function in MATLAB.To set the parameters n and h,we evaluated a range of possible values(1024,512,256,128,and 64,with h≤n), and selected the best performing parameters.This selection process was conducted by averaging the classification performance on two splits of training and testing data,and these splits were different from those used in performance evaluation.The selected
settings were n=64 and h=64 for the KTH-TIPS2 and DTD datasets,and n=128 and h=128 for FMD.The dimensionality of the transformed feature descriptor was thus half of the original feature dimension.In addition,LIBSVM[32]was used for SVM classification.The regularization parameter C in the linear-kernel SVM was chosen based on the same split of training and testing data,and C=15 was found to perform well for all datasets.
3.2 Classification performance
Table 1 shows the classification performance on the three datasets.For each dataset,we evaluated the performance using the FC-CNN descriptor,the FVCNN descriptor,and the concatenated FC-CNN and FV-CNN descriptors.For each descriptor,we compared the performance using three classifiers, including the linear-kernel SVM,FNN,and our classification method(NFT then linear-kernel SVM). With FNN,we experimented with various network configurations of one,two,or three hidden layers and each layer containing 32 to 1024 neurons;and it was found that two layers with 128 and 64 neurons provided the best performance.The results for FNN in Table 1 were obtained using this configuration.
Overall,using FC-CNN and FV-CNN combined as the feature descriptor achieved the best classification performance for all datasets.The improvement of our approach over SVM indicates the advantage of including the feature transformation step,i.e., our NFT method.The largest improvement was obtained on the KTH-TIPS2 dataset,showing a 2.0% increase in average classification accuracy.For FMD and DTD,the improvement was 1.1%and 0.7%, respectively.The state-of-the-art[18]is essentially the same method as SVM but with slightly different implementation details,hence the results were similar for SVM and Ref.[18].The results also show that NFT had more benefit when FV-CNN was used compared to FC-CNN.We suggest that this was due to the higher dimensionality of FV-CNN than that of FC-CNN,and hence more feature redundancy in FV-CNN could be exploited by our NFT method to enhance the discriminative power of the descriptors. It can also be seen that the FNN classifier resulted in lower classification performance than SVM and our method.The linear-kernel SVM classifier has regularly been used with FV descriptors in computer vision[18,28],and our results validated this design choice. Also,the advantage of our method over FNN indicates that it is beneficial to include an ensemble of FNNs as an additional discriminative layer before SVM classification,but direct use of FNN for classifying FV descriptors is not effective.
The classification recall and precision for each image class are shown in Figs.6–8. The results were obtained by combining the FC-CNN and FVCNN features with our NFT method.It can be seen that the classification performance was relatively balanced on the FMD and DTD datasets.Onthe KTH-TIPS2 dataset,however,there was a larger variation in classification performance for different classes.In particular,misclassification often occurred between the fifth(cotton),eighth(linen), and last(wool)classes,resulting in low recall and precision for these classes.The high degree of visual similarity between these image classes explains these results.On the other hand,the characteristics of the forth(cork),seventh(lettuce leaf),and tenth (wood)classes were quite unique.Consequently,the classification recall and precision for these classes were excellent.
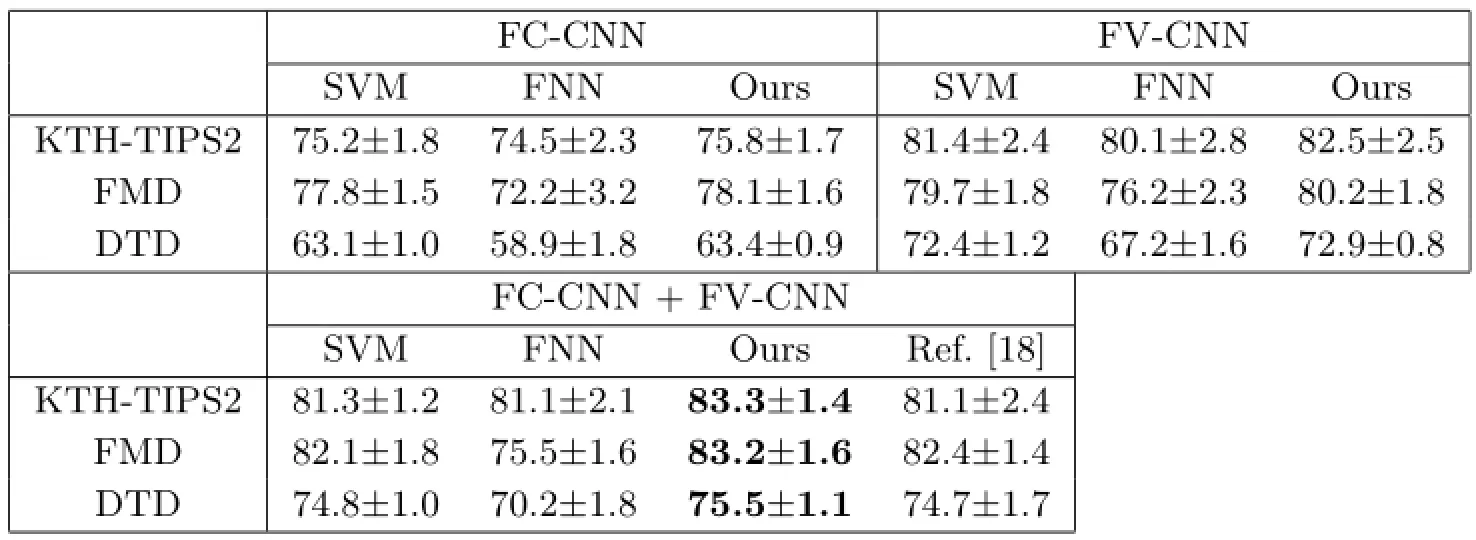
Table 1 Classification accuracies,comparing our method(NFT+SVM)with SVM only,FNN,and the state-of-the-art[18] (Unit:%)

Fig.6 Classification recall and precision for the KTH-TIPS2 dataset.Each class is represented by one image.The two numbers above the image indicate the classification recall and precision for that class,respectively.

Fig.7 Classification recall and precision for the FMD dataset.
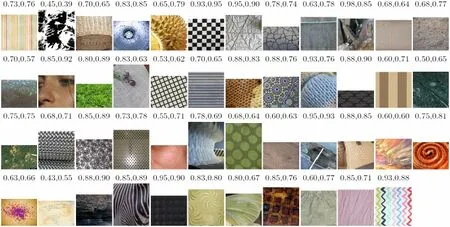
Fig.8 Classification recall and precision on the DTD dataset.
Figure 9 shows the classification performance with different parameter settings for n(the size of the input vector block)and h(the size of the first hidden layer). In general,larger n decreases the classification performance:it is more advantageous to divide the high-dimensional FC-CNN and FVCNN descriptors into small blocks of vectors for feature transformation.This result validated our design choice of building an ensemble of FNNs with each FNN processing a local block within the feature descriptor.Such block-based processing can reduce the number of variables,making it possible to build a simple FNN model with two hidden layers which fits the discriminative objective effectively.
The results also show that for a given value of n,the classification performance fluctuates with different settings of h. For the KTH-TIPS2 and DTD datasets,there was a general tendency for lower h to give higher classification accuracy.This implies that there was a relatively high degree of redundancy in the CNN-based features for these images,and reducing the feature dimensionality could enhance the discriminative capability of the features.However,for the FMD dataset, lower h tended to produce lower classification accuracy,indicating a relatively low degree of feature redundancy in this dataset.This is explained by the high level of visual complexity in the FMD images.
3.3 Dimensionality reduction

Fig.9 Classification results using FC-CNN+FV-CNN as the feature descriptor,for varying values of parameters n and h.
To further evaluate our NFT method, we compared it with other dimensionality reduction techniques including PCA,LDA,and autoencoders. PCA and LDA are popular dimensionality reduction techniques and key representatives of the unsupervised and supervised approaches, respectively.Autoencoders are closely related to our NFT method,since they are also built on neural networks.All approaches were conducted on the same sets of training and testing data as for our method,and SVM was used as the classifier.
The main parameter in PCA and LDA was the feature size after reduction.We found that using the maximum possible dimension after reduction provided the best classification results.For autoencoders,we experimented with one to three encoding layers of various sizes ranging from 64 to 1024.Using one encoding layer provided the best classification results;the results were not sensitive to the size of this layer.We did not conduct more extensive evaluation using deeper structures or larger layers due to the cost of training.In addition,for a more comprehensive comparison with our NFT method,we also experimented with an ensemble of autoencoders.Specifically,similarly to the approach used in our NFT method,we divided the CNN-based feature descriptors into blocks and trained an autoencoder model for each block.Experiments tested each model with one or two encoding layers of various sizes(64 to 1024).The best performing configuration was used for comparison as well.
As shown in Fig.10,our method achieved the highest performance.It was interesting to see that besides our NFT method,only LDA was able to improve the classification performance relative to using the original high-dimensional descriptors.PCA had no effect on the classification performance if the reduced feature dimension equalled the total number of principal components,but lower performance was obtained when fewer feature dimensions were used.These results suggest that it was beneficial to use supervised dimensionality reduction with CNN-based feature descriptors.The degree of improvement provided by LDA was smaller than that for our method,demonstrating the advantage of our NFT method.The autoencoder(AE)and ensemble of autoencoders(EAE)techniques were the least effective and the resultant classification accuracies were lower than when using the original high-dimensional descriptors.EAE performed better than AE on the KTH-TIPS2 and FMD datasets but worse on the DTD dataset. Such results show that autoencoder models are unsuitable for dimensionality reduction of CNN-based features. The superiority of our method to EAE indicates
that by replacing the unsupervised reconstruction objective in autoencoders with the supervised discriminative objective in our NFT method, dimensionality reduction is better correlated with classification output and hence can enhance classification performance.

Fig.10 Classification results using various dimensionality reduction techniques,with FC-CNN+FV-CNN as the feature descriptor.SVM classification without dimensionality reduction is also included as a baseline.
4 Conclusions
We have presented a texture image classification method in this paper.Recent studies have shown that CNN-based features(FC-CNN and FVCNN)provide significantly better classification than handcrafted features.We hypothesized that reducing the feature redundancy of these high dimensionality of these features could lead to better classification performance.We thus designed a discriminative neural network-based feature transformation(NFT)method to transform the high-dimensional CNN-based descriptors to ones of lower dimensionality in a more discriminative feature space before performing classification.We conducted an experimental evaluation on three benchmark datasets:KTH-TIPS2,FMD,and DTD.Our results show the advantage of our method over the state-ofthe-art in texture image classification and over other dimensionality reduction techniques.As a future study,we will investigate the effect of including more feature descriptors into the classification framework. In particular,we will evaluate FV descriptors based on other types of local features that are handcrafted or learned via unsupervised learning models.
Acknowledgements
This work was supported in part by Australian Research Council(ARC)grants.
[1]Leung,T.;Malik,J.Representing and recognizing the visual appearance of materials using three-dimensional textons.International Journal of Computer Vision Vol.43,No.1,29–44,2001.
[2]Varma,M.;Garg,R.Locally invariant fractal features for statistical texture classification.In:Proceedings of IEEE 11th International Conference on Computer Vision,1–8,2007.
[3]Malik,J.;Belongie,S.;Leung,T.;Shi,J.Contour and texture analysis for image segmentation.International Journal of Computer Vision Vol.43,No.1,7–27,2001.
[4]Lazebnik,S.;Schmid,C.;Ponce,J.A sparse texture representation using local affine regions. IEEE Transactions on Pattern Analysis and Machine Intelligence Vol.27,No.8,1265–1278,2005.
[5]Zhang,J.;Marszalek,M.;Lazebnik,S.;Schmid, C.Local features and kernels for classification of texture and object categories:A comprehensive study. International Journal of Computer Vision Vol.73,No. 2,213–238,2007.
[6]Liu,L.;Fieguth,P.;Kuang,G.;Zha,H.Sorted random projections for robust texture classification. In: Proceedings of International Conference on Computer Vision,391–398,2011.
[7]Timofte,R.;Van Gool,L.A training-free classification framework for textures,writers,and materials.In: Proceedings of the 23rd British Machine Vision Conference,Vol.13,14,2012.
[8]Sharma,G.;ul Hussain,S.;Jurie,F.Local higherorder statistics(LHS)for texture categorization and facial analysis.In:Computer Vision—ECCV 2012. Fitzgibbon,A.;Lazebnik,S.;Perona,P.;Sato,Y.;Schmid,C.Eds.Springer Berlin Heidelberg,1–12, 2012.
[9]Cimpoi,M.;Maji,S.;Kokkinos,I.;Mohamed,S.;Vedaldi,A.Describing textures in the wild.In: Proceedings of the IEEE Conference on Computer Vision and Pattern Recognition,3606–3613,2014.
[10]Lowe, D.G.Distinctive image features from scale-invariant keypoints.International Journal of Computer Vision Vol.60,No.2,91–110,2004.
[11]Ojala, T.; Pietikainen, M.; Maenpaa, T. Multiresolution gray-scale and rotation invariant texture classification with local binary patterns. IEEE Transactions on Pattern Analysis and Machine Intelligence Vol.24,No.7,971–987,2002.
[12]Sharan,L.;Liu,C.;Rosenholtz,R.;Adelson,E. H.Recognizing materials using perceptually inspired features.International Journal of Computer Vision Vol.103,No.3,348–371,2013.
[13]Quan,Y.;Xu,Y.;Sun,Y.;Luo,Y.Lacunarity analysis on image patterns for texture classification. In:Proceedings of the IEEE Conference on Computer Vision and Pattern Recognition,160–167,2014.
[14]Crosier,M.;Griffin,L.D.Using basic image features for texture classification.International Journal of Computer Vision Vol.88,No.3,447–460,2010.
[15]Xu,Y.;Ji,H.;Fermüller,C.Viewpoint invariant texture description using fractal analysis. International Journal of Computer Vision Vol. 83,No.1,85–100,2009.
[16]Krizhevsky,A.;Sutskever,I.;Hinton,G.E.Imagenet classification with deep convolutional neural networks. In:Proceedings of Advances in Neural Information Processing Systems,1097–1105,2012.
[17]Song,Y.;Cai,W.;Li,Q.;Zhang,F.;Feng,D.;Huang,H.Fusing subcategory probabilities for texture classification.In:Proceedings of the IEEE Conference on Computer Vision and Pattern Recognition,4409–4417,2015.
[18]Cimpoi,M.;Maji,S.;Vedaldi,A.Deep filter banks for texture recognition and segmentation.In:Proceedings of the IEEE Conference on Computer Vision and Pattern Recognition,3828–3836,2015.
[19]Lin,T.Y.;Maji,S.Visualizing and understanding deep texture representations. arXiv preprint arXiv:1511.05197,2015.
[20]Simonyan,K.;Zisserman,A.Very deep convolutional networks for large-scale image recognition.arXiv preprint arXiv:1409.1556,2014.
[21]Van der MLJP,P.E.O.; van den HH,J. Dimensionality reduction: A comparative review. Tilburg,Netherlands:Tilburg Centre for Creative Computing,Tilburg University,Technical Report: 2009-005,2009.
[22]Cunningham, J.P.; Ghahramani, Z. Linear dimensionality reduction: Survey, insights, and generalizations. Journal of Machine Learning Research Vol.16,2859–2900,2015.
[23]Hinton,G.E.;Salakhutdinov,R.R.Reducing the dimensionality of data with neural networks.Science Vol.313,No.5786,504–507,2006.
[24]Wang,W.;Huang,Y.;Wang,Y.;Wang,L. Generalized autoencoder: A neural network framework for dimensionality reduction. In: Proceedings of the IEEE Conference on Computer Vision and Pattern Recognition Workshops,490–497, 2014.
[25]Wang,Y.;Yao,H.;Zhao,S.Auto-encoder based dimensionality reduction.Neurocomputing Vol.184, 232–242,2016.
[26]Caputo,B.;Hayman,E.;Mallikarjuna,P.Classspecific material categorization.In:Proceedings of the 10th IEEE International Conference on Computer Vision,Vol.1,1597–1604,2005.
[27]Sharan,L.;Rosenholtz,R.;Adelson,E.Material perception: What can you see in a brief glance? Journal of Vision Vol.9,No.8,784,2009.
[28]Perronnin,F.;Sánchez,J.;Mensink,T.Improving the fisher kernel for large-scale image classification. In:Computer Vision—ECCV 2010.Daniilidis,K.;Maragos,P.;Paragios,N.Eds.Springer Berlin Heidelberg,143–156,2010.
[29]Svozil,D.;Kvasnicka,V.;Pospichal,J.Introduction to multi-layer feed-forward neural networks. Chemometrics and Intelligent Laboratory Systems Vol.39,No.1,43–62,1997.
[30]Vedaldi,A.;Lenc,K.Matconvnet:Convolutional neural networks for MATLAB.In:Proceedings of the 23rd ACM International Conference on Multimedia, 689–692,2015.
[31]Vedaldi,A.;Fulkerson,B.VLFeat: An open and portable library of computer vision algorithms. In: Proceedings of the 18th ACM International Conference on Multimedia,1469–1472,2010.
[32]Chang,C.-C.;Lin,C.-J.LIBSVM:A library for support vector machines.ACM Transactions on Intelligent Systems and Technology Vol.2,No.3, Article No.27,2011.
Yang Song is currently an ARC Discovery Early Career Researcher Award(DECRA)Fellow at the School of Information Technologies, the University of Sydney,Australia.She received her Ph.D.degree in computer science from the University of Sydney in 2013.Her research interests include biomedical imaging informatics,computer vision,and machine learning.
Qing Li is currently an M.Phil. research student at the School of Information Technologies, the University of Sydney, Australia. His research area is deep learning in computer vision and biomedical imaging.

Dagan Feng received his M.E.degree in electrical engineering&computer science(EECS)from Shanghai Jiao Tong University in 1982,M.S.degree in biocybernetics and Ph.D.degree in computer science from the University of California,Los Angeles(UCLA)in 1985 and 1988 respectively,where he received the Crump Prize for excellence in medical engineering.Prof. Feng is currently the head of the School of Information Technologies and the director of the Institute of Biomedical Engineering and Technology,the University of Sydney, Australia. He has published over 700 scholarly research papers,pioneered several new research directions,and made a number of landmark contributions in his field. Prof.Feng’s research in the areas of biomedical and multimedia information technology seeks to address the major challenges in big data science and provide innovative solutions for stochastic data acquisition,compression, storage,management,modeling,fusion,visualization,and communication.Prof.Feng is a Fellow of the ACS,HKIE, IET,IEEE,and Australian Academy of Technological Sciences and Engineering.

Ju Jia Zou received his B.S.and M.S. degrees in radio-electronics from Zhongshan University (also known as Sun Yat-sen University) in Guangzhou,China,in 1985 and 1988,respectively,and Ph.D.degree in electrical engineering from the University of Sydney,Australia,in 2001. Currently,he is a senior lecturer at the School of Computing,Engineering and Mathematics,Western Sydney University,Australia.He was a research associate and then an Australian postdoctoral fellow at the University
of Sydney from 2000 to 2003.His research interests include image processing,pattern recognition,computer vision, and their applications.He has been a chief investigator for a number of projects funded by the Australian Research Council.He is a member of the IEEE.

Weidong Cai received his Ph.D.degree in computer science from the Basser Department of Computer Science,the University of Sydney,in 2001. He is currently an associate professor at the School of Information Technologies, and the director of the Multimedia Laboratory,the University of Sydney. He was a lead investigator/visiting professor on medical image analysis and medical computer vision in the Surgical Planning Laboratory (SPL),Harvard Medical School, during his 2014 SSP.His research interests include medical image analysis,image/video processing and retrieval, bioimaging informatics, computational neuroscience, computer vision&pattern recognition,and multimedia computing.
Open Access The articles published in this journal are distributed under the terms of the Creative Commons Attribution 4.0 International License(http:// creativecommons.org/licenses/by/4.0/), which permits unrestricted use,distribution,and reproduction in any medium,provided you give appropriate credit to the original author(s)and the source,provide a link to the Creative Commons license,and indicate if changes were made.
Other papers from this open access journal are available free of charge from http://www.springer.com/journal/41095. To submit a manuscript,please go to https://www. editorialmanager.com/cvmj.
© The Author(s)2016.This article is published with open access at Springerlink.com
 Computational Visual Media2016年4期
- Computational Visual Media的其它文章
- User controllable anisotropic shape distribution on 3D meshes
- Computational design of iris folding patterns
- A computational model of topological and geometric recovery for visual curve completion
- Modified filtered importance sampling for virtual spherical Gaussian lights
- Weighted average integration of sparse representation and collaborative representation for robust face recognition
- LSTM-in-LSTM for generating long descriptions of images
