A computational model of topological and geometric recovery for visual curve completion
Hongwei Lin(),Zihao Wang,Panpan Feng,Xingjiang Lu,and Jinhui Yu
Research Article
A computational model of topological and geometric recovery for visual curve completion
Hongwei Lin1,2(),Zihao Wang1,Panpan Feng2,Xingjiang Lu1,and Jinhui Yu2
Visual curve completion is a fundamental problem in understanding the principles of the human visual system.This problem is usually divided into two problems:a grouping problem and a shape problem. On one hand,though perception of the visually completed curve is clearly a global task(for example, a human perceives the Kanizsa triangle only when seeing all three black objects),conventional methods for solving the grouping problem are generally based on local Gestalt laws.On the other hand,the shape of the visually completed curve is usually recovered by minimizing shape energy in existing methods. However,not only do these methods lack mechanisms to adjust the shape of the recovered visual curve using perceptual,psychophysical,and neurophysiological knowledge,but it is also difficult to calculate an explicit representation of the visually completed curve.In this paper,we present a systematic computational model for generating a visually completed curve.Firstly,based on recent studies of perception,psychophysics,and neurophysiology,we formulate a grouping procedure based on the human visual system by seeking a minimum Hamiltonian cycle in a graph,solving the grouping problem in a global manner.Secondly,we employ a Bézier curve-based model to represent the visually completed curve. Not only is an explicit representation deduced,but we also present a means to integrate knowledge from related areas,such as perception,psychophysics,and neurophysiology,and so on.The proposed computational model has beenvalidated using many modal and amodal completion examples,and desirable results were obtained.
1 School of Mathematical Science,Zhejiang University, Hangzhou 310027,China.E-mail:H.Lin,hwlin@zju. edu.cn();Z.Wang,wzhgc007@qq.com;X.Lu,xjlu@ zju.edu.cn.
2 State Key Laboratory of CAD&CG,Zhejiang University, Hangzhou 310058,China.E-mail:P.Feng,fengpanpan@ zjucadcg.cn;J.Yu,jhyu@cad.zju.edu.cn.
Manuscript received:2016-02-25;accepted:2016-04-18
modal completion;amodal completion;grouping problem; shape problem;human visual system
1 Introduction
When a human sees an object with boundary fragments,such as the Kanizsa triangle in Fig.1(a), the human visual system fills in the missing parts between boundary fragments,making observer perceive a complete object. This phenomenon is called visual curve completion,and understanding it is fundamental to understanding the mechanisms of the human visual system[1].Geometrically,the shape of the completed visual curve is determined by the dominant points,including feature points in the boundary fragments,and end points of the boundary fragments.Generally,there are two kinds of visual curve completion problem. When the boundary fragments are generated by occlusion,completion is called amodal[2](see Fig.1(b));while when the object is illusory and its boundary is subjective, completion is known as modal[3](see Fig.1(a)).
It is widely recognized that there are two problems in visual curve completion:the first is the grouping problem,and the second is the shape problem[4]. While the grouping problem determines which two end points of the boundary segments can be paired to form a visual boundary segment,the shape problem generates the shape of the visual boundary segment. In other words,the grouping problem recovers the topological structure from the end points of the boundary segments,i.e.,which two end points are adjacent to each other,and the shape problem
retrieves the geometric shape of the visual boundary segment.
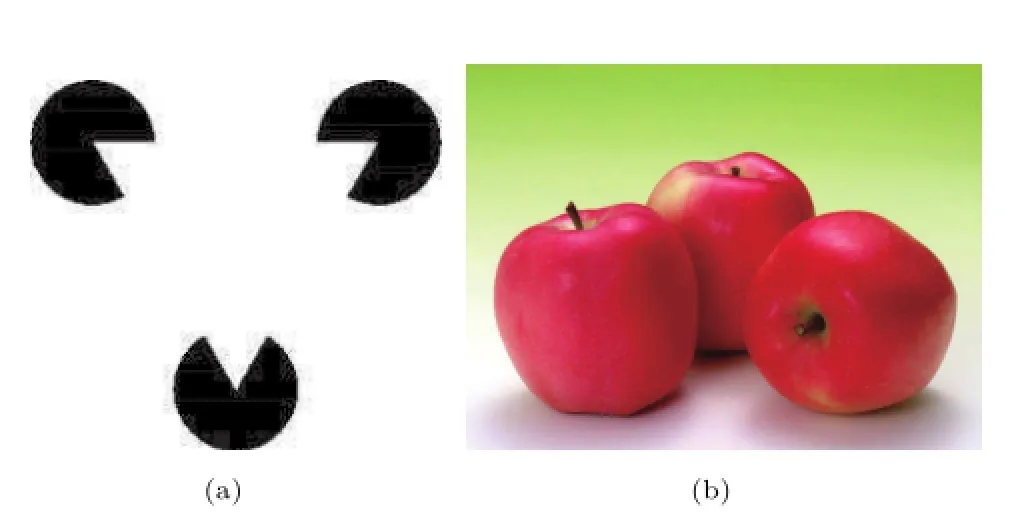
Fig.1 Modal completion and amodal completion.(a)Kanizsa triangle:an example of modal completion.(b)An example of amodal completion.
Conventional methods for solving the grouping problem are usually based on the Gestalt grouping laws [5], such as the principle of nonaccidentalness[6]and relatability[7].These rely on local geometric properties,including proximity, similarity,continuity of direction,good continuation, tendency to convexity,closure,shared regions,and connectedness,to determine which end points can be paired.However,visual curve completion, especially the grouping problem,is clearly not performed locally by the human visual system. Take the Kanizsa triangle illustrated in Fig.1(a) as an example. If one black object in Fig.1(a) were occluded,we would not think that the other two black objects form an illusory shape. The Kanizsa triangle in Fig.1(a)appears only when we see all three black objects.Therefore,visual curve completion is global behavior,and local grouping laws do not embody the true working of the human visual system.
Recent neurophysiological studies have shown that curve completion is predominantly an early visual process[4].It takes place as early as the primary visual cortex(or V1),which contains orientationselective cells in all orientations(and at various scales)for all retinal positions or for each“pixel”in the visual field.In the so-called ice cube model, V1 is continuously divided into full-range orientation hypercolumns,each associated with a different image (or retinal)position[8].The orientation-selective neurons in two hypercolumns are able to interact through long-range horizontal connections[9,10]to facilitate contextual computations.
Actually,the orientation-selective neurons and the connections between them topologically constitute a graph structure[11],with the orientation-selective neurons acting as vertices and the long-range horizontal connections between them acting as edges. Because each dominant point of a boundary segment in the grouping problem is a“pixel”in the visual field and corresponds to an orientation-selective neuron, the dominant points and the possible connections between them accordingly make up a graph.This graph takes the dominant points as vertices and the possible connections between them as edges. Because the significance of each edge(connection) in the grouping problem is different,the edges in the graph should be weighted according to rules deduced by perceptual,psychophysical,and neurophysiological studies,turning the graph into a weighted graph.
Therefore,the grouping problem can be solved by seeking a cycle in the weighted graph that satisfies the following conditions(refer to Fig.2):
·the cycle visits each vertex exactly once;
·the sum of the weights of the edges in the cycle is a minimum,and
·the edge between an end point and a feature point, or between two adjacent feature points,along a boundary segment is constrained in the cycle.
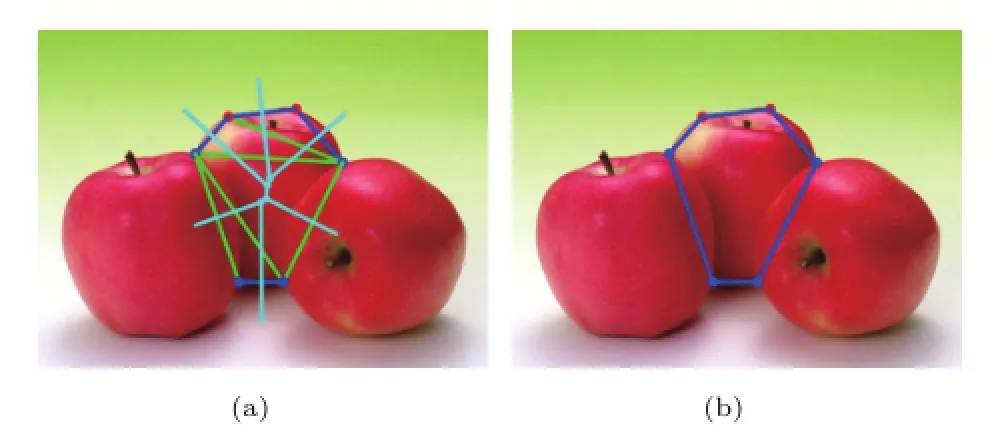
Fig.2 Voronoi diagram,constrained Delaunay triangulation, and constrained minimum Hamiltonian cycle.(a)Voronoi diagram and constrained Delaunay triangulation(CDT).In this figure,the diagram in light blue is the Voronoi diagram. Its dual graph is the constrained Delaunay triangulation,in which the red points are the feature points,the blue points are the end points,and the line segments in blue are the constrained edges.(b)Constrained minimum Hamiltonian cycle(CMHC).The two end points of two different boundary segments can be paired by their adjacency relationship in the CMHC.
A cycle with such properties is called a constrained minimum Hamiltonian cycle[11](CMHC),in which the topological structure of the end points of the boundary segments (i.e., the adjacency relationship between the end points of different boundary segments)can be recovered by the connections of the end points.If two end points
in two different boundary segments are adjacent, they are paired,and a visual curve is formed between them.In this way,the grouping problem is solved in a global manner.Moreover,the solution based on a CMHC supports the Gestalt theory that the principles of perception are the outcome of“development in the direction of minimum energy”[12].The proposed computational model for solving the grouping problem has been applied in both amodal and modal completion,resulting in desirable solutions.
After determining the adjacency relationships of the end points,the next problem is to recover the shape of the visual curve between pairs of end points. In the shape recovery problem,all we have is a two-dimensional image. However, the generation of the shape in the image is a complicated procedure,influenced by a number of factors including the reflection and refraction of the medium,the imaging system,and the human visual system.They are difficult to model entirely mathematically.A practical approach is to introduce a factor that reflects the influences of the aforementioned elements on the visual curve generation model,adjusting its shape. However, traditional methods have constructed the visually completed curve mainly by minimizing an energy function[13–15],such as total curvature or total change in curvature,or by flow evolution[16].Once the shape of the visual curve has been generated, it cannot be changed.Critically,the shape of the visual curve that is produced by most traditional methods often deviates from the real shape[17, 18]. Although the method proposed in Ref.[4] introduces a factor to adjust the shape of the visually completed curve,the visual curve is produced by a numerical method,and its closed form representation is hard to generate.This makes the computation complicated,and analysis of the visually completed curve inconvenient.
In the human visual system,the shape of the visually completed curve between each pair of end points is mainly suggested by the two outward tangent vectors of the two boundary segments at their end points. Coincidentally,the shape of a cubic Bézier curve[19],which is widely employed in geometric design,is predominantly determined by its tangent vectors at its end points. In this paper,we thus use a Bézier curve-based visual curve construction method.The cubic Bézier curve P(t), with the constraint that P(t)is tangent to the two boundary segments at their end points,is generated by minimizing an energy function,which is designed by taking knowledge from perception,psychophysics, and neurophysiology into account.
The benefit of using a Bézier curve is that a closed form solution to the constrained minimization problem described above can be deduced,giving an explicit representation of the visually completed curve. Due to the explicit representation,new principles that are proposed for the visually completed curve generation can be verified easily. Moreover,the Bézier curve-based model presents an opportunity to integrate knowledge from related areas,such as perception,psychophysics,and neurophysiology,by introducing a function and a weight in the energy to be minimized.By choosing an appropriate weight and function by taking into account the complicated imaging procedure, especially the perceptual, psychophysical, and neurophysiological principles,the shape of the visually completed curve can be made more and more faithful to the real shape.
The rest of this paper is organized as follows.In Section 1.1,related work is briefly reviewed. In Section 2,we develop a graph theory-based model, based on recent perceptual,psychophysical,and neurophysiological studies,to solve the grouping problem.In Section 3,a Bézier curve-based model is presented to calculate the shape of a visually completed curve,by integrating knowledge from perception,psychophysics,and neurophysiology in the energy function.After presenting and discussing the results of the application of the proposed systematic computational model to modal and amodal completion in Section 4,this paper is concluded in Section 5.
1.1 Related work
In this section,we briefly review related work on grouping and visual curve generation methods.
Grouping. As stated above,many grouping methods are based on the Gestalt laws[20], including the principle of proximity,continuity of direction,good continuation,connectedness,etc. Specifically,the good continuation law was employed in Ref.[21]to develop a perceptual organization model for a restricted domain of patterns with
minimal regularity.By incorporating the inducer configuration with distance information,as well as the relative probability of perceiving an organization, dots on a lattice grid were grouped by the proximity law[22,23].
The principle of non-accidentalness,introduced in Refs.[6,24],claims that every spatial relation which is unlikely to have arisen by accident should create a group. Based on this principle,Desolneux et al.[25,26]formulated the Gestalt grouping laws as independent detectors for geometrical events.
The other commonly used criterion is relatability law,which is defined in terms of whether or not the linear extensions of the inducing contour intersect, and whether the interior angle of intersection is obtuse[7].It has been shown that the relatability law is equivalent to the existence of a smooth curve with no inflection points connecting the two inducers[27].
For more literature on grouping,please refer to Refs.[5,28].As noted,these grouping methods are mainly based on local geometric rules,even though grouping is clearly not performed locally by the human visual system.
Visual curve generation. The biarc curve model[15]was first introduced to generate the visual curve between two inducers.It constructs two circular arcs,usually by solving a one-dimensional nonlinear optimization problem[29];each is tangent both to an inducer and to the other circular arc. Kimia et al.[13]employed Euler spirals to produce the visual curve.By minimizing the total change in curvature,the shortest Euler spiral is selected as the completed visual curve.While the Euler spiral model generates the visual curve by minimizing the total change in curvature,there are other methods that construct the visual curve by minimizing the total curvature,known as the elastica model[30–32]. Recently,the visual curve was constructed by finding minimum-length admissible curves in the unit tangent bundle[4],where a factor was introduced in the numerical solution to adjust the shape of the completed visual curve.Though these methods can produce desirable results in some cases, closed-form solutions are difficult to obtain,and usually only numerical solutions can be found.
Unlike the aforementioned methods, which construct visual curves piece by piece,partial derivative equation(PDE)based models generated visual curves via global evolution.In Ref.[16],a fixation point was selected inside the region bounded by the illusory contour,and then a surface on the image domain was constructed based on the fixation point.The surface was evolved under a speed law dependent on the image gradient,and finally connected to the non-existing edges.In Ref.[33], the illusory surface was determined by minimizing a proposed energy and then selecting the best image organization.Recently,a level-set based model was proposed in Ref.[34]to capture illusory contours regardless of whether the missing boundaries are straight lines or curves.
A stochastic model has also been developed to generate visual curves,by formulating the problem as a random walk in a 3D discrete lattice of positions and orientations[35].
2 Recovery of topological structure
Given several boundary segments,the grouping problem determines which end points taken from two different boundary segments can be paired to form a visual curve between them.This is equivalent to establishing the adjacency relationships of these end points or the topological structure of the visually completed curve.
As is well known,the shape of a curve is mainly influenced by its feature points and end points. We call them dominant points.The feature points embody the salient shape features of the boundary segment,and include any tangent discontinuity points,curvature discontinuity points,or other points that selected interactively.In Fig.2(a), feature points are illustrated in red and end points are illustrated in blue.
As has been described in recent neurophysiological studies,each dominant point of a boundary segment in an image space forms a“pixel”in the visual field;it corresponds to an orientationselective neuron.The orientation-selective neurons in two hypercolumns interact through long-range horizontal connections[9,10].These neurons and the connections between them make up a graph structure.It is most likely that one neuron will be connected to its closest neighbor in some direction. Therefore,for an arbitrary neuron,we need to determine its nearest neighbor along an arbitrary
direction.
Taking these neurons as discrete vertices,an efficient way to solve this computational task is to compute the Voronoi diagram[36]of the discrete vertex set.The Voronoi diagram of a vertex set is composed of a series of Voronoi cells(see Fig.2(a)). Each Voronoi cell cpcorresponds to a vertex p.The Voronoi cell cpconsists of the points which are nearer to the vertex p than to other vertices in the vertex set.Consequently,if one cell c,which corresponds to a vertex,is adjacent to cell cp,is the closest vertex to p in some direction,and they should be connected.Therefore,the connections between these vertices can be constructed by the dual graph of its Voronoi diagram,which is called the Delaunay triangulation[37](see Fig.2(a)).
Let us return to the image space. We need to remember that each neuron corresponds to a dominant point.Similarly,the connections between these dominant points can also be constructed by Delaunay triangulation.It should be noted that, because the end points and feature points belonging to a boundary segment are naturally connected along the boundary segment,the connections between them are constrained in the Delaunay triangulation. For example,the innermost apple in Fig.2(a)has two boundary segments,which are represented by the two blue polylines.While the upper segment contains two feature points in red and the three blue edges are constrained in the Delaunay triangulation, the lower segment has just one blue edge between its end points,and it too is constrained in the Delaunay triangulation.Such a Delaunay triangulation with constrained edges is called a constrained Delaunay triangulation(CDT)[37](see Fig.2(a)). Given a vertex set in the plane together with a set of prescribed noncrossing,straight-line edges,the CDT is that triangulation of the vertices with the following properties:
·it includes the prescribed noncrossing,straightline edges,and
·it is as close as possible to the Delaunay triangulation of the vertex set.
In our implementation, we employed the triangulation source code in CGAL[38]to calculate the CDT,and a result is demonstrated in Fig.2(a).
The so-constructed CDT is a mathematical model of the early visual neurons and possible connections between them,in which each dominant point corresponds to a neuron and each edge corresponds to a possible connection. Undoubtedly,the significance of the edges(possible connections)in the CDT is different in recovering the topological structure.In our model,the significance of the edge is measured by a weight,which can be determined by perceptual,psychophysical,and neurophysiological principles.Because proximity is a basic principle in perceptual theory,as well as in Gestalt theory, we set the weight of each edge as the length of the edge in the image space.The so-selected weights generated desirable results in all of our experiments of modal and amodal completion.The assignment of weight could be further improved by incorporating more visual principles.
Thus,we obtain a weighted graph.To recover the topological structure,we need to calculate a cycle that visits each vertex of the graph exactly once and visits the constrained edges. This is a constrained Hamiltonian cycle.However,there can be many constrained Hamiltonian cycles in a graph. Based on the Gestalt theory that the principles of perception are the outcome of“development in the direction of minimum energy”[12],we chose the Hamiltonian cycle with the minimum weight sum,which is called the CMHC,as the topological structure of the dominant points.The problem of seeking the minimum Hamiltonian cycle is actually the traveling salesman problem,which is solved by a dynamic programming approach[39]in our implementation.
Figure 2(b)illustrates a CMHC,in which the two adjacent end points of two different boundary segments are paired. Moreover,a visual curve is generated between the two paired end points.
It is worth mentioning that the assignment of appropriate weights to the edges of the CDT is a key factor in generating the correct CMHC.In this paper,the lengths of the edges are assigned as the weights,which lead to correct CMHCs in all of our experiments.However,if the assignment of weights is inappropriate,incorrect CMHCs will be generated. For example,Fig.10(b)illustrates the correct CMHC with edge lengths as weights.However,if uniform weights are assigned to the edges of the CDT as in Fig.10(b),there will be more than ten thousand CMHCs,and only one of them is correct.In Fig.3,
two such incorrect CMHCs are illustrated.Please compare them with the correct CMHC in Fig.10(b), which is the sole CMHC of the weighted CDT with edge lengths as weights.
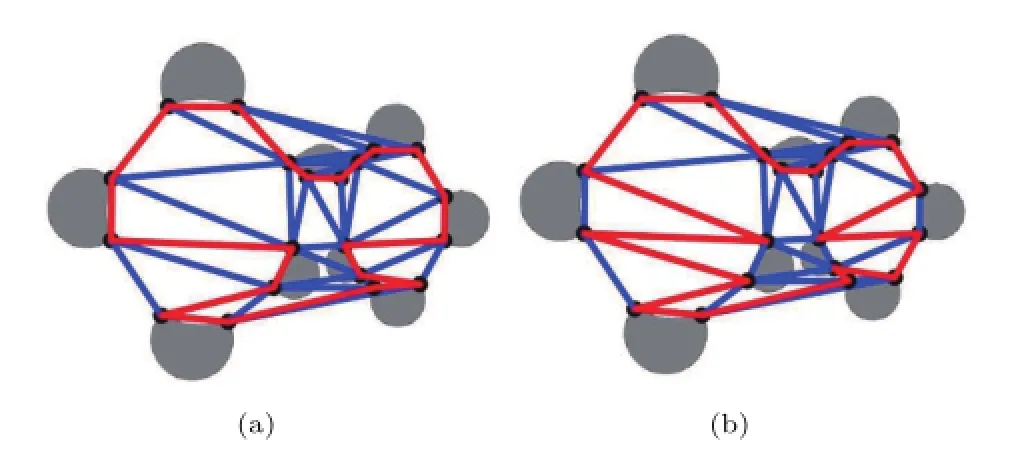
Fig.3 Two incorrect CMCHs.If we assign uniform weights to the edges of the CDT,there will be more than ten thousand CMCHs. Only one of them is correct,and the others are all incorrect.
3 Recovery of geometric shape
With the CMHC,the topological structure of the dominant points can be recovered:the end points of different boundary segments can be paired.We next consider the shape problem,determining the geometric shape of the visual curve between these paired end points.
Based on the findings of neurophysiological studies,an image contour is represented in V1 as an activation pattern of all of the cells that correspond to the oriented tangents along the curve’s arclength[4].This means that the tangent vectors at the end points of the boundary segment play an important role in recovering the shape of a visual curve.Because the shape of a cubic Bézier curve is determined by its tangent vectors at its two end points,we use a Bézier curve that interpolates the the tangent vectors of two boundary segments at their two end points to represent the shape of a visual curve.
A Bézier curve is a fundamental tool in geometric design[19]. It is generated by blending a set of Bernstein basis functions and a series of control points which make up a control polygon.The shape of a Bézier curve is controlled by its control polygon. It interpolates the two end points of its control polygon,and it is tangent to the two end edges of its control polygon at its two end points.Figure 4 illustrates in blue a cubic Bézier curve with four control points;its control polygon is shown in purple.
Suppose the end points are P0and P3,and the unit tangent vectors of two boundary segments at the end points are v0and v3,respectively.To generate the Bézier curve-represented visually completed curve,
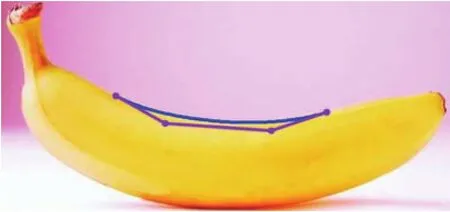
Fig.4 A Bézier curve(blue)and its control polygon(purple).


Therefore,the problem of calculating the control points P1and P2is transformed into how to determine l0and l3in Eq.(2).From the principles of perception in Gestalt theory,that is,the outcome of“development in the direction of minimum energy”[12],we model this problem as an energy minimization problem.
The objective function to be minimized should take account of the following factors.Firstly,the visual curve should be smooth,which is ensured by minimizingSecondly, the shape of the visual curve is affected by both the angleformed by the two vectorsand v0,and the angleformed by the two vectorsand v3.The larger the angles,the longer the two lengths l0and l3. This objective is attained by minimizing the following energy: where the function f is taken as f(x)=x,and L is the length of the line segment P0P3.

Combining these two factors gives the objective function to be minimized:
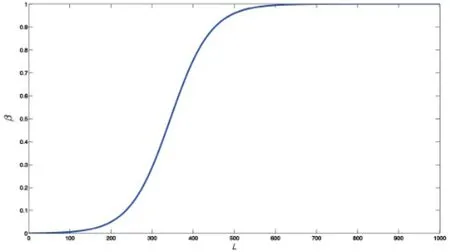
Fig.5 The curve of the sigmoid function β(L)(Eq.(5)).
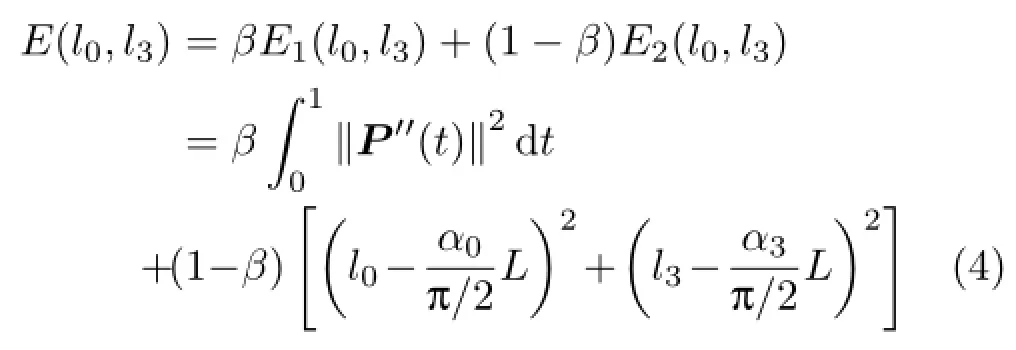
where β is a weight.With fixed angles α0and α3, the larger the weight β,the shorter the two lengths l0and l3that result,and the flatter the shape of the curve(see Figs.6(b)and 7(a)).
Note that the shape of the visual curve is also related to the length L of the line segment P0P3. The longer L,the shorter the two lengths l0and l3, and the smoother the curve P(t)(Eq.(1))appears. To incorporate this effect into the objective function (Eq.(4)),the weight β is chosen as a sigmoid function[40]of L,i.e.,
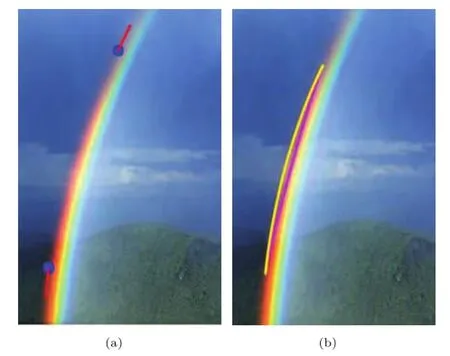
Fig.6 Generation of a visually completed curve.(a)The two end points(blue)of a visual curve and the two end tangent vectors(red). (b)Two visually completed curves with different β weights,β=0 (yellow curve),and β=0.1899(purple curve).Larger β leads to shorter l0and l3,and a flatter generated visual curve.The visual curve with β=0.1899 more faithfully conforms to the real shape of the edge of the rainbow.
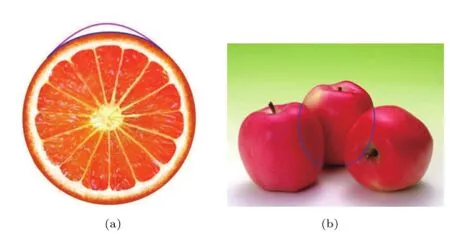
Fig.7 Generating a desirable visually completed curve by minimizing the energy function(Eq.(4)).(a)Two visually completed curves with different β weights,β=0(purple)and β=0.6225 (black).The black curve with β=0.6225,generated by Eq.(5), is more desirable as it conforms to the actual shape better.(b)The visually completed curves with β=0.3018(left)and β=0.3233 (right)for the amodal completion example shown in Fig.1(b).

where a=0.0203,b=6.9848.To determine the two constants a and b in Eq.(5),we selected two visual curves to be completed,the right curve in Fig.7(b),and the leftmost curve in Fig.12(b), and manually adjusted the weight β in Eq.(4) until a desirable visual curve was generated by minimizing Eq.(4).This gave two pairs of numbers for(L,β(L)),(307.70,0.3233)and(106.76,0.0080). Making the sigmoid function(Eq.(5))interpolate the two pairs of numbers requires a=0.0203,b= 6.9848(see Table 1). The so-generated sigmoid function β(L)(Eq.(5))works well for all of other visual curve completion examples illustrated in this paper.Figure 5 shows the sigmoid function β(L). It is a monotonically increasing function:the longer the length L,the larger β(L),so the shorter the two lengths l0and l3,if the two angles α0and α3are fixed.
Minimizing the energy objective function in Eq.(4) leads to explicit formulae for l0and l3:

where

The derivation of the formulae for l0and l3can be found in Section 3.1.
In this way,the explicit representation of the visually completed curve(Eq.(1))is generated. In all of our experimental examples,the Bézier curve-based model generated a visual curve whose shape faithfully conforms to the given boundary segment. Moreover,the explicit representation makes it is very easy to verify the proposed perceptual,psychophysical,and neurophysiological principles for the generation of visually completed curve. More importantly,new knowledge from perceptual,psychophysical,and neurophysiological fields could be integrated into the developed Bézier curve-based model by improving the functions f(α) in Eq.(3)and β(L)in Eq.(4).
Figure 6 illustrates the geometric shape recovery method presented in this paper.Two end points (blue)of a visual curve are selected,and two tangent vectors(red line segments)at these two points of the boundary curve of the rainbow are generated.Two visual curves,with β=0 and β=0.1899,are shown, demonstrating the effect of the weight β in Eq.(4). The larger the weight β,the shorter the two lengths l0and l3,and the flatter the shape of the generated visual curve.The shape of the purple visual curve with β=0.1899,generated by the sigmoid function in Eq.(5),is in agreement with the actual boundary of the rainbow.
Figure 7(a)demonstrates another example where two visual curves with β=0 and β=0.6225 are generated.We can see that the black curve with β= 0.6225 conforms to the boundary of the orange very well.Moreover,the two blue curves in Fig.7(b)are reasonable visually completed curves for the amodal completion example presented in Fig.1(b),with β= 0.3018(left curve)and β=0.3233(right curve).
The cubic Bézier curve based-model can generate two types of visual curves:C-shaped and S-shaped curves.The examples in Figs.6 and 7 are C-shaped curves.An S-shaped curve is demonstrated in Fig.8;Fig.8(a)has β=0.0711,while Fig.8(b)shows the same visual curve and its control polygon.
Based on these examples,it can be concluded that:
·With fixed angles α0and α3,the larger the weight β(defined in Eq.(4)),the flatter the shape of the visually completed curve,while the lower β,the more the curve bends.
·A reasonable visually completed curve can be generated by choosing an appropriate weight function β(L)(Eq.(5)).
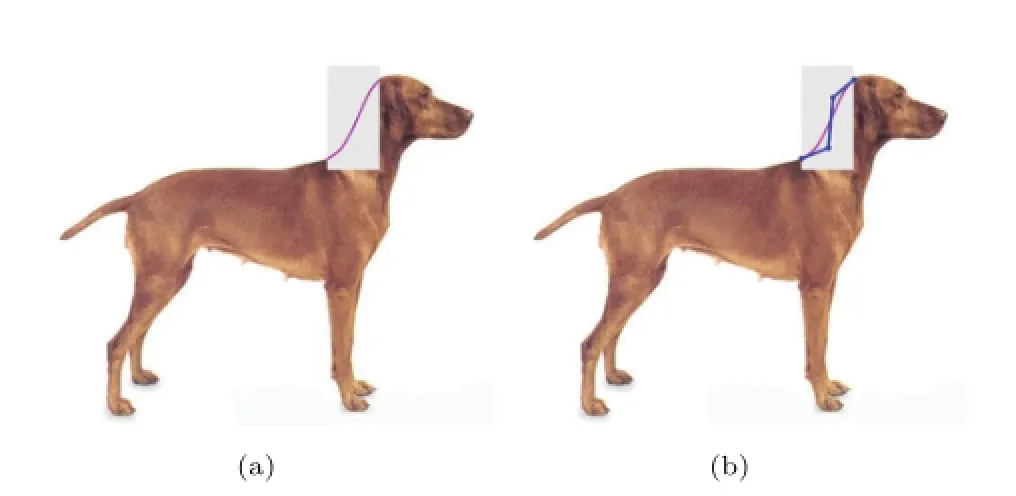
Fig.8 Generating an S-shaped visual curve using the Bézier curvebased model.(a)An S-shaped visual curve with β=0.0711.(b)The same S-shaped visual curve and its control polygon(blue).
·Our Bézier curve-based model provides an extensible model into which new knowledge from perception,psychophysics,and neurophysiology can be integrated by improving the functions f(α) in Eq.(3)and β(L)in Eq.(4).
3.1 Derivation of l0and l3
We now derive the formulae for l0and l3in Eq.(6). Suppose the Bézier curve-represented visually completed curve is

P1=P0+l0v0
P2=P3+l3v3
where v0and v3are two unit tangent vectors.To determine P1and P2,we need to derive formulae for l0and l3.They are obtained by minimizing the following energy function:
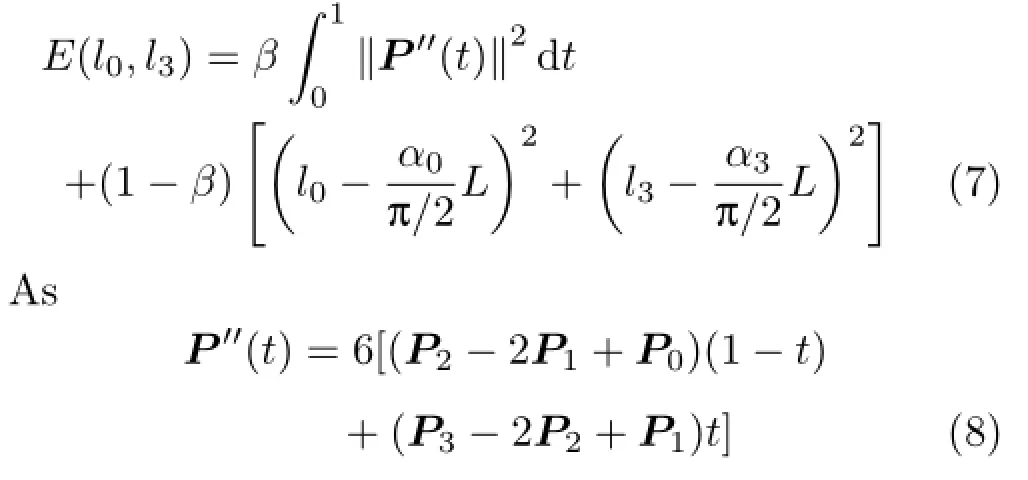
substituting Eq.(8)into Eq.(7),together with==1,we have
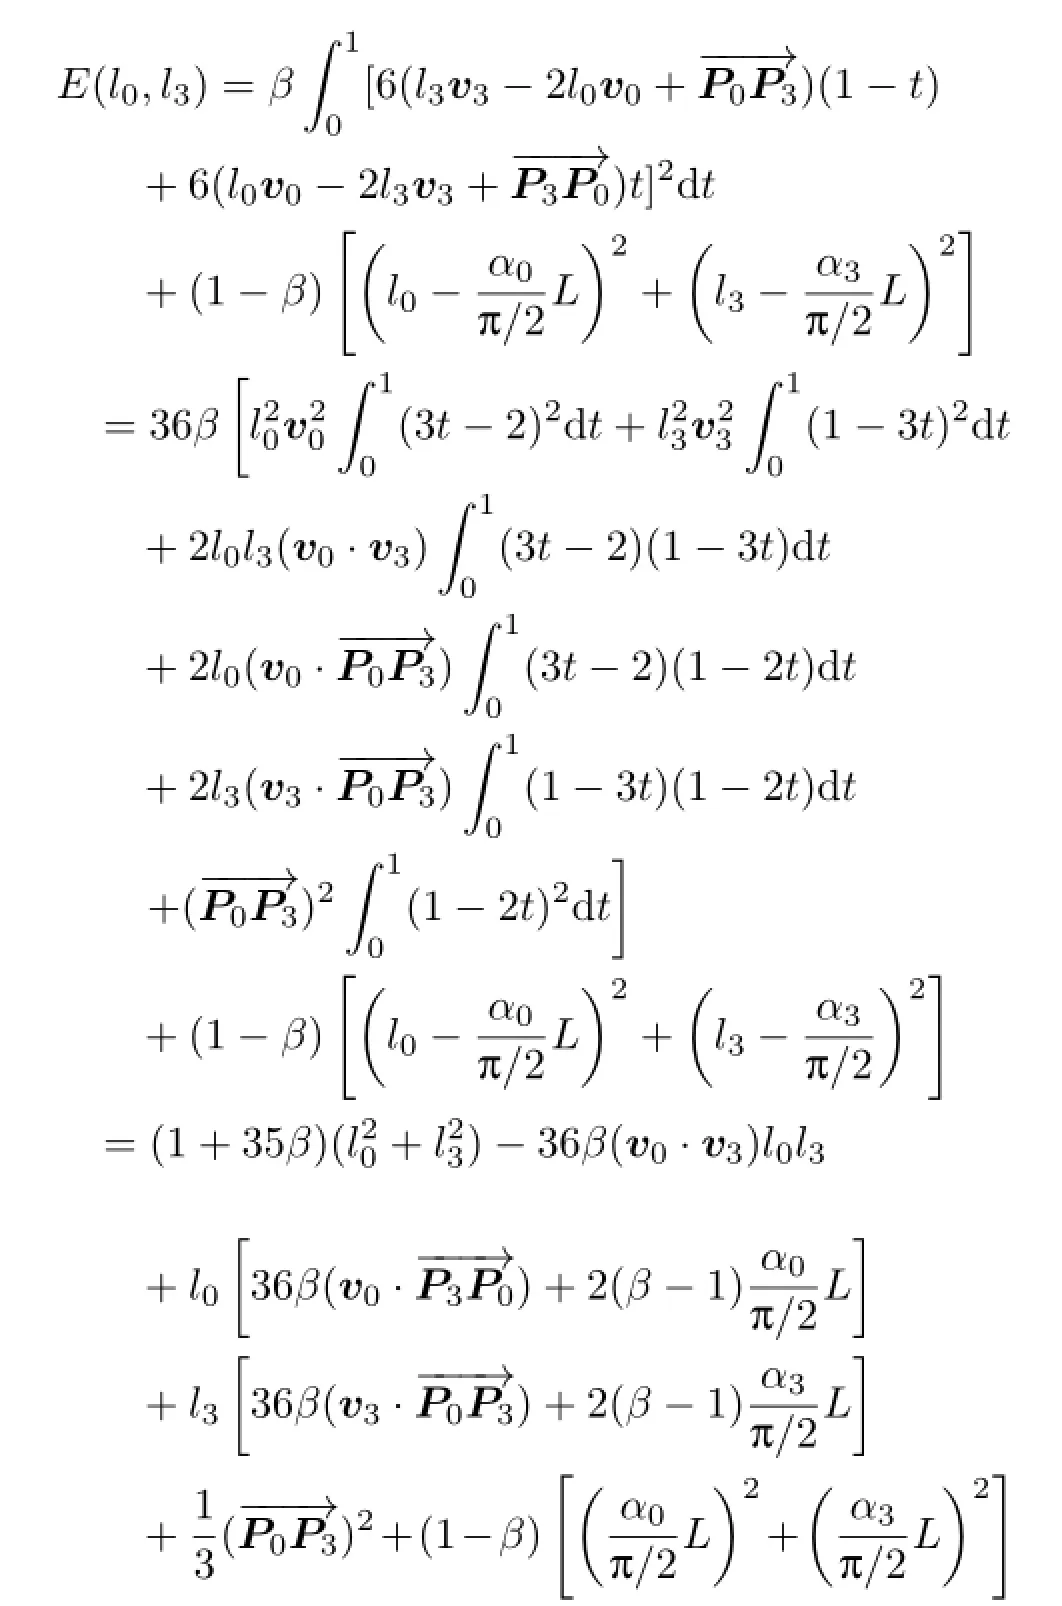
Thus,E(l0,l3)is a quadratic function of l0and l3. Differentiating with respect to l0and l3leads to a pair of linear equations:
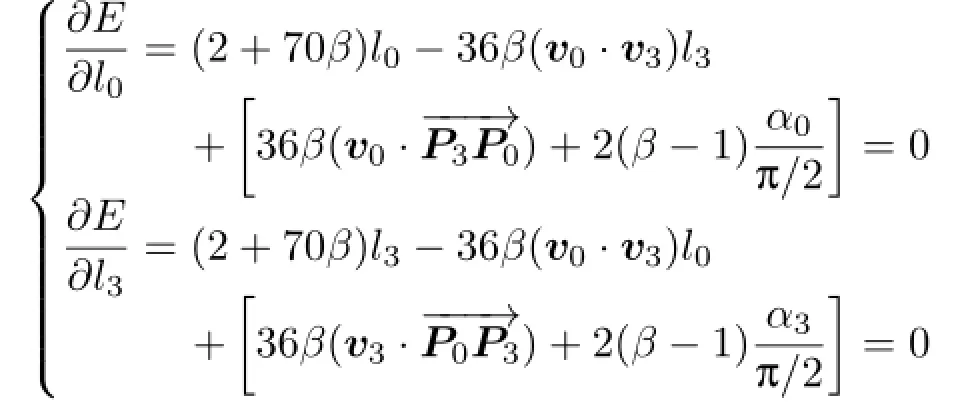
Explicit formulae for l0and l3can be obtained by solving the above linear system(refer to Eq.(6)).
4 Results and discussion
In the following,we present some examples of modal and amodal completion determined by our systematic computational model.Figures 9 and 10 are two modal completion examples;Figs.11 and 12 are two amodal completion examples.The lengths L and the corresponding weights β(L)for these examples are given in Table 1.
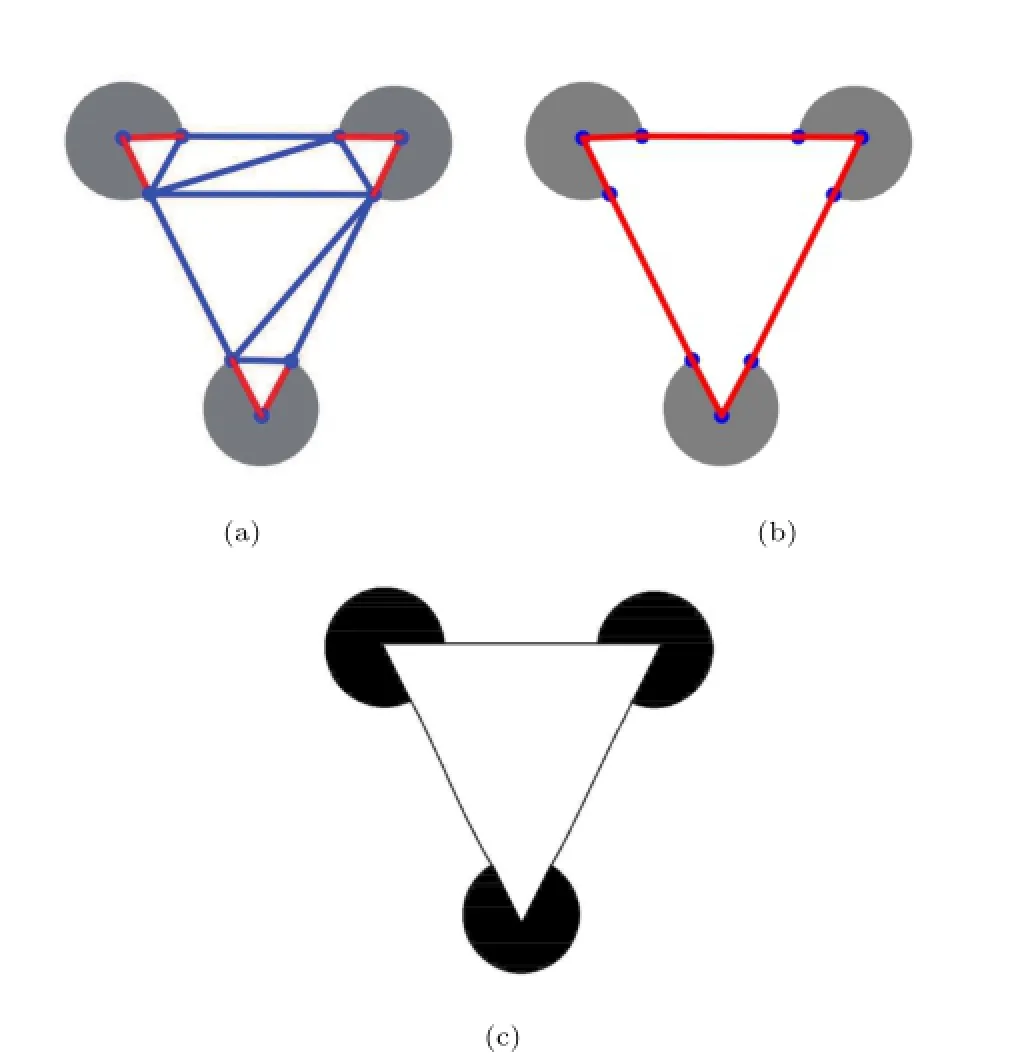
Fig.9 Visual curve completion for a Kanizsa triangle.(a)CDT and the constrained edges(red).(b)CMHC:the two end points of two different boundary segments are paired through their adjacency relationships in the CMHC.(c)The visually completed curves.
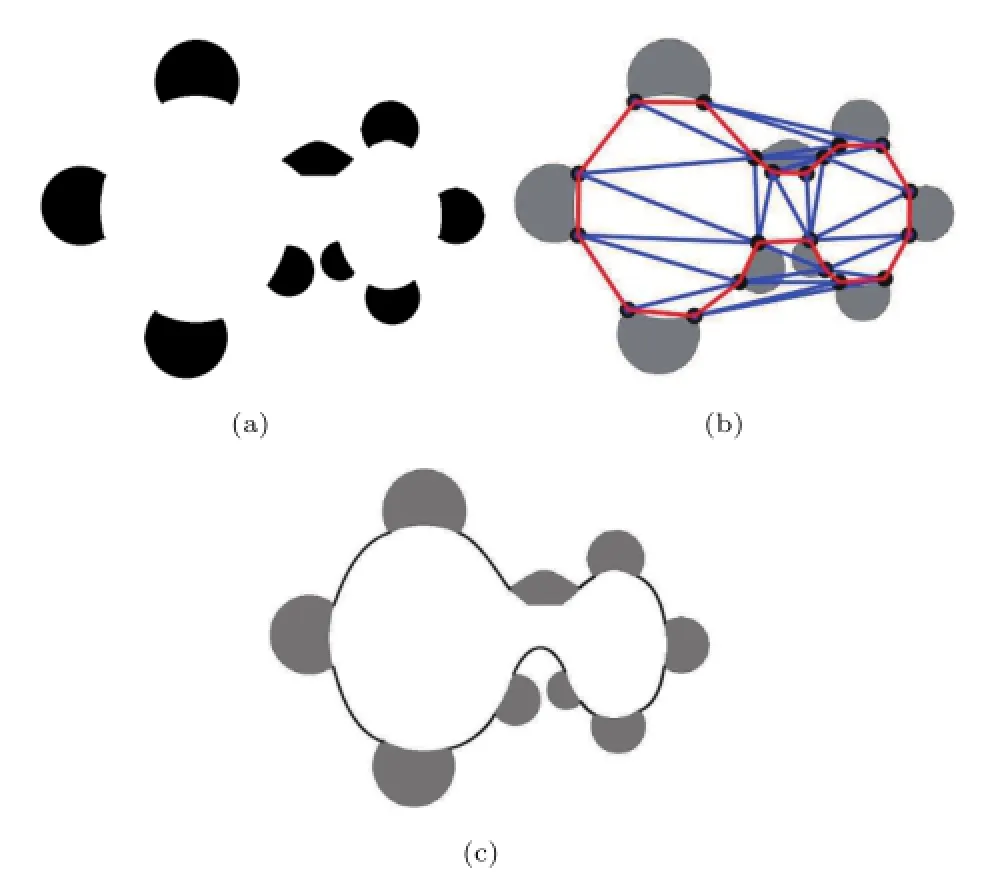
Fig.10 Visual curve completion for a dumb bell model.(a)The original dumb bell model.(b)CDT and CMHC(red).(c)The visually completed curves.
In Fig.9,the Kanizsa triangle is completed.In this example,there are three boundary segments, whose corresponding edges(red)are constrained in the CDT(see Fig.9(a)).Furthermore,the CMHC is sought(see Fig.9(b)),and the two adjacent end points in the CMHC are paired.Finally,three visual curves are constructed between the three pairs of end points(see Fig.9(c)).

Table 1 The length L(the distance between the pixels at the end points of a line segment)and the value of β(L)used in the visual curve completion examples
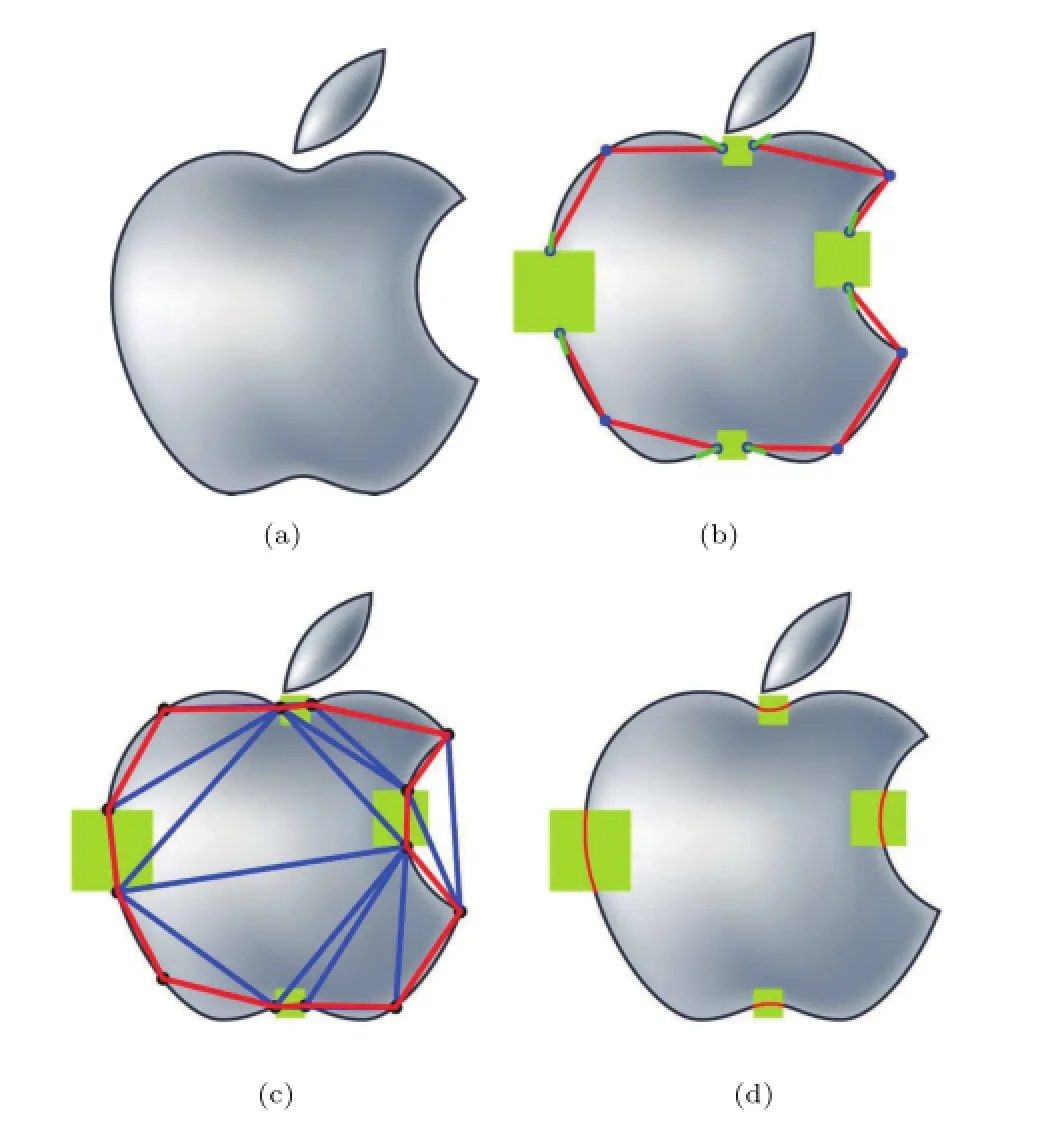
Fig.11 Visual curve completion for an artificially occluded model. (a)The Apple logo.(b)The artificially occluded Apple logo.Red edges are constrained edges;green line segments indicate tangent vectors at the end points.(c)CDT and CMHC(red).(d)Four visually completed curves(red).
Figure 10 is a further example of modal completion.Figure 10(a)shows a dumb bell model. Fig.10(b)illustrates the CDT of the end points of the boundary segments and the CMHC(red),by which the end points are paired.Between each pair of end points,a piece of visual curve is constructed and represented by a Bézier curve.All of the visually completed curves and the existing boundary segments constitute the whole boundary of a dumb bell(see Fig.10(c)).
Figure 11 is an example of amodal completion of an artificially occluded shape.The original Apple logo is illustrated in Fig.11(a);it is artifically occluded in Fig.11(b),where red edges are constrained edges and the short green line segments indicate the tangent vectors at the end points of the boundary segments.After calculating the CDT and CMHC (see Fig.11(c)),the end points of the boundary segments can be paired.Finally,four visual curves (red)(Fig.11(d))are constructed between the four pairs of end points.
The final example in Fig.12 shows naturally occluded amodal completion.Figure 12(a),shows the CDT and CMHC.In Fig.12(b),three visual curves are constructed,with β=0.0282,β=0.0080, and β=0.0028.It can be seen that they agree with the shape of the existing boundary segments.
The lengths L and the corresponding β(L) employed in the visual curve completion examples are listed in Table 1.For Fig.6(b),only the data for the curve in purple are listed;for Fig.7(a),only the data for the curve in black are listed.For Fig.7(b), the data for the left curve and right curve are listed. For the three visually completed curves in Fig.9(c), the data are arranged in the order:left curve,right curve,top curve. For the curves in Figs.10(c) and 11(d),the data are listed from the top left curve, counter-clockwise.Finally,for the three curves in Fig.12(b),the data are listed from the rightmost curve,counter-clockwise.
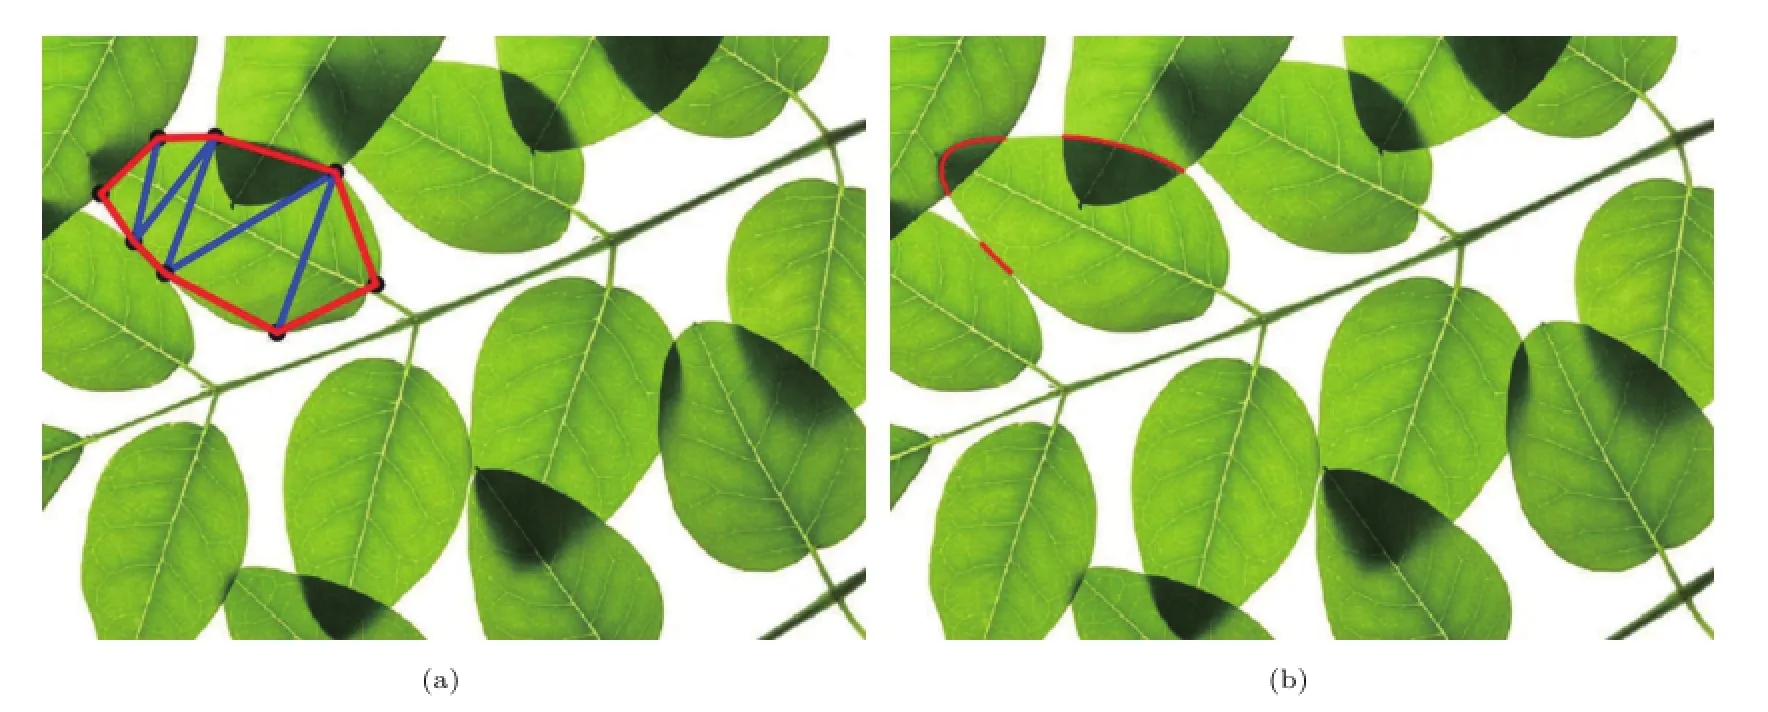
Fig.12 Visual curve completion for a naturally occluded model.(a)CDT and CMHC(shown in red).(b)Three visually completed curves with β=0.0282,0.0080,0.0028,respectively(starting with the rightmost curve in counter-clockwise direction).
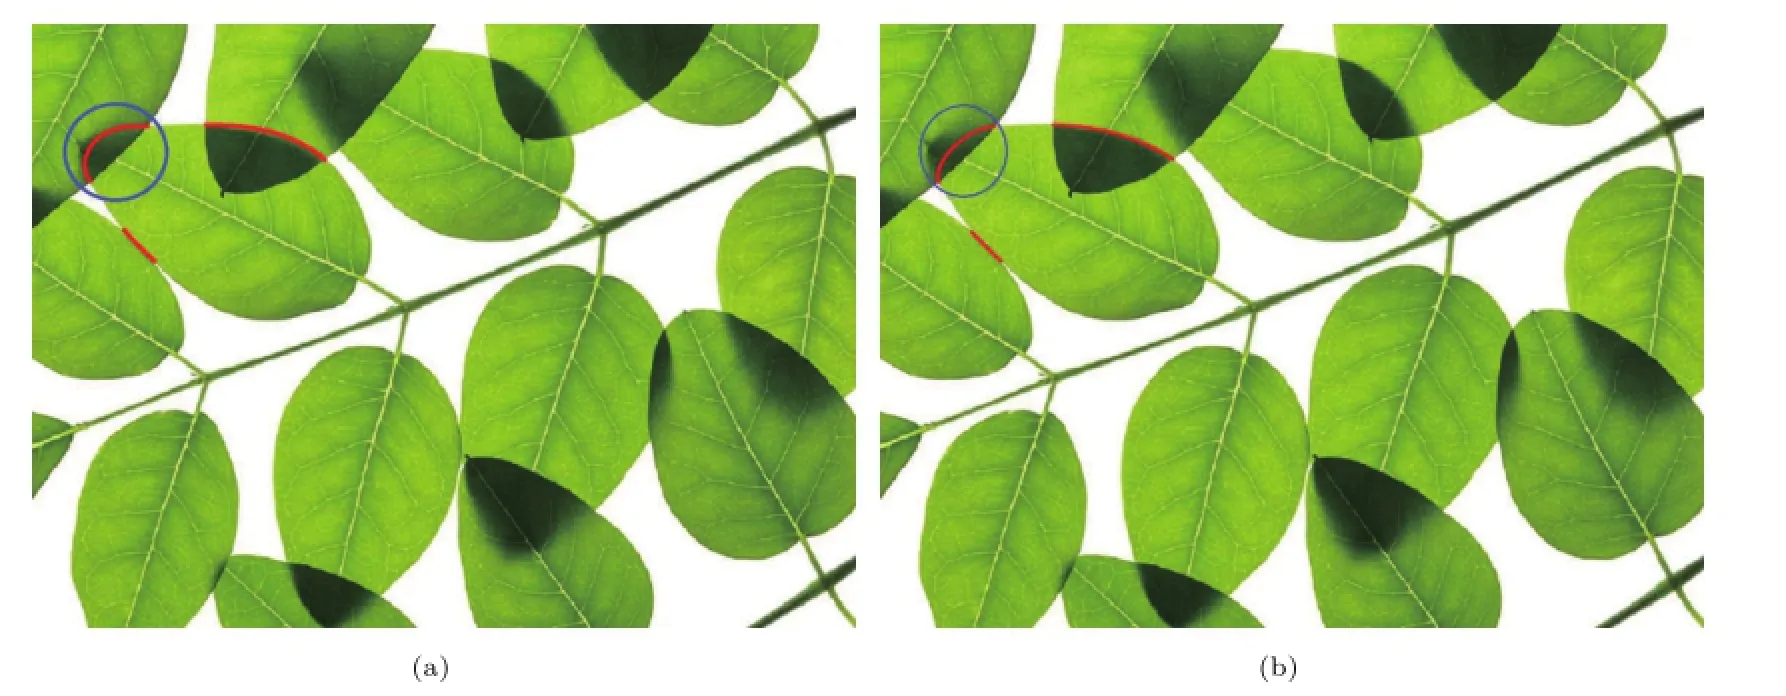
Fig.13 Visual curves generated by(a)the Euler spiral completion method and(b)the tangent bundle-based model.Comparison with Fig.12(b)shows that the visual curves produced by our Bézier curve-based model are more faithful to the real boundaries than those produced by Euler spiral completion and the tangent bundle-based model,particularly the visual curve in the blue circle.
We next compare our Bézier curve-based model with the Euler spiral completion method in Ref.[13]and the tangent bundle-based model in Ref.[4].Figure 13(a)illustrates the visual curves generated by the Euler spiral completion method, using the code1There is a small bug in the downloaded version(downloaded in September 2013):when drawing the Euler spiral with Eq.(6)in Ref.[13],the function sign(γ)is replaced by sin(γ).downloaded from http://www.lems.brown.edu/vision/researchAreas /EulerSpiral/.We also implemented the tangent bundle-based model and performed several experiments with different parameters.The best result generated is demonstrated in Fig.13(b),using k0=14.9511,l=1.11621,φ=-4.03944,and ħ=1.0.Comparing the visual curves generated by our Bézier curve-based model(Fig.12(b)),and those produced by the Euler spiral completion method(Fig.13(a))and the tangent bundle-based model(Fig.13(b)),we can see that our visual curves are more faithful to the real boundaries than those in Fig.13,especially the visual curve in the blue circles in Fig.13.
The above examples demonstrate the capability of the systematic computational model presented in this paper.In all examples,the topological structure of the end points of the boundary segments was correctly recovered by exploiting the adjacency relation of the end points in the CMHC of the graph constructed by CDT.Moreover,a reasonable visual curve that was in agreement with the existing boundary segments was retrieved with a Bézier curve-based model by minimizing the energy function in Eq.(4).It should be pointed out that the weight of the edge in the CDT and the function f (Eq.(3))and the weight β in the energy(Eq.(4))of the Bézier curve-based model could potentially be improved by incorporating new perceptual,psychophysical,and neurophysiological knowledge.
Finally,a user study was performed through the website http://www.sojump.cn.In total 91 participants took part. Table 2 lists the results.We can see that over 75%participants felt Very Satisfied or Satisfied with the examples presented in Figs.6(b)–12(b). In comparison,while 89% participants felt Very Satisfied or Satisfied with the visual curve completion example in Fig.12(b) generated by the computational model developed in this paper,only 70%felt Very Satisfied or Satisfied with the visual curve completion result in Fig.13(a) produced by Euler spiral completion[13],and 47% were Very Satisfied or Satisfied with the visual curve in Fig.13(b)generated by the tangent bundle-based model[4].

Table 2 User study statistics for examples generated by the model developed in this paper (Unit:%)
5 Conclusions
This paper has proposed systematic methods to solve the grouping and curve generation problems in visual curve completion. Firstly,to solve the grouping problem,a CDT is constructed by taking the dominant points as vertices,and the CMHC is sought which traverses every vertex only once. Then,adjacent inducers in the CMHC are paired to generate a visual curve between them.This solves the grouping problem in a global manner.Secondly, we presented a Bézier curve-based model to produce the completed visual curve.Not only is a closedform representation of the visual curve obtained,but also the Bézier curve-based model has the potential to be improved by integrating further perceptual, psychophysical,and neurophysiological knowledge. As a result,the shapes of the generated visual curves are faithful to the boundaries of the occluded or illusory object.
Acknowledgements
This work was supported by the National Natural Science Foundation of China(Grant Nos.61272300, 61379072,61379069),and the Key Technologies R&D Program of China(No.2014BAK09B04).
[1]Kanizsa,G.Subjective contours.Scientific American Vol.234,48–52,1976.
[2]Michotte,A.;Thines,G.;Crabbe,G.A modal completion of perceptual structures.In:Michotte’s Experimental Phenomenology of Perception.Thines, G.;Costall,A.;Butterworth,G.Eds.Psychology Press,140–167,1991.
[3]Kanizsa,G.Organization in Vision:Essays on Gestalt Perception.New York:Praeger,1979.
[4]Ben-Yosef,G.;Ben-Shahar,O.A tangent bundle theory for visual curve completion.IEEE Transactions on Pattern Analysis and Machine Intelligence Vol.34, No.7,1263–1280,2012.
[5]Von Gioi,R.G.;Delon,J.;Morel,J.-M.The collaboration of grouping laws in vision.Journal of Physiology-Paris Vol.106,Nos.5–6,266–283,2012.
[6]Witkin,A.P.;Tenenbaum,J.M.On the role of structure in vision.In:Human and Machine Vision. Beck,J.;Hope,B.;Rosenfeld,A.Eds.New York: Academic Press,481–543,1983.
[7]Kellman, P.J.; Shipley,T.F.A theory of visual interpolation in object perception.Cognitive Psychology Vol.23,No.2,141–221,1991.
[8]Hubel,D.H.;Wiesel,T.N.Ferrier lecture:Functional architecture of macaque monkey visual cortex.In: Proceedings of the Royal Society of London.Series B, Biological Sciences,1–59,1977.
[9]Bosking,W.H.;Zhang,Y.;Schofield,B.;Fitzpatrick, D.Orientation selectivity and the arrangement of horizontal connections in tree shrew striate cortex.The Journal of Neuroscience Vol.17,No.6,2112–2127, 1997.
[10]Rockland,K.S.;Lund,J.S.Widespread periodic intrinsic connections in the tree shrew visual cortex. Science Vol.215,No.4539,1532–1534,1982.
[11]Rosen, K. H. Discrete Mathematics and Its
Applications,6th edn.McGraw-Hill Education(Asia) and China Machine Press,2007.
[12]Kohler,W.Physical gestalten.In:A Source Book of Gestalt Psychology.Ellis,W.D.Ed.Gouldsboro,ME, USA:The Gestalt Journal Press,17–54,1920.
[13]Kimia,B.B.;Frankel,I.;Popescu,A.-M.Euler spiral for shape completion.International Journal of Computer Vision Vol.54,No.1,159–182,2003.
[14]Singh,M.; Fulvio,J.M.Visual extrapolation of contour geometry.Proceedings of the National Academy of Sciences of the United States of America Vol.102,No.3,939–944,2005.
[15]Ullman,S.Filling-in the gaps:The shape of subjective contours and a model for their generation.Biological Cybernetics Vol.25,No.1,1–6,1976.
[16]Sarti,A.;Malladi,R.;Sethian,J.A.Subjective surfaces:A method for completing missing boundaries. Proceedings of the National Academy of Sciences of the United States of America Vol.97,No.12,6258–6263, 2000.
[17]Fulvio,J.M.;Singh,M.;Maloney,L.T.Precision and consistency of contour interpolation.Vision Research Vol.48,No.6,831–849,2008.
[18]Guttman,S.E.;Kellman,P.J.Contour interpolation revealed by a dot localization paradigm.Vision Research Vol.44,No.15,1799–1815,2004.
[19]Farin,G.E.Curves and Surfaces for CAGD:A Practical Guide,5th edn.San Francisco,CA,USA: Morgan Kaufmann Publishers Inc.,2002.
[20]Kanizsa,G.Grammatica del vedere.Bologna,IItaly: Il Mulino,1980.
[21]Wouterlood,D.;Boselie,F.A good-continuation model of some occlusion phenomena.Psychological Research Vol.54,No.4,267–277,1992.
[22]Bleumers,L.;De Graef,P.;Verfaillie,K.;Wagemans, J.Eccentric grouping by proximity in multistable dot lattices.Vision Research Vol.48,No.2,179–192,2008.
[23]Kubovy,M.;Holcombe,A.O.;Wagemans,J.On the lawfulness of grouping by proximity.Cognitive Psychology Vol.35,No.1,71–98,1998.
[24]Lowe,D.G.Perceptual Organization and Visual Recognition.Kluwer Academic Publishers,1985.
[25]Desolneux,A.;Moisan,L.;More,J.-M.A grouping principle and four applications.IEEE Transactions on Pattern Analysis and Machine Intelligence Vol.25,No. 4,508–513,2003.
[26]Desolneux,A.;Moisan,L.;Morel,J.-M.Fromgestalt Theory to Image Analysis:A Probabilistic Approach. Springer-Verlag New York,2008.
[27]Singh,M.;Hoffman,D.D.Completing visual contours: The relationship between relatability and minimizing inflections.Perception&Psychophysics Vol.61,No.5, 943–951,1999.
[28]Fulvio,J.M.;Singh,M.Surface geometry influences the shape of illusory contours.Acta Psychologica Vol. 123,Nos.1–2,20–40,2006.
[29]Rutkowski,W.S.Shape completion.Computer Graphics and Image Processing Vol.9,No.1,89–101, 1979.
[30]Brady,M.;Grimson,W.E.L.;Langridge,D.J.Shape encoding and subjective contours.In:Proceedings of the 1st AAAI Conference on Artificial Intelligence,15–17,1980.
[31]Mumford,D.Elastica and computer vision.In: Algebraic Geometry and Its Applications.Bajaj C.L. Ed.Springer New York,491–506,1994.
[32]Weiss,I.3D shape representation by contours. Computer Vision,Graphics,and Image Processing Vol.41,No.1,80–100,1988.
[33]Geiger,D.;Pao,H.;Rubin,N.Salient and multiple illusory surfaces.In: Proceedings of the IEEE Computer Society Conference on Computer Vision and Pattern Recognition,118,1998.
[34]Zhu,W.; Chan,T.A variational model for capturing illusory contours using curvature.Journal of Mathematical Imaging and Vision Vol.27,No.1, 29–40,2007.
[35]Williams,L.R.;Jacobs,D.W.Stochastic completion fields:A neural model of illusory contour shape and salience.Neural Computation Vol.9,No.4,837–858, 1997.
[36]Aurenhammer,F.Voronoi diagrams—a survey of a fundamental geometric data structure.ACM Computing Surveys Vol.23,No.3,345–405,1991.
[37]Chew,L.P.Constrained Delaunay triangulations. Algorithmica Vol.4,No.1,97–108,1989.
[38]Boissonnat,J.-D.;Devillers,O.;Teillaud,M.;Yvinec, M.Triangulations in CGAL.In:Proceedings of the 16th Annual Symposium on Computational Geometry, 11–18,2000.
[39]Held,M.;Karp,R.M.A dynamic programming approach to sequencing problems.Journal of the Society for Industrial and Applied Mathematics Vol. 10,No.1,196–210,1962.
[40]Gibbs,M.N.;Mackay,D.J.C.Variational Gaussian process classifiers.IEEE Transactions on Neural Networks Vol.11,No.6,1458–1464,2000.

Hongwei Lin received his B.S.degree from the Department of Applied Mathematics at Zhejiang University, China,in 1996,and Ph.D.degree from the Department of Mathematics at Zhejiang University in 2004. He is currently an associate professor in the School of Mathematical Science,State Key Laboratory of CAD&CG,Zhejiang University.His research interests include geometric design,computer graphics,and computer vision.

Zihao Wang received his B.S.degree from Zhejiang University,China,in 2013. He is currently a graduate student in the School of Mathematical Science, Zhejiang University. His research interests include visual curve completion and computer vision.

Panpan Feng received his B.S.degree from Jiangsu University of Science and Technology in 2011,and M.S.degree from the State Key Laboratory of CAD&CG,Zhejiang University,in 2014. He is currently working in iQiyi as a software engineer.His research interests include computer vision and geometric design.

Xingjiang Lu received his B.S.degree from the Department of Applied Mathematics at Zhejiang University, China,in 1985,and Ph.D.degree from the Department of Mathematics at Zhejiang University in 1999. He is currently a professor in the School of Mathematical Science, Zhejiang University. His research interests include geometric computation,computer graphics,and computer vision.

Jinhui Yu received his B.S.and M.S. degrees in electronics engineering from Harbin Shipbuilding Engineering Institute, Harbin Engineering University,China,in 1982 and 1987, respectively. He received his Ph.D. degree in computer graphics from the University of Glasgow in 1999.He is a professor of computer science at the State Key Laboratory of CAD&CG,Zhejiang University,China.His research interests include image-based modeling,nonphotorealistic rendering,computer animation,and computer graphics art.
Open Access The articles published in this journal are distributed under the terms of the Creative Commons Attribution 4.0 International License(http:// creativecommons.org/licenses/by/4.0/), which permits unrestricted use,distribution,and reproduction in any medium,provided you give appropriate credit to the original author(s)and the source,provide a link to the Creative Commons license,and indicate if changes were made.
Other papers from this open access journal are available free of charge from http://www.springer.com/journal/41095. To submit a manuscript,please go to https://www. editorialmanager.com/cvmj.
© The Author(s)2016.This article is published with open access at Springerlink.com
 Computational Visual Media2016年4期
- Computational Visual Media的其它文章
- User controllable anisotropic shape distribution on 3D meshes
- Computational design of iris folding patterns
- Modified filtered importance sampling for virtual spherical Gaussian lights
- Weighted average integration of sparse representation and collaborative representation for robust face recognition
- Texture image classification with discriminative neural networks
- LSTM-in-LSTM for generating long descriptions of images
