Phase Transition of the Pacific Decadal Oscillation and Decadal Variation of the East Asian Summer Monsoon in the 20th Century
Xiao DONG and Feng XUE
International Center for Climate and Environment Sciences,Institute of Atmospheric Physics, Chinese Academy of Sciences,Beijing 100029
(Received 26 May 2015;revised 24 August 2015;accepted 28 September 2015)
Phase Transition of the Pacific Decadal Oscillation and Decadal Variation of the East Asian Summer Monsoon in the 20th Century
Xiao DONG and Feng XUE∗
International Center for Climate and Environment Sciences,Institute of Atmospheric Physics, Chinese Academy of Sciences,Beijing 100029
(Received 26 May 2015;revised 24 August 2015;accepted 28 September 2015)
This paper focuses on the relationship between the phase transition of the Pacific decadal oscillation(PDO)and decadal variation of the East Asian summer monsoon(EASM)in the twentieth century.The first transition occurred in the 1940s,with an enhanced SST in the North Pacific and reduced SST in the tropical eastern Pacific and South Indian Ocean.In agreement with these SST changes,a higher SLP was found in most parts of the Pacific,while a lower SLP was found in the North Pacific and most parts of the Indian Ocean.In this case,the EASM was largely enhanced with a southerly anomaly in the lower troposphere along the east coast of China.Correspondingly,there was less rainfall in the Yangtze River valley and more rainfall in northern and southern China.An opposite change was found when the PDO reversed its phase in the late 1970s.In the tropical Indian Ocean and western Pacific,however,the SST was enhanced in both the 1940s and 1970s.As a result,the western Pacific subtropical high(WPSH)tended to extend westward with a larger magnitude in the 1970s.The major features were reasonably reproduced by an atmospheric general circulation model(IAP AGCM4.0)prescribed with observed SST and sea ice.On the other hand,the westward extension of the WPSH was exaggerated in the 1970s,while it was underestimated in the 1940s.Besides,the spatial pattern of the simulated summer rainfall in eastern China tended to shift southward compared with the observation.
Pacific decadal oscillation,East Asian summer monsoon,western Pacific subtropical high,IAP AGCM4.0
1.Introduction
Previous studies have shown that the East Asian summer monsoon(EASM)underwent a significant decadal variation in the 20th century(Wang,2001;Xue,2001;Zhou et al., 2009a;Chen and Xue,2013).A weakened EASM occurred in the late 1970s,characterized by a weaker southerly in summeralongtheeastcoastofEastAsiaandasouthwestwardextension of the western Pacific subtropical high(WPSH).Concurrently,the summer rainfall pattern in China also changed, with more rainfall in the Yangtze River basin and less rainfall in northern China(Wang,2001;Xue,2001).Gong and Ho (2002)noted that a warmer SST played a role in the decadal extension of the WPSH and associated change in rainfall pattern in China after the 1970s.There is also evidence that this decadal variation was associated with enhanced tropical SST, which resulted from a phase transition of the Pacific decadal oscillation(PDO)(Zhu and Yang,2003).Yang et al.(2005) found that,corresponding to a positive phase of the PDO, there was a northerly anomaly in northern China,which wasunfavorable for water vapor transport,resulting in less rainfall.More recently,Yu(2013)indicated that the phase of the PDO is negatively correlated with the EASM,and the phase transition was,to a large degree,responsible for the decadal weakening in the late 1970s.
At present,the decadal variation of the EASM circulation can be simulated well by an atmospheric model with prescribed SST.For instance,most models can simulate the westward extension of the WPSH in the late 1970s if a decadal warming in the tropical western Pacific and Indian Ocean is added into the models(Zhou et al.,2009b).On the other hand,most models fail to simulate the decadal change in rainfall pattern in China associated with the decadal weakening of the EASM(Li et al.,2010).Recently,the fourth generation atmospheric model developed at the Institute of Atmospheric Physics(IAP AGCM4.0),was used by Chen and Xue(2013)to simulate the decadal variation of the EASM circulationandassociatedsummerrainfallinChinainthelate 1970s.They showed that this model can reasonably simulate the decadal change of the EASM circulation,as well as the rainfall pattern,in China.Hence,they concluded that the performance is model-dependent,and models with a relatively higher resolution,such as IAP AGCM4.0,possess some ad-vantages in simulating the rainfall pattern compared with earlier models with a relatively lower resolution.
©Institute of Atmospheric Physics/Chinese Academy of Sciences,and Science Press and Springer-Verlag Berlin Heidelberg 2016
It should be noted that,besides the transition from a negative phase to a positive one in the late 1970s,the PDO also underwent an opposite transition in the mid-1940s(Fig.1).If the PDO phase transition in the late 1970s induced the EASM decadal variation,as mentioned above,it is reasonable to infer that the EASM may also have experienced a decadal variation in the 1940s.However,owing to insufficient observations in the first half of the 20th century,less attention has been paid to the decadal variation in the 1940s compared with the 1970s.Recently,the 20th century reanalysis(20CR),version 2,covering the whole 20th century period,was released by the Department of Energy and National Oceanic and Atmospheric Administration of the United States(Compo et al., 2011).This dataset provides us with an opportunity to investigate the EASM decadal variation in the 1940s.
As an oscillating phenomenon with a period of 50–60 years,the PDO experienced a whole period in the 20th century,including the phase transition in the 1940s and 1970s (Mantua et al.,1997;Mantua and Hare,2002;Deser et al., 2004).Therefore,a comparison of the decadal variation between the 1940s and 1970s can further enhance our understanding of the relationship between the PDO and EASM from a different perspective.The result should also be helpful in terms of predicting the decadal variation of the EASM in the future.
Based on observational data and the 20th century reanalysis data,together with simulation data produced by IAP AGCM4.0,we studied the relationship between the phase transition of the PDO and the associated decadal variation of the atmospheric circulation and SST in the 20th century, with a focus on the EASM.Following this introduction,brief descriptionsofthedataandmodelaregiveninsection 2.Sections 3 and 4 present the observational and simulation results, respectively,followedbyasummaryandfurtherdiscussionin section 5.
2.Model and data
Several datasets were used in this study.Monthly mean global land precipitation with a resolution of 0.5◦×0.5◦was provided by the CRU,University of East Anglia(Mitchell and Jones,2005).It should be noted that this dataset is interpolated from observations alone,without any proxy data included in the construction.Wen et al.(2006)showed that the CRU data exhibit significant correlation with other results in China during the 20th century.Besides,global SLP data with a resolution of 5◦×5◦(HadSLP2),SST and sea ice with a resolution of 1◦×1◦(HadISST)were provided by the Met Office Hadley Center(Xue et al.,2003;Allan and Ansell, 2006;Smith et al.,2008).The HadSLP2 data are created using marine observations and land(terrestrial and island)observations from 2228 stations around the globe.

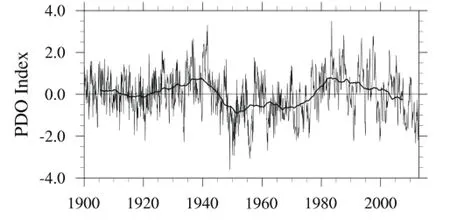
Fig.1.Normalized time series of the PDO index during 1900–2011.The thick solid line represents the 11-year running mean of the index.
The wind field and geopotential height,with a resolution of 2◦×2◦,in the 20CR data provided by the Department of Energy and National Oceanic and Atmospheric Administration,were also used(Compo et al.,2011).It should be noted that,in the 20CR data,only the observed surface pressure is assimilated into the model to generate the reanalysis data.Besides,the PDO index was calculated from the observational SST.The annual cycle was first removed,before the EOF decomposition of SST in the North Pacific(north of 20◦N)was conducted.The first principal component corresponding to EOF1 is regarded as the PDO index(Lapp et al., 2012).
The model used in this study was the fourth generation atmospheric model of the Institute of Atmospheric Physics (IAP AGCM4.0).The dynamical core was inherited from the former IAP AGCMs.The model physics is similar to version 3.5 of the Community Atmosphere Model.The model has a relatively high resolution,with a 1.4◦lat×1.4◦lon in the horizontal domain and 26 layers in the vertical direction (Zhang et al.,2009).The model shows good performance in simulating the EASM(Chen and Xue,2013;Su et al.,2014). The model was driven by the observed SST and sea ice from 1 January 1870 to 31 December 2008.Considering the focus of this study,the period from 1920 to 2000 was taken for analysis,except the PDO index shown in Fig.1.
3.Observational evidence
Figure 1 shows the normalized time series of PDO index in the 20th century.The PDO underwent apparent phase transitions twice in the 20th century.The first transition occurred in the 1940s,from a positive phase to a negative one,while the second transition occurred in the 1970s,with a reversed sign.Based on the PDO phase,we divided the 20th century into three periods:1920–45(positive phase);1946–76(negative phase);and 1977–2000(positive phase).The differences among these three periods were used to evaluate the decadal variations associated with the PDO phase.For simplicity,we refer to the difference between 1946–1976 and 1920–1945 (1977–2000 and 1946–1976)as the difference in the 1940s (1970s).

Fig.2.SST difference based on HadISST data(units:◦C):(a)1940s(1946–1976 minus 1920–1945);(b)1970s(1977–2000 minus 1946–1976).Regions above the 5%significance level are marked by a cross.
Figure 2 shows the global SST differences in the 1940s and 1970s.In the 1940s,the major cooling was in the tropical Pacific,North Atlantic and tropical South Indian Ocean, while the major warming was in the North Pacific,most parts oftheSouthernOceanandthetropicalregionsfromtheNorth Indian Ocean to the western Pacific.With the transition of PDO to a positive phase in the 1970s,most oceanic regions experiencedanoppositechangecomparedwiththe1940s,especially in the Pacific and South Indian Ocean.This fact indicates an influence of the PDO on the SST in these regions. However,there are some exceptions.From the tropical Indian Ocean to the western Pacific,for instance,a warming trend was found in both the 1940s and 1970s.
The large-scale circulation also experienced an evident decadalvariationwiththedecadalvariationintheglobalSST. Figure 3 shows the observed decadal variation of SLP in the 1940s and 1970s,along with the 20CR reanalysis results for comparison.In the 1940s,a positive SLP anomaly was situated in the Pacific and American continents,while a negative one was in the Indian Ocean and Asian continent.Similar to the SST,an opposite trend was apparent in the 1970s,especially in the Pacific,indicating the influence of the PDO. By comparing Fig.3 with Fig.2,we can see that a positive (negative)SLP anomaly generally corresponds to a negative (positive)SST anomaly over most parts of the Pacific and Indian Ocean.From the tropical Indian Ocean to the western Pacific,however,a positive SLP and SST trend were identified in both the 1940s and 1970s.Instead of the PDO,a number of other factors,such as global warming,are possibly responsible for the decadal variation in this region(Dong and Zhou,2014).
On the other hand,relatively large differences over continents were apparent between the two datasets.In the 1940s, for example,there was a negative anomaly in the observationovercentralAsia,whichwasmisrepresentedasapositive anomaly in the 20CR data.A similar discrepancy was found over northeastern Asia in the 1970s.Besides the discrepancy in the reanalysis data,observational uncertainty can also not be ignored,especially in the first half of the 20th century. Therefore,one must be cautious when using the reanalysis data over continents.
With the decadal variation in the large-scale circulation, the EASM circulation also showed an evident variation.As shown in Fig.4,there was an anticyclonic anomaly in southern China in the 1940s,along with an enhanced southwesterly in eastern China.In other words,the EASM circulation tended to be strengthened with a negative phase of the PDO from the 1940s.In the 1970s,there was a cyclonic anomaly in southern China and an anticyclonic anomaly in northern China.Hence,there was a distinct difference in the two regions.Here,it must be emphasized that this result is different from the result of Chen and Xue(2013),who showed that the EASM circulation largely weakened after the 1970s.Primarily,the discrepancy likely results from the different datasets. While the ERA-40 data used by Chen and Xue(2013)shows a more reliable result due to the assimilation of satellite data, the 20CR data are not so accurate because only the observed surface pressure is included.Secondly,the decadal variationhere is the difference between 1977–2000 and 1946–1976, while it was the difference between 1979–1999 and 1958–1978 in the result of Chen and Xue(2013).

Fig.3.SLP difference(units:hPa):(a,b)1940s and 1970s,based on the HadSLP data;(c,d)1940s and 1970s,based on the 20CR data.Regions above the 5%significance level are marked by a cross.

Fig.4.850-hPa wind difference in East Asia based on 20CR data(units:m s-1):(a)1940s;(b)1970s.Regions above the 5%significance level are shaded.
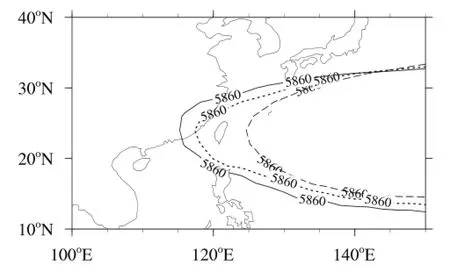
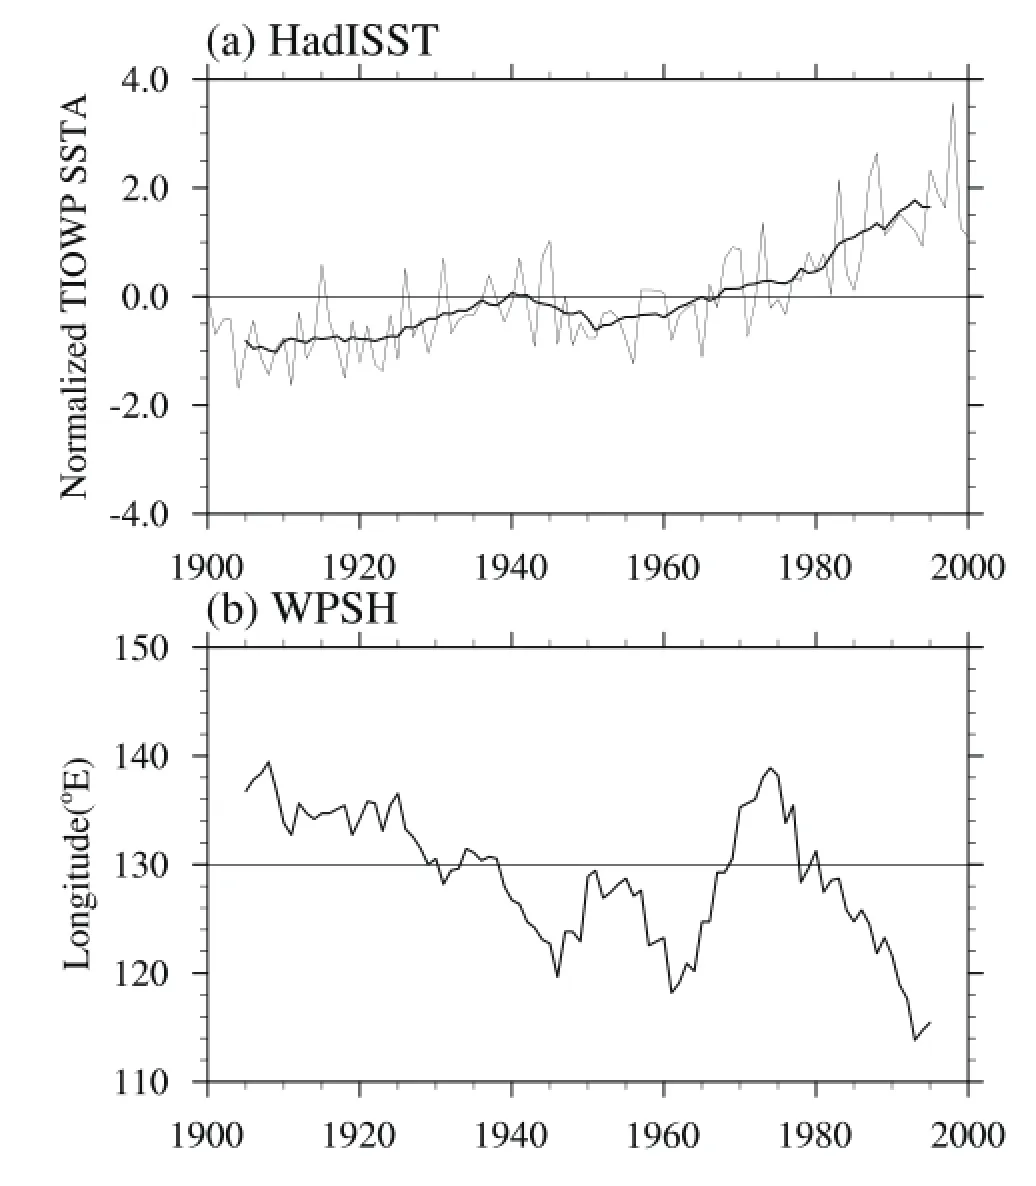
In sharp contrast with the large-scale circulation,the WPSH showed a totally different variation during the period concerned.Figure 5 shows the 500 hPa WPSH represented by the 5860 gpm contour in the three periods,i.e.,1920–1945,1946–1976 and 1977–2000.Unlike the large-scale circulation,the WPSH tended to extend westward consistently.As demonstrated by Zhou et al.(2009b),the westward extension of the WPSH in the late 1970s mainly resulted from the warming over the tropical Indian Ocean and western Pacific.Thus,it is reasonable that the westward extension was consistent with the warming in the 1940s and 1970s(Fig.2).To further examine the relationship between the SST and WPSH,Fig.6 illustrates the time series of the SST over the tropical Indian Ocean and western Pacific(10◦S–15◦N, 60◦–150◦E)and the west-point of the WPSH,which is defined as the most western point of the 5860 gpm contour over 90◦–180◦E(Su and Xue,2010).It can clearly be seen that the west-point was negatively correlated with the SST over the tropical Indian Ocean and western Pacific on a decadal timescale,except for the small-amplitude oscillation during the 1940–50s.

Fig.5.WPSH at 500 hPa,represented by the 5860 gpm contour in the 20CR data during 1920–1945(dashed),1946–1976 (dotted),and 1977–2000(solid line)(units:gpm).

Fig.6.(a)Normalized time series of SST over the tropical Indian Ocean and western Pacific(0◦–15◦N,60◦–150◦E)during 1900–2000,based on HadISST data,with the 11-year running mean represented by a thick line.(b)11-year running mean western-point of the WPSH in boreal summer during 1900–2000,based on 20CR data.
Corresponding to the decadal variation in the EASM circulation,summer rainfall in eastern China also changed(Fig. 7).In the 1940s,there was a positive anomaly in northern China,especially around Bohai Bay,and a negative anomaly to the south of the Yangtze River basin.In the 1970s,by contrast,there was a positive anomaly in the Yangtze River basin and a negative anomaly around Bohai Bay.Therefore, an opposite signal between the 1940s and 1970s was clear, especially in northern China,indicating the influence of the PDO.On the other hand,the opposite trend was not so clear in southern China and was limited to a smaller region.As stated above,the WPSH exhibited a consistent westward extension in the 1940s and 1970s.Because the summer rainfall distribution in eastern China is largely controlled by the WPSH,summer rainfall in southern China was also influenced by the SST anomaly over the tropical Indian Ocean and western Pacific.
4.Simulation result
The IAP AGCM4.0 was used to simulate the EASM circulation by Su et al.(2014),who showed that the model overestimates the intensity of the WPSH.In the model,the 5920 gpm contour is used to represent the position of the WPSH,

Fig.7.Summer rainfall difference in East Asia based on CRU data(units:mm d-1):(a)1940s;(b)1970s.Regions above the 5%significance level are marked by a cross.

Fig.8.WPSH at 500 hPa,represented by the 5920 gpm contour in the simulation data during 1920–1945(dashed),1946–1976 (dotted),and 1977–2000(solid line)(units:gpm).
instead of the 5860 gmp used in the 20CR data.As shown in Fig.8,the westward extension is generally reproduced by the model,but there are systematical discrepancies between the simulation and 20CR data.While the westward extension is largely underestimated in the 1940s,it is overestimated in the 1970s.Besides the model bias,there are two possible reasons for the discrepancies.First,a much warmer trend over the tropical Indian Ocean and western Pacific in the 1970s may lead to a stronger response in the model and associated westward extension(Fig.2).In the 1940s,however,the response could be reduced by the internal atmospheric noise in the model due to a relatively weak warming signal.Second, it should be noted that the 20CR data are largely dependent on the model generating the reanalysis.As discussed above, thereareseriouserrorsinthe20CRdata.Therefore,theresult based on the 20CR data cannot be considered in the conclusive sense,but rather as an illuminative clue to the decadal variation.
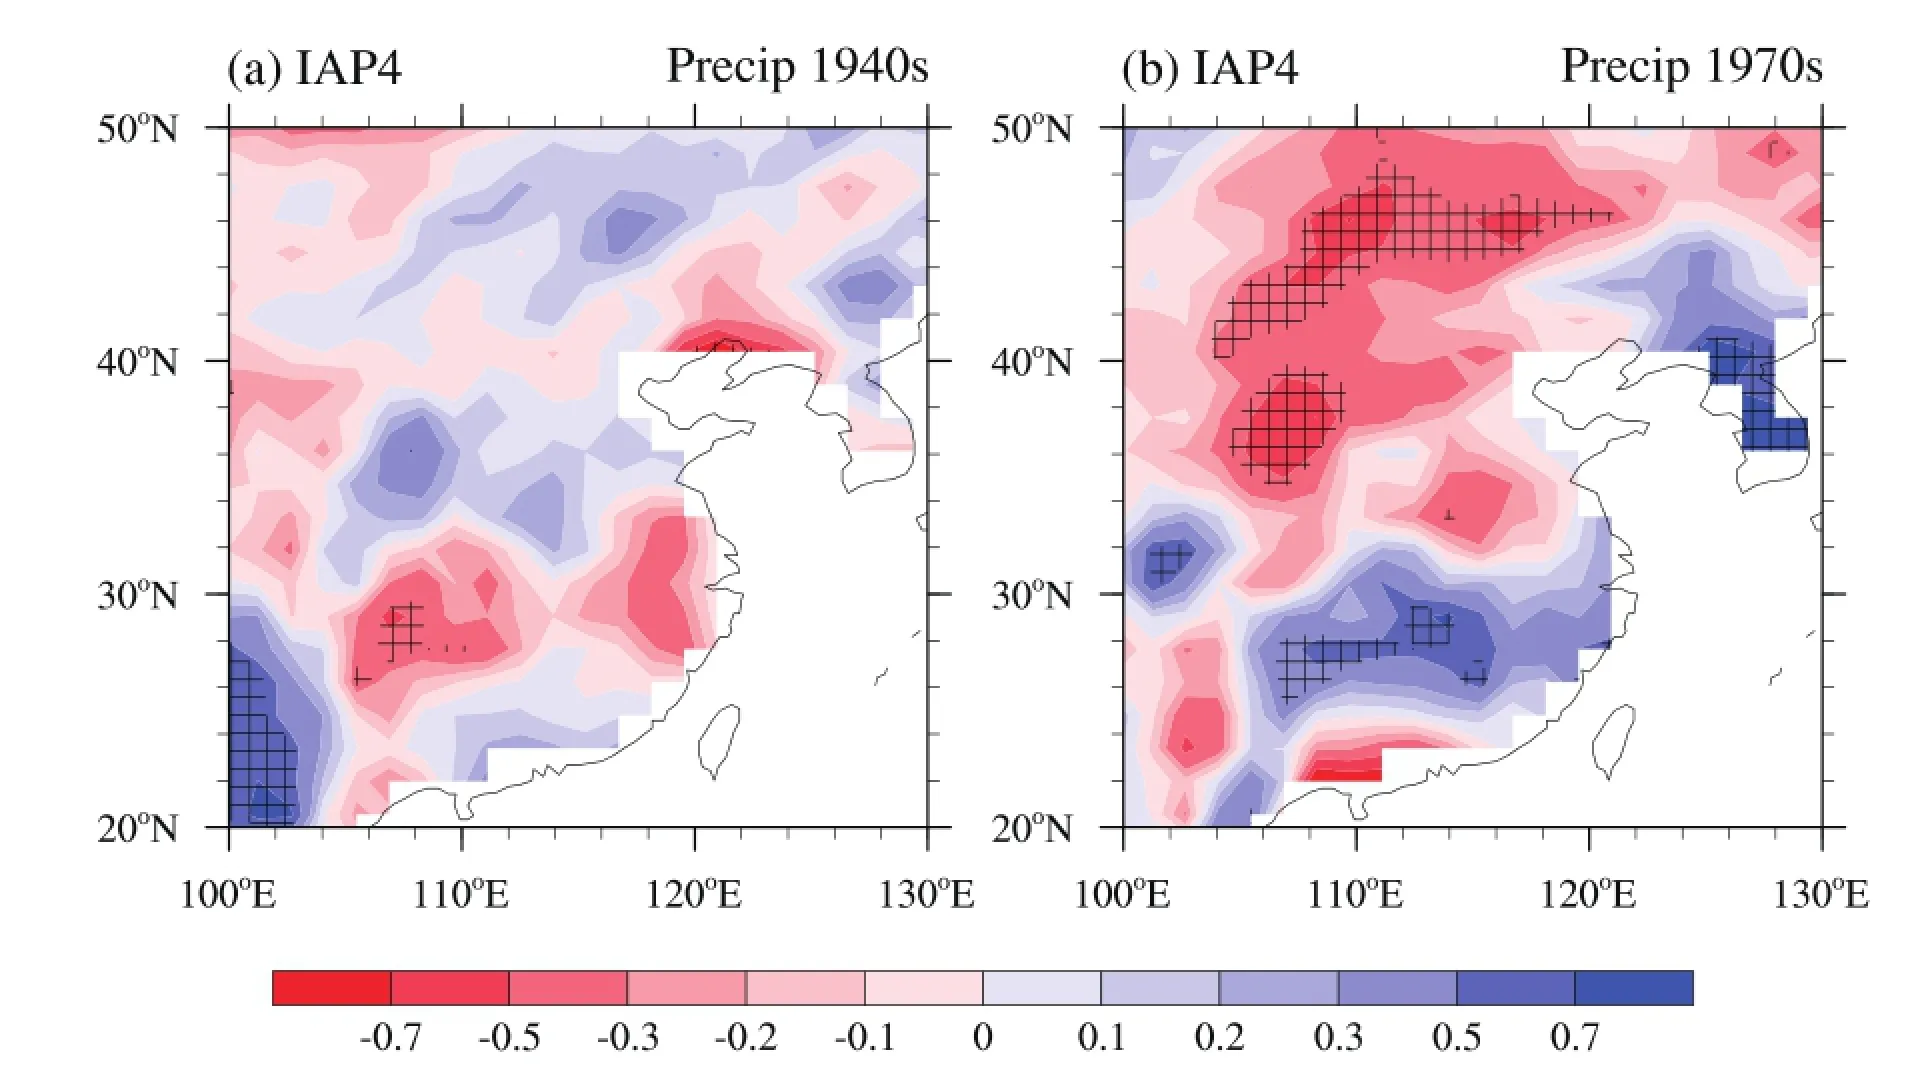
Figure 9 shows the simulated summer rainfall anomaly in the1940sand1970s.Themodelsimulatesthechangeinrainfall pattern in the 1970s,except that the pattern is located a little southward.Compared with the 1970s,the performance in the 1940s is relatively poor.While the model simulates the negative anomaly in the Yangtze River basin and the positive anomaly in southern China,it fails to simulate the positive anomaly around Bohai Bay.
To further verify the model’s performance in the decadal variation of summer rainfall in eastern China,we performed an EOF analysis(Fig.10).To remove high-frequency variability,a 9-year running mean was applied to the original data before the EOF decomposition.The observed EOF1 exhibits a north–south dipole pattern,with the explained variance reaching 29.8%.The dipole pattern is generally captured by the model,except that the pattern is located slightly northward than in the observation.Besides,the model simulates the positive periods in the 1920s,1960s and late 1980s, and the negative periods in the late 1910s,1940s and late 1990s.In the 1910s and 1930s,however,the model results are almost opposite to the observation.

Fig.9.Summer rainfall difference in East Asia,based on the simulation data(units:mm d-1):(a)1940s;(b)1970s. Regions above the 5%significance level are marked by a cross.
A similar feature has also been found in other models. For instance,Yu et al.(2015)investigated the relationship between the PDO and the decadal variation of the summer rainfall pattern in eastern China using a climate model simulation.Based on composite and regression methods,they examined the decadal difference of summer rainfall between a positive and negative phase.In agreement with our conclusion,they showed that summer rainfall in the Yangtze River valley tends to increase in a positive phase of the PDO.What they did not notice was the asymmetrical feature between a positive and negative phase.Based on the comparison between the 1940s and 1970s,there is an evident asymmetrical change in the EASM circulation and summer rainfall inChina.
5.Summary and discussion
Based on observation and 20CR reanalysis data,we studied the relationship between the phase transition of the PDO and decadal variation of the EASM in the 20th century.With the first transition from a positive phase to a negative one in the 1940s,there was enhanced SST in the North Pacific and reduced SST in the tropical eastern Pacific and South Indian Ocean,leading to higher SLP in most parts of the Pacific and lower SLP in the North Pacific and most parts of the Indian Ocean.In East Asia,the summer monsoon enhanced,with a southerly anomaly along the east coast of China.As a result, there was less rainfall in the Yangtze River valley and more rainfall in northern and southern China.When the PDO reversed its phase in the 1970s,an opposite signal was found. In the tropical Indian Ocean and western Pacific,however, the SST enhanced in both the 1940s and 1970s,inducing a consistent westward extension of the WPSH.This fact indicates that,instead of the PDO,a number of other factors may play a major role in the SST change over this region.
Prescribed with observed SST and sea ice coverage,IAP AGCM4.0 can generally simulate the main features of the decadal variation of the EASM circulation and summer rainfall pattern in eastern China.On the other hand,a number of systematic errors exist in the model simulation.While the westward extension of the WPSH in the 1940s is underestimated,it is overestimated in the 1970s.Moreover,there are serious errors in rainfall simulation in the 1940s,especially on a regional scale.It is also noted that,instead of a real observation,the 20CR data are model-generated reanalysis results.
A comparison of 850 hPa wind and summer rainfall in eastern China between the 1940s and 1970s showed,to some degree,a symmetrical feature with respect to the EASM decadal variation associated with the phase transition of the PDO.On the other hand,an asymmetrical feature was apparent,as seen from the consistent westward extension of the WPSH in the 1940s and 1970s.Since the AMIP-type simulation cannot address this issue clearly,we intend to conduct more detailed experiments in the future.
Compared with the decadal variation in the 1970s,less attention has been paid to the variation in the 1940s in previous studies due to the lack of observational data.As shown in this study,the PDO underwent a transition from a positive phase to a negative one in the 1940s,which was opposite to that in the 1970s.As a result,an opposite decadal signal was found in the EASM circulation and summer rainfall in eastern China.This result is important for the future projection of the EASM.As an oscillation with a period of 50–60 years, the PDO has already maintained its positive phase for about 30 years since the late 1970s.Actually,it is evident from Fig.1 that from the beginning of the 21st century the PDO’s phase has begun to change,and thus it can be anticipated that the EASM will be enhanced with the phase transition of the PDO,similar to the case in the 1940s.
Acknowledgements.The comments and suggestions from the two anonymous reviewers were greatly appreciated.This work was supported by the Strategic Priority Research Program of the Chinese Academy of Sciences(Grant No.XDA05110201)and the National Natural Science Foundation of China(Grant No.41475052).
REFERENCES
Allan,R.,and T.Ansell,2006:A new globally complete monthly historical gridded mean sea level pressure dataset(HadSLP2): 1850–2004.J.Climate,19,5816–5842.
Chen,H.,and F.Xue,2013:Numerical simulation of decadal variations in the East Asian summer monsoon and summer rainfall in eastern China.Chinese J.Atmos.Sci.,37,1143–1153. (in Chinese)
Compo,G.P.,and Coauthors,2011:The twentieth century reanalysis project.Quart.J.Roy.Meteor.Soc.,137(654),1–28.
Deser,C.,A.S.Phillips,and J.W.Hurrell,2004:Pacific interdecadal climate variability:Linkages between the tropics and the north Pacific during boreal winter since 1900.J.Climate, 17,3109–3124.
Dong,L.,and T.J.Zhou,2014:The Indian Ocean sea surface temperature warming simulated by CMIP5 models during the Twentieth century:Competing forcing roles of GHGs and anthropogenic aerosols.J.Climate,27,3348–3362.
Gong,D.Y.,and C.H.Ho,2002:Shift in the summer rainfall over the Yangtze River valley in the late 1970s.Geophys.Res. Lett.,29,78-1–78-4,doi:10.1029/2001GL014523.
Lapp,S.L.,J.M.St.Jacques,E.M.Barrow,and D.J.Sauchyn, 2012:GCM projections for the Pacific decadal oscillation under greenhouse forcing for the early 21st century.Inter.J.Climatol.,32,1423–1442.
Li,H.M.,A.G.Dai,T.J.Zhou,andJ.Lu,2010:ResponsesofEast Asian summer monsoon to historical SST and atmospheric forcing during 1950-2000.Climate Dyn.,34,501–514.
Mantua,N.J.,and S.R.Hare,2002:The Pacific decadal oscillation.Journal of Oceanography,58,35–44.
Mantua,N.J.,S.R.Hare,Y.Zhang,J.M.Wallace,and R.C. Francis,1997:A Pacific interdecadal climate oscillation with impacts on salmon production.Bull.Amer.Meteor.Soc.,78, 1069–1079.
Mitchell,T.D.,and P.D.Jones,2005:An improved method of constructing a database of monthly climate observations and associated high-resolution grids.Inter.J.Climatol.,25,693–712.
Smith,T.M.,R.W.Reynolds,T.C.Peterson,and J.Lawrimore, 2008:Improvements to NOAA’s historical merged land–ocean surface temperature analysis(1880–2006).J.Climate, 21,2283–2296.
Su,T.H.,and F.Xue,2010:The intraseasonal variation of summer monsoon circulation and rainfall in East Asia.Chinese J. Atmos.Sci.,34,611–628.(in Chinese)
Su,T.H.,F.Xue,and H.Zhang,2014:Simulating the intraseasonal variation of the East Asian summer monsoon by IAP AGCM4.0.Adv.Atmos.Sci.,31,570–580,doi:10.1007/ s00376-013-3029-8.
Wang,H.J.,2001:The weakening of the Asian monsoon circulation after the end of 1970’s.Adv.Atmos.Sci.,18,376–386, doi:10.1007/BF02919316.
Wen,X.Y.,S.W.Wang,J.H.Zhu,and D.Viner,2006:An overview of China climate change over the 20th century usingUK UEA/CRU high resolution grid data.Chinese J.Atmos. Sci.,30(5),894–904,doi:10.3878/j.issn.1006-9895.2006.05. 18.(in Chinese)
Xue,F.,2001:Interannual to Interdecadal variation of East Asian summer monsoon and its association with the global atmospheric circulation and sea surface temperature.Adv.Atmos. Sci.,18,567–575,doi:10.1007/s00376-001-0045-x.
Xue,Y.,T.M.Smith,and R.W.Reynolds,2003:Interdecadal changes of 30-yr SST normals during 1871–2000.J.Climate, 16,1601–1612.
Yang,X.Q.,Q.Xie,Y.M.Zhu,X.G.Sun,and Y.J.Guo,2005: Decadal-to-interdecadal variability of precipitation in north China and associated atmospheric and oceanic anomaly patterns.Chinese J.Geophys.,48,789–797.(in Chinese)
Yu,L.,2013:Potential correlation between the decadal East Asian summer monsoon variability and the Pacific decadal oscillation.Atmos.Oceanic Sci.Lett.,6,394–397.
Yu,L.,T.Furevik,O.H.Otter˚a,and Y.Q.Gao,2015:Modulation of the Pacific decadal oscillation on the summer precipitation over East China:A comparison of observations to 600-yrs control run of Bergen Climate Model.Climate Dyn.,44,475–494.
Zhang,H.,Z.H.Lin,and Q.C.Zeng,2009:The computational scheme and the test for dynamical framework of IAP AGCM-4.Chinese J.Atmos.Sci.,33,1267–1285.(in Chinese)
Zhou,T.J.,D.Y.Gong,J.Li,and B.Li,2009a:Detecting and understanding the multi-decadal variability of the East Asian summer monsoon-recent progress and state of affairs.Meteorologische Zeitschrift,18,455–467.
Zhou,T.J.,and Coauthors,2009b:Why the western Pacific subtropical high has extended westward since the late 1970s.J. Climate,22,2199–2215.
Zhu,Y.M.,and X.Q.Yang,2003:Relationships between Pacific decadal oscillation(PDO)and climate variabilities in China. Acta Meteor.Sinica,61,641–654.(in Chinese)
Dong,X.,and F.Xue,2016:Phase transition of the Pacific decadal oscillation and decadal variation of the East Asian summer monsoon in the 20th century.Adv.Atmos.Sci.,33(3),330–338,
10.1007/s00376-015-5130-7.
∗Feng XUE
Email:fxue@lasg.iap.ac.cn
 Advances in Atmospheric Sciences2016年3期
- Advances in Atmospheric Sciences的其它文章
- The Reliability of Global and Hemispheric Surface Temperature Records
- Projected Shifts in K¨oppen Climate Zones over China and Their Temporal Evolution in CMIP5 Multi-Model Simulations
- Simulation of the Interface between the Indian Summer Monsoon and the East Asian Summer Monsoon:Intercomparison between MPI-ESM and ECHAM5/MPI-OM
- Impact of Planetary Wave Reflection on Tropospheric Blocking over the Urals-Siberia Region in January 2008
- Detecting the Origins of Moisture over Southeast China: Seasonal Variation and Heavy Rainfall
- Assessment of Interannual Sea Surface Salinity Variability and Its Effects on the Barrier Layer in the Equatorial Pacific Using BNU-ESM
