Isotope Shifts of Nitrogen around 800 nm
Jiao Bai,Hai-ling Wang,Xue Ni,Lun-hua DengState Key Laboratory of Precision Spectroscopy,East China Normal University,Shanghai 200062,China
Isotope Shifts of Nitrogen around 800 nm
Jiao Bai,Hai-ling Wang∗,Xue Ni,Lun-hua Deng∗
State Key Laboratory of Precision Spectroscopy,East China Normal University,Shanghai 200062,China
The Doppler-limited absorption spectra of14N and15N atoms were measured around 800 nm using concentration modulation spectroscopy to study their isotope shifts.The nitrogen atoms were generated by discharging molecular nitrogen buffered with helium in a homemade discharge tube.The isotope shifts of four multipletswere measured and their J-dependent specific mass shifts were observed and discussed.
Doppler-limited absorption spectra,Isotope shifts,Specific mass shifts,J-dependence
I.INTRODUCTION
The isotope shifts(ISs)of atoms are needed in astrophysical studies such as the analysis of the quasar absorption spectra.By comparing the theoretically calculated and experimentally measured isotope shifts,it can be found that the change in the nuclear charge distributes from one isotope to another[1].The study on the relative isotope abundance has many uses terrestrially,since various geological and biological processes tend to favor one isotope over another,it can help scientists to discover the chemical evolution of the universe. However,the IS parameters are limited and the IS characters are not well known for many atoms.The ISs of nitrogen atom are the topic of this study.
Holmes first observed a bunch of the isotope shifts oftransitions of15N-14N isotopic pair using a Fabry-P´erot interometer[2].In Holmes'experiment,no hyperfine structure in any component has been observed.After Holmes'work,several groups have reported the isotope shifts in some lines of nitrogen[3−7].Cangiano studied the hyperfine structures and isotope shifts oftransitions using an external cavity diode laser and Doppler-free techniques[4].Jennerich later reported the high-resolution saturation absorption spectra oftransitions[5].J¨onsson calculated the hyperfine structures of14N and15N using ab initio multiconfiguration Hartree-Fock method[6].However,the hyperfine constants oftransitions from J¨onsson's theoretical calculation are strongly inconsistent with these from Jennerich's experiment. Carette et al.studied the saturation spectra of the low lying states of N I[7],their results are in agreement with J¨onsson's theoretical ones.
A possible J-dependent specific mass shift of atomic nitrogen was found in some studies[2,4−7]. However,the complete ISs of the involved multiplets were not measured.Here,we report our complete study on the ISs oftransitions,and some observed ISs onandtransitions of atomic nitrogen.The J-dependent specific mass shifts of these multiplets were confirmed and discussed.
II.EXPERIMENTS
The experimental apparatus used in this work is illustrated in Fig.1,which is similar to that has been described previously[8,9].A single-mode Ti:Sapphire laser(Coherent Ring 899-29)pumped by a Nd:YVO4laser(Coherent Verdi-10,at 532 nm)was used as the excitation source.The laser beam passed through a home-made glow discharging(discharged at 23 kHz)absorption cell,which was made of a 60 cm long glass pipe with an internal diameter of 1.5 cm,then focused into a P-type layer/intrinsic layer/N-type layer(P-I-N)detector(Electro-Optics Technology,EOT-2030A).The output signal of the detector was demodulated using a lock-in amplifier at 2×23 kHz(concentration demodulation).Finally,the signal was acquired and processed by a computer to obtain the spectra of14N and15N.The nitrogen atoms were generated by discharging the mixture of trace14N2,15N2buffered with helium(200 Pa). The absolute wavenumbers were determined by simultaneously recording the Doppler-limited absorption spectrum of I2[10].The absolute wavenumbers were determined to an accuracy of±0.007 cm−1.
∗Authors to whom correspondence should be addressed.E-mail: hlwang@phy.ecnu.edu.cn,lhdeng@phy.ecnu.edu.cn

FIG.1 Schematic of experimental setup.

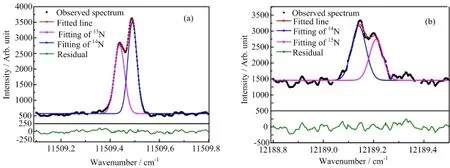
FIG.2 Absorption spectra of(a)3s4P5/2→3p4Do3/2and(b)3s2D3/2→5p2Do3/2transitions of14N and15N.The black dot lines are our experimentally measured spectra,the red solid lines are the Gaussian fitting of the whole experimental spectra,pink and blue solid lines are the Gaussian fitting of the15N and14N spectra,the green solid lines are the residuals between the experimental data and the Gaussian fitting.In(a),the left peak is15N signal,right peak is14N,the value of IS((v(15N)-v(14N))is negative;In(b),the left peak is14N signal,right peak is15N,the value of IS is positive.
III.RESULTS AND DISCUSSION
Totally,we measured ISs for 20 transitions of 4 multiplets of nitrogen atoms.In the experiment,the volume ratio of14N,15N to helium mixture was properly prepared so that the spectra of two isotopes could be measured simultaneously with comparable intensity. Figure 2 shows partial of the absorption spectra that were fitted to extract the isotope shifts of nitrogen.The spectra of14N were individually measured to distinguish14N from the twin peaks of the IS spectra.Figure 2(a) shows the spectrum of 3s4P5/2→3p4Do3/2transition, the peak at shorter frequency is15N,while the peak at longer frequency is due to the transition of14N.Figure 2(b)is the spectrum of 3s2D3/2→5p2Do3/2transition, the peak at lower frequency is14N,the peak at higher frequency is due to the transition of15N.The exact line centers of absorption spectra were obtained by fitting the spectra with Gaussian functions and shared line widths.The residuals between the experimental data and the Gaussian fitting are given in Fig.2.The full width at half maximum(FWHM)of these lines is around 1000 MHz,which is comparable to the Doppler broadening of this experimental system.
The isotope shift of nitrogen is the difference in the atomic spectra between14N and15N.It comes from two sources:the finite size of the nuclear charge distribution (the field shift,FS),and the finite mass of the nucleus (the mass shift,MS)[11,12].In first-order perturbation theory,the IS can be described as[13]:

The contribution from second source is traditionally divided into two parts:the normal mass shift(NMS)and the specific mass shift(SMS).

The NMS is calculated in a straightforward way fromthe wavelength of the optical transition of14N[14].


TABLE I Summary of the isotope shifts of14N and15N around 800 nm.“Measured IS”=v(15N)-v(14N),where v(15N)and v(14N)are the measured line-centers of the atom spectra.The NMSs are calculated from the experimentally measured ISs. The uncertainties for our experimental data are one standard deviation of the mean.
where,meis the electron mass,mpis the proton mass, vexptis the experiment wave number of14N in cm−1, A′is the mass number of15N,A is the mass number of14N.The residual isotope shift(RIS)will be written as:

The isotope shift values extracted out from experimental spectra are listed in Table I,along with those from literatures.The sign assigned to the isotope follows the rule that a shift to higher frequencies in going14N to15N is positive. In Table I the signs of the ISs ofare positive which have the same sign as the reported ISs of 3s2P3/2→3p2Po1/2in Holmes'measurement[2],the ISs ofare negative which are the same as previous investigation[6−8].The NMS values were calculated using Eq.(3),so the uncertainties will not be given here.
The measured isotope shifts oftransitions are listed in Table I and compared with the results measured using saturated absorption spectroscopy[5], and with those measured with Doppler limited spectroscopy[2,3].Our results show good agreement with Jennerich's measured ones[5].We measured the ISs of all eight transitions,and also gave the systematic IS and NMS values.
The measured isotope shifts oftransitions are also listed in Table I and compared with the results from Jennerich et al.[5],Cangiano et al.[4], and Holmes[2,3].Our results are close to Jennerich's results[5].Our results are also close to Cangiano's results[4]except a large difference in 3s4P3/2→3p4Po5/2transition.
Holmes reported the IS of thetransitions[2].However,we could not obtain high quality spectra to get the IS of this multiplet.Jennerich et al. [5]and Cangiano et al.[4]did not report these IS values.Here,we cited Holmes'results in Table I for further analysis.We also measured some ISs of 3s2DJ→5p2DoJandthese values were newly reported as we know.Unfortunately,not all the fine structure transitions were observed.
In our work,the measured residual isotope shifts (RIS=IS−NMS)vary from−2781.7 MHz for 3s4P5/2→MHz for3s4P1/2→3p4Do1/2and from −2856.6 MHzfor3s4P5/2→3p4Po5/2to−2549.6 MHz for 3s4P1/2→3p4Po1/2.From Eq.(4),the RIS comes from two components,the SMS and the FS. The FS depends on the variation of the electron density inside the nuclear charge distribution.As a general rule,for light atoms(Z<30)the mass shift is the dominant contribution while for heavy atoms(Z>60)the field shift plays the main role.The ab initio calculation of J¨onsson et al.[6]gives the estimated value of FS around 0.2 MHz for these considered transitions.Thus for nitrogen,the FS can be neglected in the present work and the dominant part in RIS is SMS.
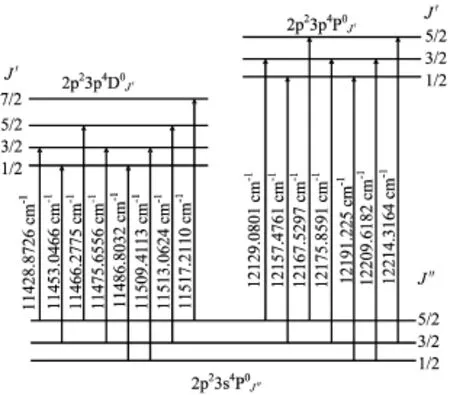
The schematic energy level diagram of thetransitions is shown in Fig.3.The transitions were assigned base on the data in NIST's database.The transition frequencies are extracted from our experimental data. From Fig.3,we can give the difference between two energy levels. For instance,the difference between the observed transitions in linesandgives the difference between the energy levels of
A.3s4PJ→3p4LoJ(L=P or D)transitions
Table II listed the experimentally measured specific mass shifts oftransitions.The field shifts are neglected.In Table II,the lines of a multiplet do not exhibit the same isotope shifts and the shifts in the energy levels depend on the J-value.That is due to that the involved transitions of nitrogen atom are not a case of pure Russell-Saunders coupling,the shifts are J-dependence. Holmes[2]first listed some J-dependence for theterms of nitrogen,for example the ISs measured difference relative toandis 51(33)MHz.Cangiano et al.[4] reported some J-dependence for the SMS ofterm,they obtained 110(300)and 318(300)MHz for the SMS differences 5/2−3/2 measured relative to 3s4P5/2and 3s4P3/2,respectively.We got SMS differences of 41(20)and 62(18)MHz for these two levels respectively.Carette et al.and Jennerich et al.gave differences of 1.0(35)and−32.0(32)MHz with respect to the level 3s4P5/2.We obtained−48(17)and−26(41)MHz for the SMS differences 3/2-1/2 measured relative to 3s4P3/2 and 3s4P1/2,respectively.Only Cangiano et al.found a difference of−52(300)MHz for the level of

FIG.3 Schematic energy level diagram of the 2p23s4PJ,states,and the observed transitions between these states around 800 nm.
The experimental results of Cangiano et al. [4] showed a large J-dependence of thestates.Carette et al.[7]argued that the results from Cangiano et al.[4]are affected by a wrong assignment of the spectral lines.Our measured concentration modulation absorption spectra and Jennerich's saturated absorption spectra gave the SMS differences which are in the range 3−62 MHz.Carette's[7]saturation spectra gave a small J-dependence of these states.The results of Carette,Jennerich and present work exhibit small J-and L-dependence of the SMS for the 3p4Lo(L=P and D)upper states.However,the limited relativistic ab initio calculations estimate a J-dependence of maximum 1 MHz[7]for 3p4Lo,which is an order smaller than our and Jennerich's results.Thus,more accurate experimental and theoretical results need to be proceeded by different methods.
For the lower 3s4PJterm,Cangiano et al.gave the values of−340(300)and−548(300)MHz for the SMS differences between 3s4P5/2and 3s4P3/2sharing the same 3p4Po3/2and 3p4Po5/2,respectively.Our work gave the values of−146(13)and−167(25)MHz for the SMS difference related to 3s4P5/2−3/2,and−104(30) and−82(28)MHz for the SMS differences related to 3s4P3/2−1/2.
The SMS difference between the different J-values of the lower levels are larger than those between the different J-values of the upper levels intransitions.This result is the same as that of Carette's[7].
TABLE II Specific mass shifts(in MHz)of the transitions ofThe field shifts are neglected.

TABLE II Specific mass shifts(in MHz)of the transitions ofThe field shifts are neglected.
?
Table III listed the specific mass shifts ofThe values deduced from our data and that deduced from Holmes'analysis are shown.
The measured SMS difference between the upper levelsis−229(66)MHz,and the one between lower levels 3s2D5/2and 3s2D3/2is 99(39)MHz in present work.In Holmes'experiment,he measured the values of−276(66)and−222(45)MHz for the SMS difference between the upper levelssharing the same 3s2P3/2and 3s2P1/2,respectively. He also gave the value of 54(51)and 108(60)MHz for the SMS difference between the lower levels 3s2P3/2and 3s2P1/2sharing the same 3p2Po3/2and 3p2Po1/2. Holmes'and our results show that SMS difference between the different J-values of the lower levels and those between the different J-values of the upper levels of thetransitions are small compared with that oftransitions.
Cangiano et al.pointed out the J-dependence of the RIS values have been attributed by Keller et al.[15]to relativistic contributions and electron correlations affecting the SMS.The J-dependence of IS results from the higher-order IS effect,i.e.,the so-called crossedsecond-order(CSO)effect or the far configurationmixing effect[16].The CSO effect between the magnetic interaction and IS operators leads to the J-dependence of IS in a term of the pure configuration. In Jennerich's report,he argued that identification of these effects has generally been limited by the availability of experimental data.SMS measurements reveal the nuclear shell very distinctly,the structure at magic numbers can cause striking anomalies in the behavior of the IS of nitrogen.

TABLE III Specific mass shifts of the transitions of 3s2DJ′′→5p2DoJ′′and 3s2PJ′′→3p2PoJ′.The field shifts are neglected.
IV.CONCLUSION
We systematically measured the isotope shifts spectra of14N and15N around 800 nm by using concentration modulation absorption spectroscopy.By analyzing these experimental data,we obtained the ISs between the two stable isotopes of atomic nitrogen.Our experimental results are close to other groups'results using saturated absorption spectroscopy method.The SMS value oftransitions coming from the 3s4P5/2level is around 200 MHz larger than these coming from the 3s4P3/2level,and around 300 MHz larger than these coming from the 3s4P1/2level.Fortransitions,we can see the similar result.It may be concluded that the J value of the lowerlevel 3s4P has a dominant contribution to the SMS values in both thetransitions.The larger J value in 3s4P level is,the larger IS value of the transition is.Similar phenomenon can be seen in Jennerich and Carette's results.Fortransitions,the J value of the upper levelhas dominant role in the SMS values. The larger the J value is,the smaller the IS value is. Holems'experimental data show the similar result for thetransitions.These results may be useful for comparing with highly red-shifted quasar absorption lines of nitrogen atom in order to obtain the fine structure constants,and can be used as a comparable experimental data for performing theoretical calculations on the anomalous isotope shift behavior in N atoms.
V.ACKNOWLEDGMENTS
This work was supported by the National Natural Science Foundation of China(No.61205198).
[1]K.Heilig and A.Steudel,At.Data Nucl.Data Tables 14,613(1974)
[2]J.R.Holmes,Phy.Rev.63,41(1943).
[3]J.R.Holmes,J.Opt.Soc.Am.41,360(1951).
[4]P.Cangiano,M.Angelis,L.Gianfrani,G.Pesce,and A.Sasso,Phys.Rev.A 50,1082(1994).
[5]R.M.Jennerich,A.N.Keiser,and D.A.Tate,Eur. Phys.J.D 40,81(2006).
[6]P.J¨ohsson,T.Carette,M.Nemouchi,and M.Godefroid,J.Phys.B 43,115006(2010).
[7]T.Carette,M.Nemouchi,P.J¨ohsson,and M.Godefroid,Eur.Phys.J.D 60,231(2010).
[8]R.J.Wang,Y.Q.Chen,P.P.Cai,J.J.Lu,Z.Y.Bi, X.H.Yang,and L.S.Ma,Chem.Phys.Lett.307,339 (1999).
[9]L.H.Deng,Y.Y.Zhu,C.L.Li,and Y.Q.Chen,J. Chem.Phys.137,054308(2012).
[10]IODINESPEC4,Toptica Photonics,Munich,Germany (http://www.toptica.com).
[11]II.Sobel’man,Introduction to the theory of atomic spectra,New York:Springer-Verlag,(1986).
[12]W.H.King,Isotope Shifts in Atomic Spectra,New York:Plenum Press(1984).
[13]D.Bender,H.Brand,and V.Pfeufer,Z.Phys.A 318, 291(1984).
[14]J.G.Li,C.Naz´e,M.Godefroid,G.Gaigalas,and P. J¨onsson,Eur.Phys.J.D 66,290(2012).
[15]J.C.Kelley,J.Phys.B 6,1771(1973).
[16]J.Bauche and R.J.Champeau,Adv.At.Mol.Phys. 12,39(1976).
(Dated:Received on February 29,2016;Accepted on May 6,2016)
 CHINESE JOURNAL OF CHEMICAL PHYSICS2016年5期
- CHINESE JOURNAL OF CHEMICAL PHYSICS的其它文章
- Preparation of Bio-hydrogen and Bio-fuels from Lignocellulosic Biomass Pyrolysis-Oil
- Combination Computing of Support Vector Machine,Support Vector Regression and Molecular Docking for Potential Cytochrome P450 1A2 Inhibitors
- Working Condition Real-Time Monitoring Model of Lithium Ion Batteries Based on Distributed Parameter System and Single Particle Model
- Hydrodeoxygenation of Anisole over Ni/α-Al2O3Catalyst
- Highly Efficient and Selective Removal of Pb(II)ions by Sulfur-Containing Calcium Phosphate Nanoparticles
- Efficient Removal Phenol Red over Ternary Heterostructured Ag-Bi2MoO6/BiPO4Composite Photocatalyst
