1-D coupled non-equilibrium sediment transport modeling for unsteady flows in the discontinuous Galerkin framework*
Farzam Safarzadeh MALEKI, Abdul A. KHAN
1. Engineering Department, Massachusetts Maritime Academy, Buzzards Bay, MA 02532, USA,
E-mail: fmaleki@maritime.edu
2. Glenn Department of Civil Engineering, Clemson University, Clemson, SC 29634, USA
1-D coupled non-equilibrium sediment transport modeling for unsteady flows in the discontinuous Galerkin framework*
Farzam Safarzadeh MALEKI1, Abdul A. KHAN2
1. Engineering Department, Massachusetts Maritime Academy, Buzzards Bay, MA 02532, USA,
E-mail: fmaleki@maritime.edu
2. Glenn Department of Civil Engineering, Clemson University, Clemson, SC 29634, USA
A high-resolution, 1-D numerical model has been developed in the discontinuous Galerkin framework to simulate 1-D flow behavior, sediment transport, and morphological evaluation under unsteady flow conditions. The flow and sediment concentration variables are computed based on the one-dimensional shallow water flow equations, while empirical equations are used for entrainment and deposition processes. The sediment transport model includes the bed load and suspended load components. New formulations for Harten-Lax-van Leer (HLL) and Harten-Lax-van Contact (HLLC) are presented for shallow water flow equations that include the bed load and suspended load fluxes. The computational results for the flow and morphological changes after two dam break events are compared with the physical model tests. Results show that the modified HLL and HLLC formulations are robust and can accurately predict morphological changes in highly unsteady flows.
dam break flow, sediment transport modeling, Harten-Lax-van Leer (HLL) and Harten-Lax-van Contact (HLLC) flux functions, discontinuous Galerkin scheme
Introduction
Sediment transport modeling is of great importance in investigating morphological changes in rivers,coastal areas, and estuaries under steady and unsteady flows. Significant morphological changes occur during major flood events and highly unsteady flows, such as dam break floods. Floods resulting from dam break are not uncommon, Graham and Major[1]compiled a list of floods resulting from dam failures in the United States that cause major damage. Over the last decade,several numerical models[2-4]have been developed for solving shallow water flow equations over fixed bed. However, the strong entrainment/deposition capability of transient flows in such events, which leads to major morphological changes, cannot be ignored. As pointed out by Wu and Wang[5], in earlier studies either the coupling between flow, sediment transport, and bed change was ignored, or the assumption of local equilibrium of sediment transport with the flow conditions was used. Cao et al.[6]studied both the equilibrium and non-equilibrium models for fluvial sediment transport and found that for the bed load sediment transport the differences between equilibrium and non-equilibrium models were essentially negligible, while non-equilibrium modeling was critical for suspended sediment transport. However, in the case of highly unsteady flow,such as resulting from a dam break, the assumption of equilibrium sediment transport may not be valid[7]. Fraccarollo and Capart[8]examined the sudden erosional flow initiated by the release of a dam break wave over a loose sediment bed. However, due to the assumption of constant sediment concentration at lower level, the applicability of the model is limited to low concentration cases.
Cao et al.[9]presented a dam break flow model on a mobile bed with non-equilibrium sediment transport and morphological evolution. The model over-predicted channel erosion[5]. Simpson and Castelltort[10]introduced a model that coupled water flow and sediment transport dynamics. The model was based on theshallow water flow equations, conservation of sediment concentration, and empirical functions for bed friction, beds erosion, and deposition. Wu and Wang[5]developed a 1-D model for dam break flows over movable bed based on the upwind scheme of Ying et al.[11,12]. Physical model tests of dam break flows over mobile bed were used to validate the numerical model. Abderrezzak and Paquier[13]proposed a 1-D mathematical model that accounted for changes in channel cross sectional geometry with time by incorporating various approaches for updating cross-sectional shape.
To date, there is no specific study of coupled flow and sediment transport modeling using the discontinuous Galerkin framework. In this paper, the flow and morphological evolution after dam failure is investigated. The Harten-Lax-van Leer (HLL) and Harten-Lax-van Contact (HLLC) formulations are modified to include the treatment of numerical fluxes associated with suspended and bed load sediment transport. Additionally, the performance of the two approximate Riemann solvers is investigated.
1. Sediment transport
Sediment transport in natural environment can be classified as bed load and suspended load[14]. The sediment transport can be assumed to be in equilibrium state or non-equilibrium state. In equilibrium state, sediment transport is assumed to be always at equilibrium (also called capacity) and governed by the local flow conditions. In contrast, the non-equilibrium treatment accounts for the time and space required for sediment particles to adapt to its potential equilibrium state[5]. Several researchers[15,16]have used equilibrium sediment transport concept in their models, while other researchers[7,14]used non-equilibrium sediment transport concept.
Although the equilibrium sediment transport assumption is valid for long term simulations, the lag effects in highly unsteady flow events, such as dam break flows and flash floods, cannot be ignored[17]. In non-equilibrium sediment transport, the adaptation length and suspended load adaptation coefficient play an important role in determining the eventual bed profile. Many researchers have proposed different formulations for non-equilibrium adaptation length[5,9,13]. However, it is well established[14]that these two parameters are case dependent and calibration for a particular scenario should be considered.
2. Mathematical model
The generalized form of 1-D shallow water flow equations for the unsteady water-sediment mixture are the mass and momentum conservation equations as given by Eqs.(1) and (2)[5]. The source terms in these equations account for the interaction of flow and sediment, and bed change. In these equationst is time,A is the flow area,Qis the discharge of the watersediment mixture,xis the longitudinal coordinate,P is the porosity of the bed material,B is the width of the channel at the water surface,D andEare sediment deposition and entrainment,Lis the non-equilibrium adaptation length for the total load,Qb*is the equilibrium bed-load transport rate and can be defined by empirical formulae[18],Q is the actual bed load transport,g is the gravitational acceleration,Zis the water surface elevation,nis the Manning's roughness coefficient,R is the hydraulic radius,hlis the local flow depth,ρis the density of water and sediment mixture and is given by ρ=ρw(1-Ct)+ ρsCt,Ctis the volumetric concentration of total sediment load,ρwis the density of water, and ρsis the density of sediment.
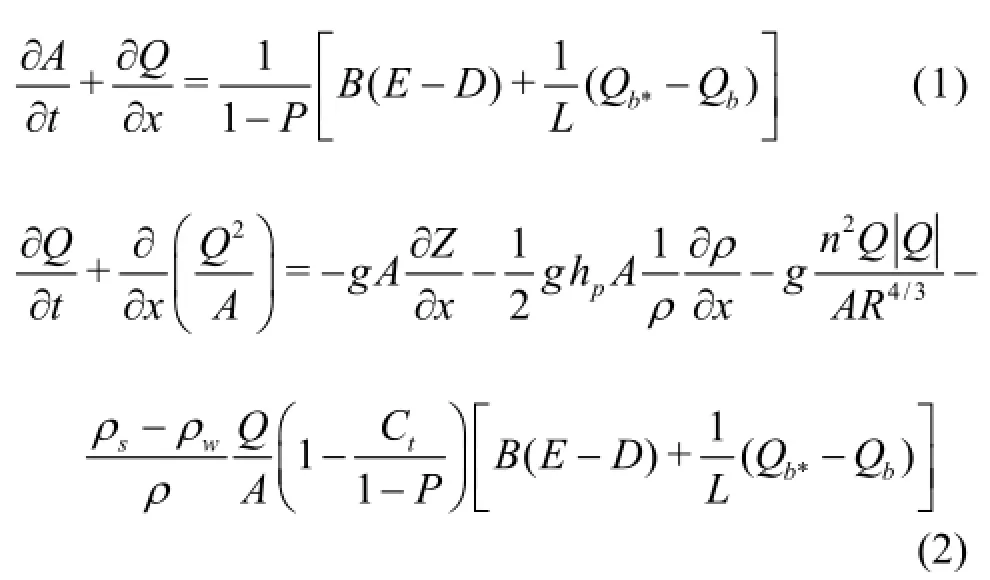
In the mass conservation equation, Eq.(1), the source term (right hand side of the equation) represents the change in bed elevation due to change in suspended load through entrainment and/or deposition. In the momentum equation, Eq.(2), there are two additional terms compared to the clear water flow equations. The second term on the right hand side of the equation reflects the effect of spatial variation of mixture density[9]. The last term on the right hand side of the equation represents the momentum interactions between the water columns and the erodible bed.
Suspended and bed load transport rate can be mathematically defined by Eqs.(3) and (4)[5], respectively, whereC is cross section averaged volumetric concentration of suspended load and ubis the velocity of the bed load (usually approximated by the average flow velocity). The total load transport rate,Qt, and the volumetric concentration of total load sediment,Ct, can be defined by Eq.(5).


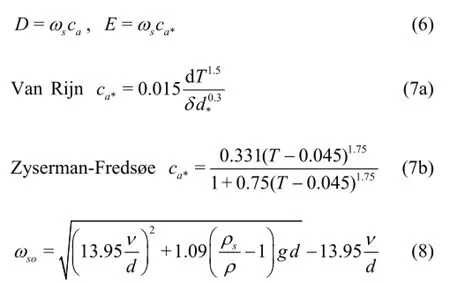
The sediment deposition and entrainment are described by Eq.(6). In this equation,ωs=ωso(1-Ct)mis the settling velocity in water-sediment mixture,where ωsois the fall velocity of a single particle in clear water andm is a parameter taken as 4.0 in this study. The actual and equilibrium near bed concentration of suspended load are given by ca(=Cα)and ca*, respectively. Among many empirical formulas for ca*, equations proposed by Van Rijn[18]and Zyserman and Fredsøe[19]are tested in this study and are given by Eq.(7). In Eq.(7),d is the sediment size,T is the transport stage number,δ=max(2d,0.005h)is the reference level with h being the flow depth, andwithνbeing the kinematic viscosity. The transport stage number is defined as, whereβis a calibration factor, u*is the bed shear velocity, and u*cris the critical bed shear velocity based on the Shield's diagram. The effect of the bed slope is considered in the critical bed shear velocity[14], however, the results with and without the bed slope effect were the same for the tests conducted in this study. The non-equilibrium adaptation coefficient of suspended load (α) is defined as α=min[αo,(1-P)/C], where αois a parameter that needs to be calibrated for determining the non-equilibrium adaptation coefficient[5]. The settling velocity,ωso, is given by Eq.(8)[14].
The adaptation length for the total-load sediment transport,L , is given by Eq.(9), where Lbis the non-equilibrium adaptation length for the bed load, andu is the average flow velocity[5]. Equilibrium bed-load transport rate,Qb*, is defined by Eq.(10).
The porosity of the bed material, P , is given by Eq.(11)[20].


Fig.1 Illustration of discontinuities at element boundaries in the discontinuous Galerkin formulation
3. Numerical scheme
The system of hyperbolic equations can be written in the conservative form as given by Eq.(12). In this system,U,F, andS are the vectors of unknown variables, fluxes, and source terms, respectively, and are described in Eqs.(13) and (14). In the continuous finite element approach, the field variables(U)are forced to be continuous across the boundary,

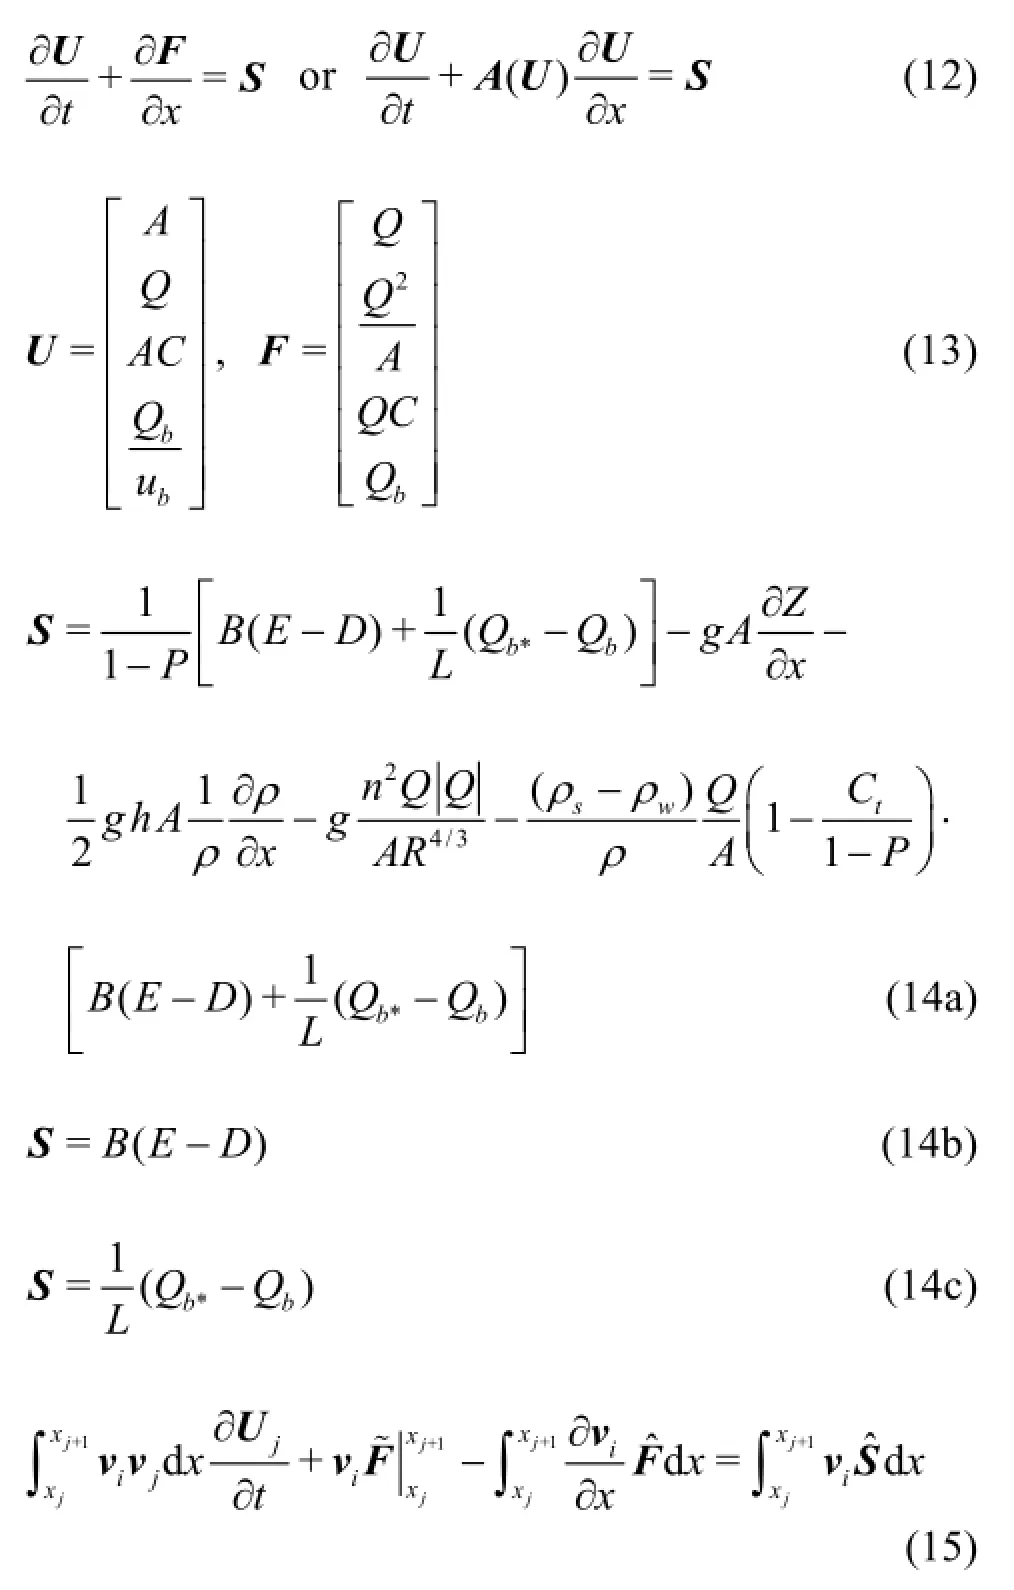
In discretizing the governing equations, numerical integration for the terms containing spatial derivatives can be written in a general form as ϕ(∂ψ/∂x)(such as 1st and 2nd terms in the source term of the momentum equation) and can be approximated using Eq.(16), where C1and C2are considered constants during integration[24,25].
As explicit time stepping schemes are used, each equation is integrated and solved independently. The integral forms of the mass and momentum equations are shown in Eqs.(7) and (8), respectively, where x1and x2are the end coordinates of an element and νi(i=1,2)are linear test or weight functions. In these equations, the flux terms are integrated by parts,where P( x, t)=Qis the flux term for the continuity equation andG( x, t)=Q2/Ais the flux function for the momentum equation. These flux functions at the element boundaries are calculated using approximate Riemann solvers. The approximate variablesandaswell as any functionare given by Eq.(9), whereνj(j=1,2)are linear shape or interpolating functions. For the Galerkin method, the test and shape functions are the same. To perform the integration, the global coordinates in Eqs.(7) and (8) are transformed to local coordinates.

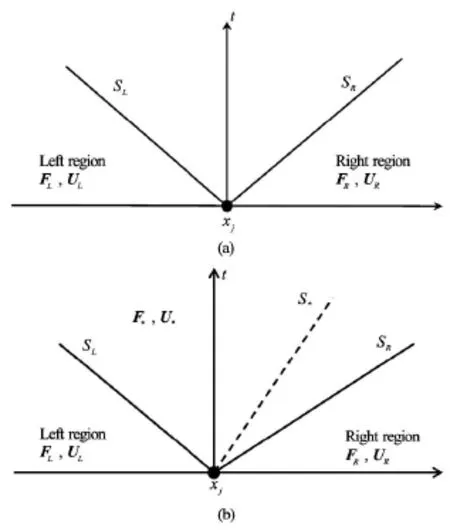
Fig.2 Wave structure for the approximate Riemann problem,where SLand SRare shock/rarefaction waves and S*is a contact wave
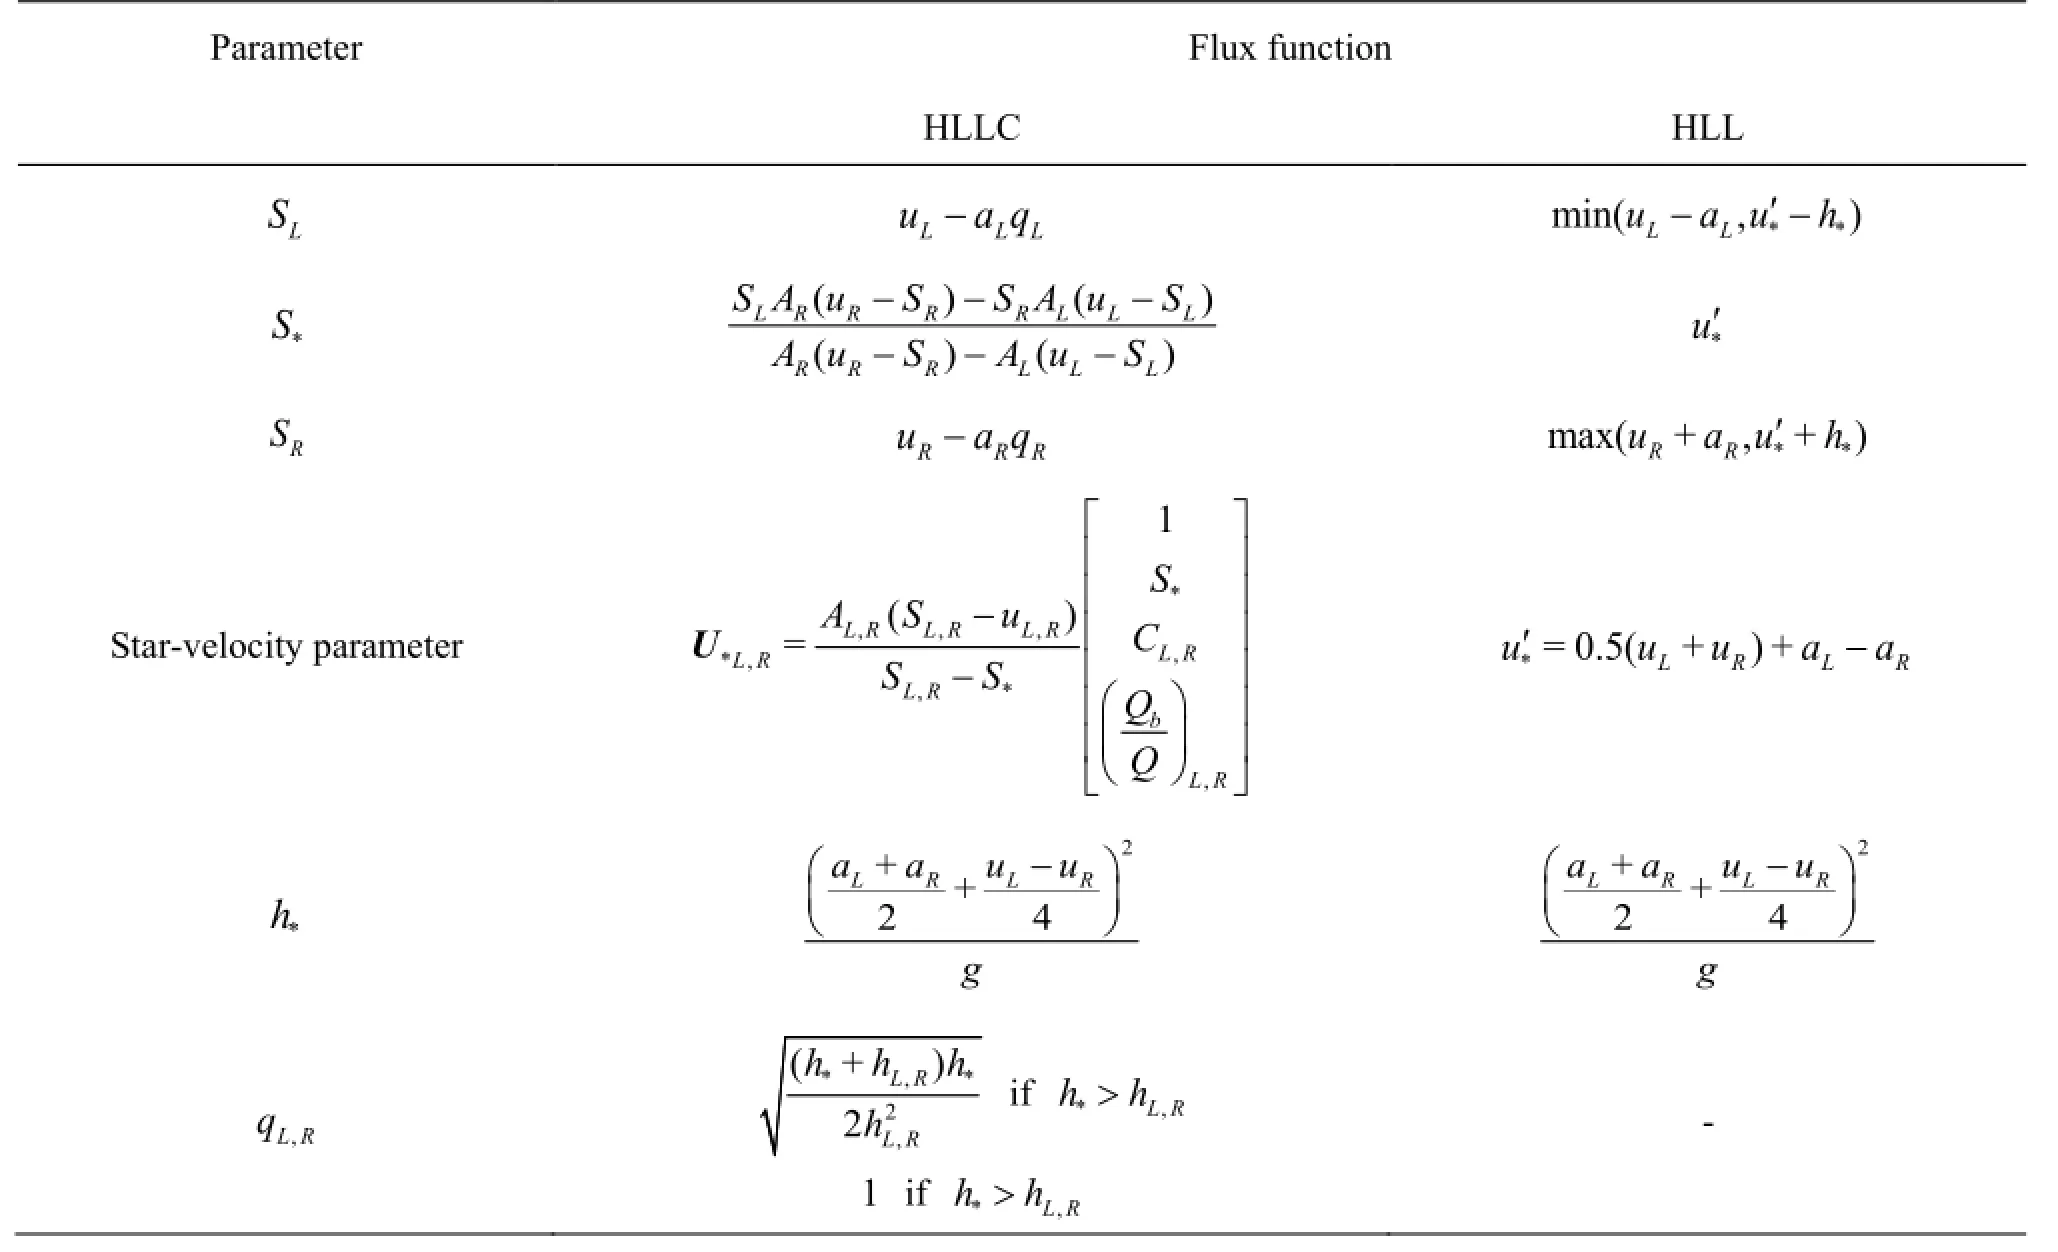
Table 1 Parameters involved in HLL and HLLC flux functions

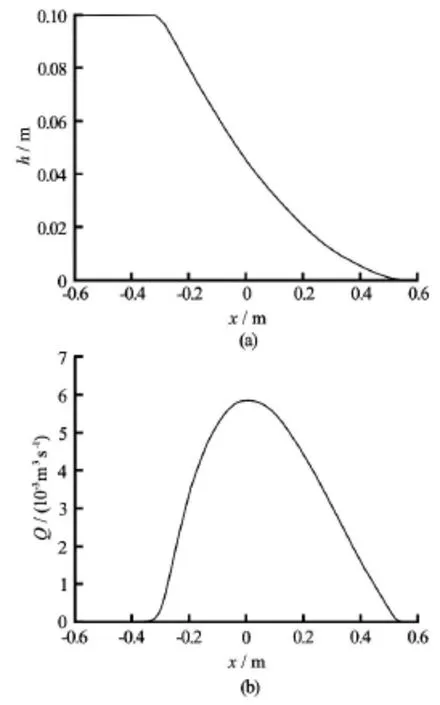
Fig.3 Water level(h)and volume flow rate(Q)for the Taipei case over fixed bed at 0.303 s
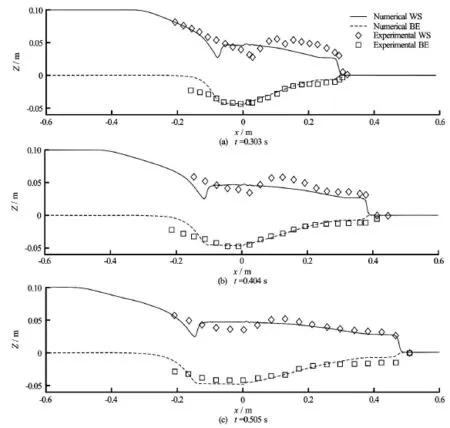
Fig.4 Water surface (WS) and bed elevation (BE) profiles for the Taipei case after the dam break
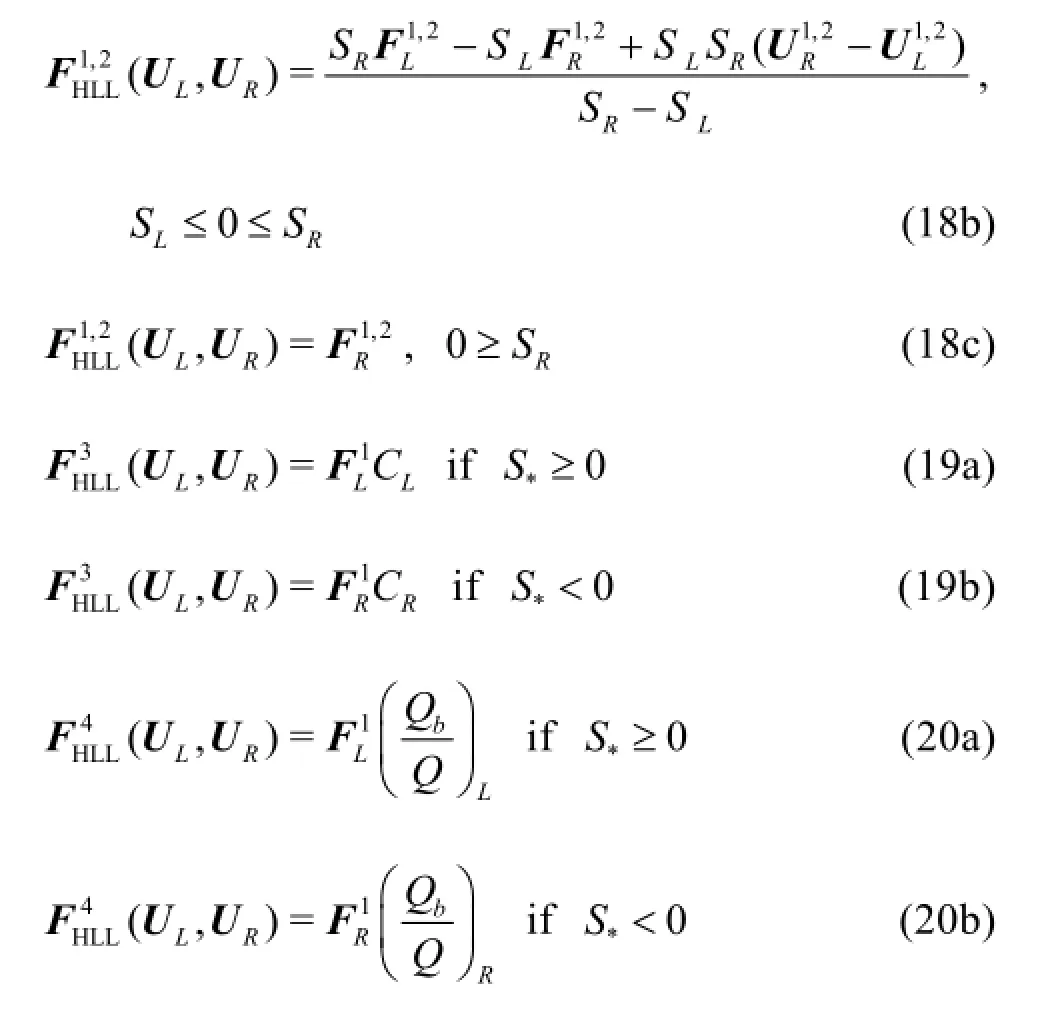
To close the system of equations, the bed deformation must be determined in each time step based on the combination of deposition/entrainment as well as equilibrium/non-equilibrium bed load transport rate difference as given by Eq.(21). The expression on the right hand side of the equation is evaluated at the previous time step.

4. Model performance
The accuracy of the developed model is examined in fixed and erodible bed dam break cases. Two sets of laboratory experiments are selected to verify the performance of the model in simulating flow and morphological changes after dam break event. Capart and Young[30]reported an experiment results for dam break flow over erodible bed in University of Taiwan,called Taipei case. Fraccarollo and Capart[8]presented another similar laboratory experimental data conducted in the University of Louvain, called Louvain case. Both experiments were performed in horizontal, rectangular cross section flumes. The Taipei case was conducted in a 1.2 m long, 0.2 m wide, and 0.7 m deepflume using sediment particles of 6.1×10⁻³m in3diameter. The density of sediment was 1 048 kg/m and settling velocity was 7.6×10⁻²m/s. In the Louvain case,sediment particles of 3.53×10⁻³m in diameter with density of 1 540 kg/m, and settling velocity of 0.18 m/s were used. A 2.5 m long, 0.1 m wide, and 0.25 m deep flume was used for the test. In both cases,before the removal of the dam, the water depth upstream of the dam was 0.1 m and the downstream bed was dry. The dams were located at mid-length and spanned the whole width of the channel. The dams are placed at x=0for simulating these tests.
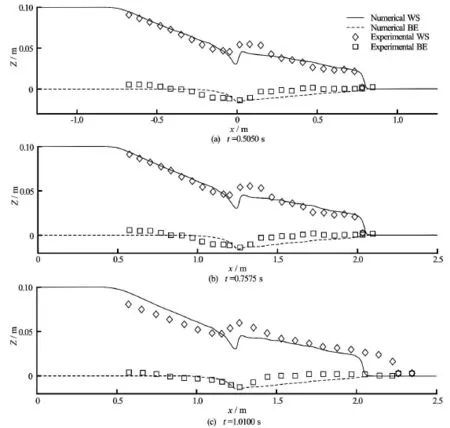
Fig.5 Water surface (WS) and bed elevation (BE) profiles for the Louvain case after the dam break
To simulate the Taipei and Louvain cases, the domains are discretized using element sizes of 5× 10⁻³m, 2.5×10⁻³m, and 10-3cm, and time steps of 0.001 s, 0.000375 s, and 0.0001 s, respectively. The stability of explicit scheme is subject to the Courant-Friedrichs-Lewy (CFL) condition, the maximum CFL criteria of 0.38 for Taipei case and 0.24 for Louvain case are used. The sensitivity of the simulated results to element and time step sizes is investigated by considering three different time steps/element size. Results showed that by restricting the maximum CFL criteria, the model is not sensitive to time step/element size. In order to simulate the dry bed, two different approaches are tested[11,22]. In the first method, for the initial dry bed downstream of the dam a small depth (ε= 10-6m) and zero discharge are specified. During simulation, if the computed depth at a node is less than ε, the depth is set toεand discharge is set to zero at that node. In the second approach, a small depth,ε,is used as a check to track wet/dry front. The water depth is set to zero for the dry bed area. If the computed water depth at a node is less thanε, the velocity and discharge are set to zero. Both approaches provided same level of accuracy for tests conducted in this paper. However, the results shown are based on the second approach. In both tests, Van Rijn's formulation is used for determining equilibrium near bed concentration for suspended load. The comparison between the Van Rijn's and Zyserman-Fredsøe's formulations for the equilibrium near bed concentration is provided later. Figure 3 shows the water surface as well as the volume flow rate for the Taipei test over fixed bed at 0.30 3 safte r the removal of thedam.The measured data forthewatersurfaceprofileforthefixedbedisnot available. The test was conducted using HLL and HLLC flux functions and provided similar results for the water surface profile and volume flow rate. The aim of the test is to show that scheme can model the dam break flow accurately without any oscillations.
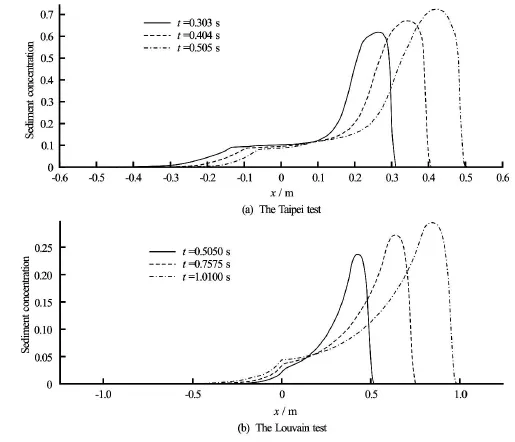
Fig.6 Total load sediments concentration

Fig.7 Comparison of two empirical formulas for the equilibrium near bed concentration of suspended load
Figure 4 shows the simulated and measured bed and water surface profiles for the Taipei case at three different times after the removal of the dam using the HLLC flux function. The calibration factor,β, is found to be 2.1 for this case. The non-equilibrium adaptation length for the bed load,Lb, is found to be 0.25 m and the non-equilibrium adaptation coefficient is determined usingαovalue of 2.0. The values for the calibration factor, non-equilibrium adaptation length, andαoare determined to achieve the best fit with the measured data. As shown in Fig.4, the bed deformations are simulated accurately, however the simulated hydraulic jumps are located upstream compared to the measured data. The predicted water surface profiles agree better with the measured data at later stages of the test.
In Fig.5, the simulated results for the Louvain test are compared with the measured data at three different times after the dam removal using the HLLC flux function. In this case, the calibration factor,β,is found to be 1.2. Similar to the Taipei test, the values for the non-equilibrium adaptation length for the bed load and αoare found to be 0.25 m and 2.0, respectively. The hydraulic jump locations in this test are approximately at the dam location and are simulated accurately. The bed profiles are predicted accurately especially at later stages. The water surface profiles upstream and downstream of the jump are predicted accurately. At the jump locations, which are predictedat the points of maximum bed scour, the predicted water depth are lower than the measured data.
The total load sediment concentrations for both tests are shown in Fig.6. The smooth profiles of the sediment concentration are in good agreement with other simulated results[5,8]and indicate the stability of the scheme. The simulated results for water surface profiles, bed profiles, and sediment concentration using the discontinuous Galerkin framework are similar to that reported by other researchers using the finite volume method with Godunov scheme for flux approximation[5]and Riemann techniques developed in gas dynamics for modeling homogenous hyperbolic equations[8].
The HLL flux function was also evaluated for the two test cases and the results were found to be similar to that with the HLLC flux function. The simulations were also performed using the Zyserman-Fredsøe's formulation for equilibrium near bed concentration for suspended load. The simulated results are shown in Fig.7 and compared with the measured results at 0.303 s after the dam removal. The results show that maximum bed scour location and location of the hydraulic jump moves downstream with the use of Zyserman-Fredsøe's formulation. Except at the location of the hydraulic jump, the water surface profiles based on Van Rijn's and Zyserman-Fredsøe's formulations are similar. The bed elevation is over predicted using Zyserman-Fredsøe's formulation when compared to the van Rijn's formulation.
5. Conclusion
A 1-D shallow water flow and sediment transport model in discontinuous Galerkin framework has been developed. Coupled continuity, momentum, suspended load, bed load, and bed changes are explicitly solved using non-equilibrium sediment transport formulations. The HLL and HLLC flux functions for the 1-D shallow water flow equations are extended to include the suspended sediment and bed load flux terms. Two well-known experimental test cases (Taipei and Louvain cases) are simulated using the developed model. The two flux functions provide similar accuracy. The results show that bed profiles can be predicted accurately, albeit with the modification of the current sediment transport formulae for highly unsteady flows. The computed water surface profiles are in good agreement with the measured data except at the location of the hydraulic jump. Two empirical formulas for the equilibrium near bed concentration for suspended load are considered, results show that Zyserman-Fredsøe's formula provide better accuracy by moving the hydraulic jump location to downstream, however,the bed profile is over predicted.
References
[1] GRAHAM W. J., MAJOR U. S. dam failures: Their cause,resultant losses, and impact on dam safety programs and engineering practice[C]. Great River History Symposium at World Environmental and Water Resources Congress. Kansas City, Missouri, USA, 2009.
[2] COZZOLINO L., MORTE R. D. and GIUDICE G. D. et al. A well-balanced spectral volume scheme with the wetting-drying property for the shallow-water equations[J]. Journal of Hydroinformatics, 2012, 14(3): 745-760.
[3] DÜBEN P. D., KORN P. and AIZINGER V. A discontinuous/continuous low order finite element shallow water model on the sphere[J]. Journal of Computational Physics, 2012, 231(6): 2396-2413.
[4] KHAN A. A., BARKDOLL B. Two-dimensional depthaveraged models for flow simulation in river bends[J]. International Journal of computational Engineering Science, 2001, 2(3): 453-467.
[5] WU W., WANG S. S. One-dimensional modeling of dambreak flow over movable beds[J]. Journal of Hydraulic Engineering, ASCE, 2007, 133(1): 48-58.
[6] CAO Z., LI Z. and PENDER G. et al. Non-capacity or capacity model for fluvial sediment transport[J]. Proceedings of the ICE-Water Management, 2012, 165(4): 193-211.
[7] WU W., VIEIRA D. and WANG S. One-dimensional numerical model for nonuniform sediment transport under unsteady flows in channel networks[J]. Journal of Hydraulic Engineering, ASCE, 2004, 130(9): 914-923.
[8] FRACCAROLLO L., CAPART H. Riemann wave description of erosional dam-break flows[J]. Journal of Fluid Mechanics, 2002, 461: 183-228.
[9] CAO Z., PENDER G. and WALLIS S. et al. Computational dam-break hydraulics over erodible sediment bed[J]. Journal of Hydraulic Engineering, ASCE, 2004, 130(7): 689-703.
[10] SIMPSON G., CASTELLTORT S. Coupled model of surface water flow, sediment transport and morphological evolution[J]. Computers and Geosciences, 2006, 32(10): 1600-1614.
[11] YING X., KHAN A. A. and WANG S. S. Y. An upwind method for one-dimensional dam break flows[C]. Proceedings of XXX IAHR Congress. Thessaloniki, Greece,2003.
[12] YING X., KHAN A. A. and WANG S. S. Y. Upwind conservative scheme for the Saint Venant equations[J]. Journal of Hydraulic Engineering, ASCE, 2004, 130(10): 977-987.
[13] ABDERREZZAK K. E., PAQUIER A. One-dimensional numerical modeling of sediment transport and bed deformation in open channels[J]. Water Resources Research,2009, 45(5): 641-648.
[14] WU W. Computational river dynamics[M]. Abingdon,UK: CRC Press, Taylor and Francis Group, 2007.
[15] CUI Y., PAOLA C. and PARKER G. Numerical simulation of aggradation and downstream fining[J]. Journal of Hydraulic Research, 1996, 34(2): 185-204.
[16] GOUTIÈRE L., SOARES-FRAZÃO S. and SAVARY C. et al. One-dimensional model for transient flows involving bed-load sediment transport and changes in flow regimes[J]. Journal of Hydraulic Engineering, ASCE, 2008,134(6): 726-735.
[17] ZHANG S. Numerical study of sediment transport under unsteady flow[D]. Doctoral Thesis, Tucson, USA: The University of Arizona, 2011.
[18] Van RIJN L. Sediment transport, Part II: Suspended load transport[J]. Journal of Hydraulic Engineering, ASCE,1984, 110(11): 1613-1641.
[19] ZYSERMAN J., FREDSØE J. Data analysis of bed concentration of suspended sediment[J]. Journal of Hydraulic Engineering, ASCE, 1994, 120(9): 1021-1042.
[20] WU W., WANG S. Formulas for sediment porosity and settling velocity[J]. Journal of Hydraulic Engineering,ASCE, 2006, 132(8): 858-862.
[21] ZHOU J. G., CAUSON D. M. and MINGHAM C. G. et al. The surface gradient method for the treatment of source terms in the shallow-water equations[J]. Journal of Computational Physics, 2001, 168(1): 1-25.
[22] LAI W., KHAN A. A. Discontinuous Galerkin method for 1-D shallow water flow in nonrectangular and nonprismatic channels[J]. Journal of Hydraulic Engineering,ASCE, 2012, 138(3): 285-296.
[23] LAI W., KHAN A. A. A discontinuous Galerkin method for two-dimensional shallow water flows[J]. International Journal of Numerical Methods in Fluids, 2012,70(8): 939-960.
[24] LAI Wencong, KHAN Abdul A. Modeling dam-break flood over natural rivers using discontinuous Galerkin method[J]. Journal of Hydrodynamics, 2012, 24(4): 467-478.
[25] LAI W., KHAN A. A. Discontinuous Galerkin method for 1D shallow water flows in natural rivers[J]. Engineering Applications of Computational Fluid Mechanics, 2012,6(1): 74-86.
[26] HARTEN A., LAX P. and Van LEER B. On upstream differencing and Godunov type methods for hyperbolic conservation laws[J]. SIAM Review, 1983, 25(1): 35-61.[27] TORO E. F. Riemann solvers and numerical methods for fluid dynamics: A practical introduction[M]. Dordrecht, The Netherlands: Springer Science+ Business Media, 2009.
[28] MALEKI Farzam Safarzadeh, KHAN Abdul A. Effect of channel shape on selection of time marching scheme in the discontinuous galerkin method for 1-D open cha- nnel flow[J]. Journal of Hydrodynamics, 2015, 27(3): 413-426.
[29] KHAN A. A., LAI W. Modeling shallow water flows using the discontinuous Galerkin method[M]. Abingdon,UK: CRC Press, Taylor and Francis Group, 2014.
[30] CAPART H., YOUNG D. L. Formation of a jump by the dam-break wave over a granular bed[J]. Journal of Fluid Mechanics, 1998, 372: 165-187.
10.1016/S1001-6058(16)60658-3
January 23, 2015, Revised September 11, 2015)
* Biography: Farzam Safarzadeh MALEKI (1983-),Male, Ph. D., Assistant Professor
Corresponging author: Abdul A. KHAN,E-mail: abdkhan@clemson.edu
2016,28(4):534-543
- 水动力学研究与进展 B辑的其它文章
- Effect of some parameters on the performance of anchor impellers for stirring shear-thinning fluids in a cylindrical vessel*
- Numerical simulation of flow characteristics for a labyrinth passage in a pressure valve*
- Effect of head swing motion on hydrodynamic performance of fishlike robot propulsion*
- A parameter analysis of a two-phase flow model for supersaturated total dissolved gas downstream spillways*
- Prediction of oil-water flow patterns, radial distribution of volume fraction,pressure and velocity during separated flows in horizontal pipe*
- Motion and deformation of immiscible droplet in plane Poiseuille flow at low Reynolds number*

