
大洋平板俯冲的数值模拟再现: 洋–陆汇聚速率影响
2016-08-04 09:56:27皇甫鹏鹏王岳军范蔚茗李忠海王喻鸣周永智
大地构造与成矿学 2016年3期
皇甫鹏鹏, 王岳军, 范蔚茗, 李忠海, 王喻鸣, 周永智
(1.中国科学院 广州地球化学研究所 同位素地球化学国家重点实验室, 广东 广州 510640; 2.中国科学院大学 计算地球动力学重点实验室, 地球科学学院, 北京 100049; 3.中山大学 地球科学与地质工程学院,广东 广州 510275; 4.中国科学院 青藏高原研究所 卓越研究中心, 北京 100101; 5.广州市执信中学, 广东广州 510080)
大洋平板俯冲的数值模拟再现: 洋–陆汇聚速率影响
皇甫鹏鹏1, 2, 3, 王岳军3, 4*, 范蔚茗4, 李忠海2, 王喻鸣5, 周永智3
(1.中国科学院 广州地球化学研究所 同位素地球化学国家重点实验室, 广东 广州 510640; 2.中国科学院大学 计算地球动力学重点实验室, 地球科学学院, 北京 100049; 3.中山大学 地球科学与地质工程学院,广东 广州 510275; 4.中国科学院 青藏高原研究所 卓越研究中心, 北京 100101; 5.广州市执信中学, 广东广州 510080)
利用地球动力学数值模拟方法探讨了洋-陆汇聚时, 大洋岩石圈的绝对俯冲速率和上覆大陆岩石圈的向洋绝对逆冲速率对俯冲模式的影响, 尤其是上覆大陆的向洋绝对逆冲速率与平板俯冲之间的关系。模型结果显示, 对于年龄为40 Ma的含正常洋壳厚度的大洋岩石圈, 在初始俯冲角度为现今洋–陆俯冲平均倾角的极小值(19°)条件下, 低速大洋俯冲(绝对俯冲速率≤3 cm/a)且上覆大陆岩石圈向洋绝对逆冲速率≥1 cm/a时, 具备形成平板俯冲的条件。当中–高速大洋俯冲(绝对俯冲速度>3 cm/a)时, 在上覆大陆的绝对逆冲速率不小于俯冲速率时可以形成平板俯冲。当增加初始俯冲角度到平均倾角的极大值(36°)时, 仅在低速大洋俯冲(绝对俯冲速率≤3 cm/a)且绝对逆冲速率达到 10 cm/a时(自然界中基本不存在), 才有可能出现平板俯冲, 其他情况均表现为陡俯冲。我们的模拟结果表明: (1)较高的大洋岩石圈绝对俯冲速率更容易克服板间耦合作用力而有利于陡俯冲形成; (2)较高的上覆大陆绝对逆冲速率更有利于俯冲板片弯曲而趋向于平板俯冲形成; (3)上覆大陆朝向海沟的逆冲速率会在俯冲板片下方产生水平向陆的地幔流, 绝对逆冲速率越大该地幔流越强烈,导致作用于板片下表面的水平剪切分量越大而有利于板片弯折和平板俯冲发生; (4)初始俯冲角度的增加对平板俯冲的形成起到强烈抑制作用。这些能被现今平板俯冲, 如具相似洋–陆汇聚速率条件的南美洲西海岸平板俯冲实例所验证。
平板俯冲; 数值模拟; 俯冲速率; 大陆岩石圈向洋逆冲速率; 洋壳初始俯冲角度
0 引 言
根据洋–陆俯冲带内是否存在水平垫置于上覆大陆岩石圈底部的俯冲板片将大洋俯冲分为平俯冲(平板俯冲)和陡俯冲。但是现有资料显示, 平板俯冲作为一种重要而又特殊的俯冲模式仅占现今全球洋–陆俯冲带总长度的 10%左右(图1, Gutscher et al., 2000a; Gutscher, 2002), 且集中发育于智利中部(Kay and Abbruzzi, 1996)、秘鲁(Petford and Atherton, 1996)、厄瓜多尔(Beate et al., 2001)、哥斯达黎加(Grafe et al., 2002; Gardner et al., 2013)、墨西哥西南部(Suarez et al., 1990; Skinner and Clayton, 2011)、美国西海岸卡斯凯迪亚地区(Defant and Drummond, 1993)、阿拉斯加东南部(Fuis et al., 2008)及日本南开海槽(Morris, 1995)。
与常见的大洋陡俯冲相比, 平板俯冲常伴随一系列特殊地质现象, 如上覆大陆岩石圈挤压变形强烈、地壳增厚明显, 从海沟向大陆内部规律性出现大陆弧火山活动或间歇性岩浆活动(Gutscher et al., 2000a; Kay and Mpodozis, 2001; Sigloch et al., 2008),同时伴随地表的动态抬升和俯冲带上覆岩石圈的异常热结构(Dávila and Lithgow-Bertelloni, 2015)。正因如此, Gurscher et al. (2000a)用平板俯冲模型解释了南美洲西海岸区域出现的与年轻大洋岩石圈俯冲相关的上新世–第四纪埃达克火山岩; Sigloch et al. (2008)提出包含长距离平板俯冲的双阶段俯冲模型解释了北美西部 75~70 Ma的大范围异常岩浆作用和长距离陆内造山运动。
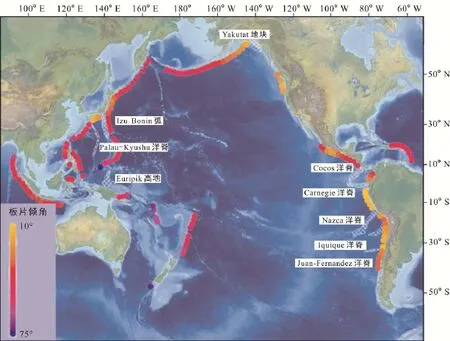
图1 环太平洋俯冲带大洋板片倾角示意图(据Skinner and Clayton, 2011修改; 数据来自Lallemand et al., 2005; 图中白色网格表示与平板俯冲区域相关联洋脊)Fig.1 Map of circum-Pacific sunduction zone showing the dip angle of the subducting slabs
近 20年的研究对形成平板俯冲的影响因素取得了重要认识, 认为影响平板俯冲发生最重要的因素是俯冲板片的正浮力作用(Pilger, 1981; Brocher et al., 1994; Kay and Abbruzzi, 1996; Gutscher et al., 2000b; van Hunen et al., 2002b, 2004; Anderson et al., 2007; Espurt et al., 2008; Fuis et al., 2008; Sak et al., 2009; Skinner and Clayton, 2011), 同时上覆大陆岩石圈较冷的热结构和朝向海沟的绝对逆冲速率及板片吸力也有利于平板俯冲的发育(Stevenson and Turner, 1977; Tovish et al., 1978; Gutscher et al., 2000b; van Hunen et al., 2001, 2002a, 2002b, 2004; Perez-Gussinye et al., 2008; Li et al., 2011; Skinner and Clayton, 2011; Manea et al., 2012; Rodriguez-Gonzalez and Negredo, 2012)。尽管前人对平板俯冲形成机制研究较多, 但更多的研究仍集中于板片浮力因素。对于汇聚速率、尤其是上覆岩石圈向洋的绝对逆冲速率对俯冲模式的影响仍探究不多。
现今主要平板俯冲区域的统计数据(表 1)显示,除了所有平板俯冲区域都与年轻大洋岩石圈或浮力异常区相关外, 另一个重要特征是过半的区域, 其上覆大陆岩石圈向洋绝对逆冲速率都大于大洋岩石圈绝对俯冲速率。例如, 智利中部、秘鲁、厄瓜多尔和卡斯凯迪亚地区的大洋岩石圈绝对俯冲速率分别为3.0 cm/a, 2.5 cm/a, 1.6 cm/a和0.8 cm/a, 而上覆大陆朝向海沟的绝对逆冲速率分别达到 4.5 cm/a, 4.5 cm/a, 3.8 cm/a和2.4 cm/a。结合前人研究成果可知, 俯冲区域的速度边界条件是控制大洋俯冲模式的重要影响因素之一(Uyeda and Kanamori, 1979; Jarrard, 1986; Lallemand et al., 2005)。那么, 汇聚速率, 尤其是上覆大陆岩石圈绝对逆冲速率是如何影响洋–陆俯冲模式的?又是如何制约平板俯冲的形成?能否再现现今平板俯冲型式?这些问题对理解平板俯冲发生的动力条件尤为重要。为此, 本文利用二维地球动力学数值模拟方法研究了洋–陆汇聚时大洋岩石圈的绝对俯冲速率和上覆大陆岩石圈的向洋绝对逆冲速率对俯冲模式的影响效应, 限定了绝对逆冲速率的大小与平板俯冲形成之间的耦合关系, 并结合现今平板俯冲实例对模拟结果进行了讨论。
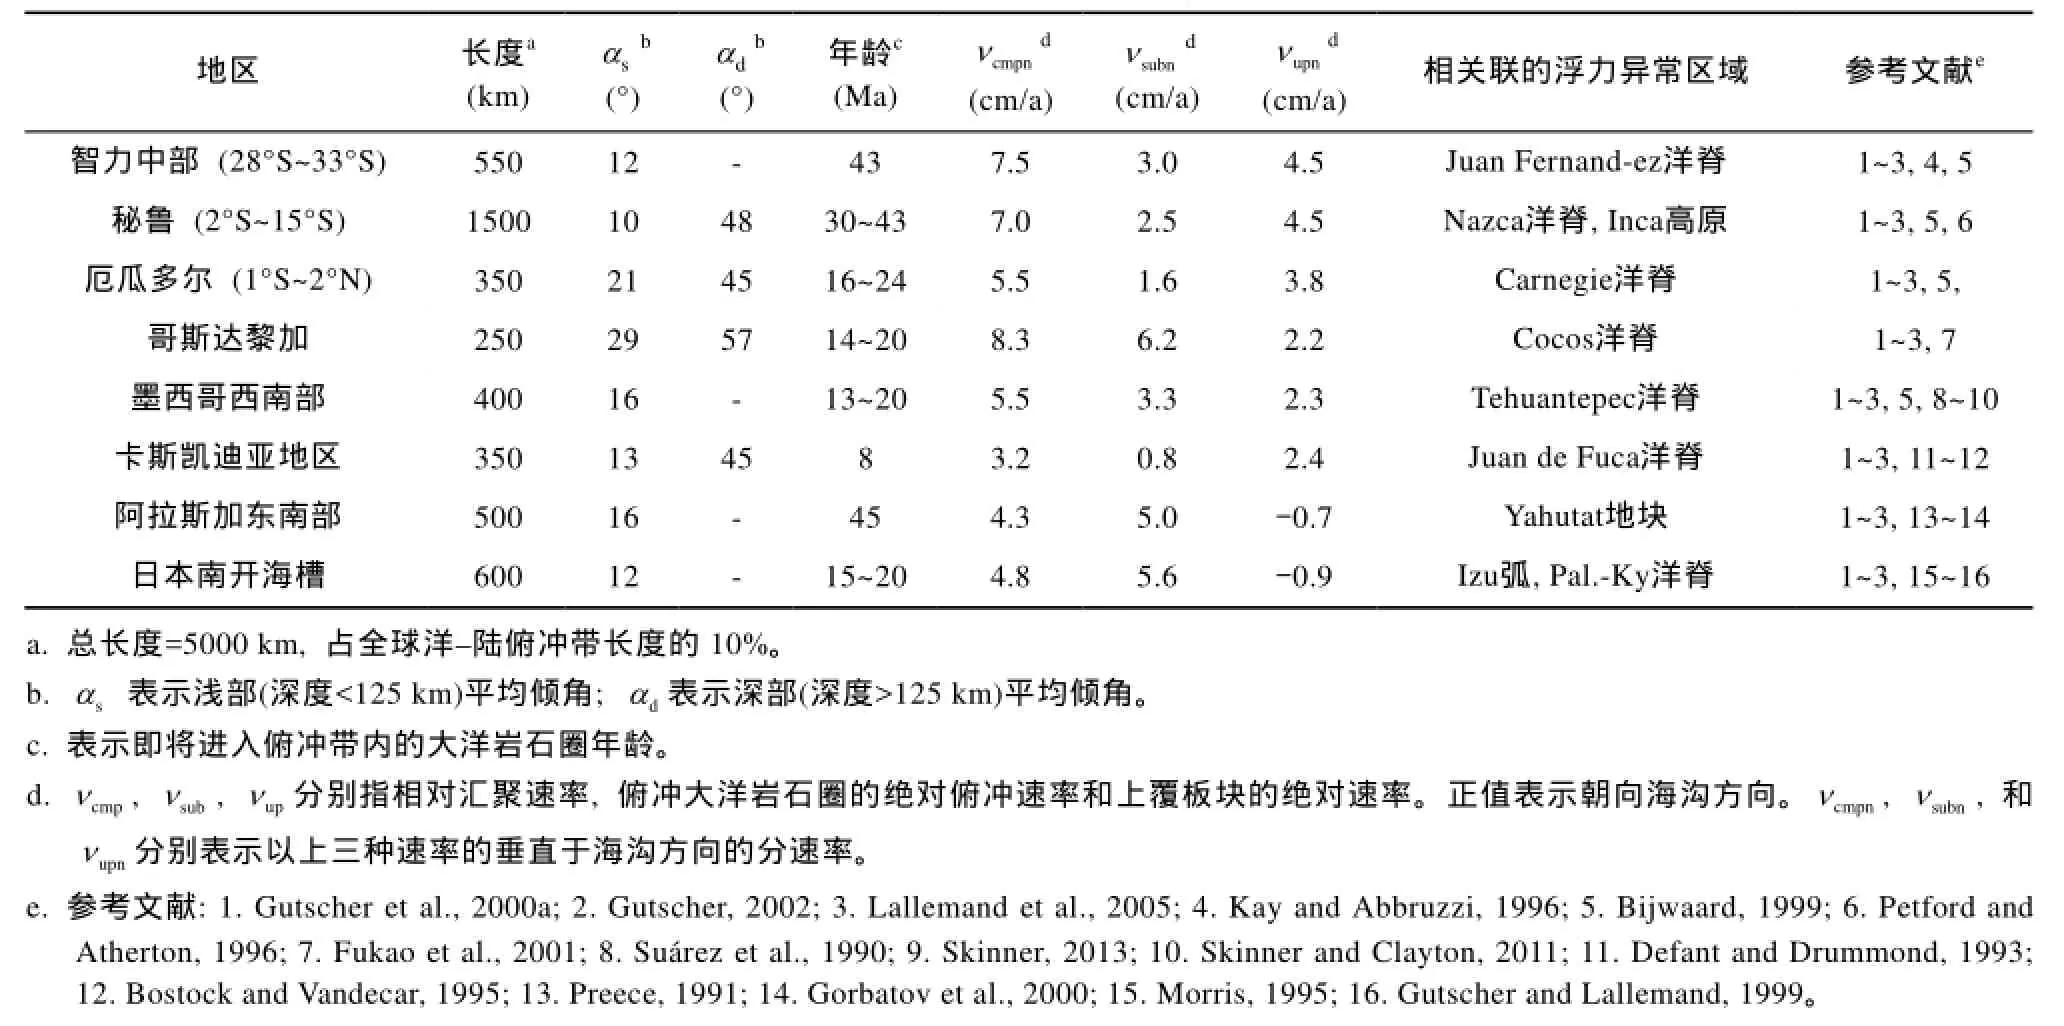
表1 现今平板俯冲区域的主要地球动力学参数Table 1 Main geodynamic conditions of the present-day flat subduction
1 数值模拟方法介绍
1.1 控制方程
本文模型计算采用二维地球动力学数值算法“I2VIS”(Gerya and Yuen, 2003a)。根据地球动力学特点, 一般主要针对三组控制方程进行求解计算, 包括斯托克斯流体动力学方程、物质守恒方程以及热量守恒方程(Li, 2014)。
(1) 斯托克斯方程:

其中, g是重力加速度; 密度ρ依赖于温度T、压力P、岩石类型C和部分熔融比例M;xxσ',zzσ'和xzσ'是偏应力张量。
(2) 不可压缩流体物质守恒方程:
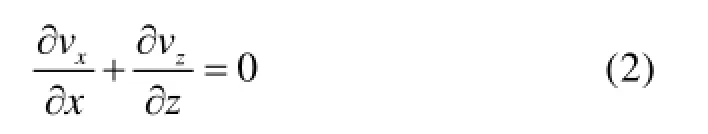
其中,xν和zν表示水平速度和垂向速度。
(3) 热量守恒方程:

其中, Cp是等压热容;表示温度对时间的物质导数; qx和qz代表水平方向和垂直方向热流值; k受热传导率, 受温度T、压力P和岩石类型C影响(Clauser and Huenges, 1995); Hr表示放射性生热,是仅与岩石类型相关的常量; Ha表示绝热变压生热, 与压力变化相关; Hs表示剪切生热; ε.xx, ε.zz和ε.xz是应变率张量。
1.2 粘–塑性流变学性质
偏应力张量和应变率张量采用粘–塑性本构方程, 对于不可压缩的粘滞性变形可表示为:
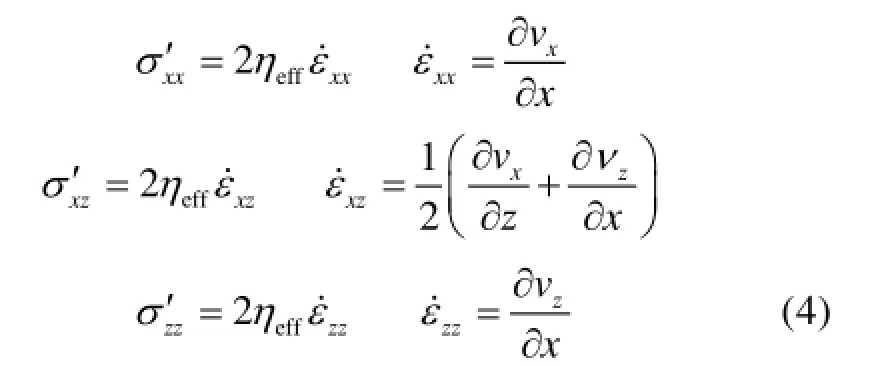
式中,effη 为有效粘滞系数, 是关于温度、压力、物质成分、应变率和熔融程度的函数。
韧性流变的粘滞系数与温度、压力、物质成分、应变率和熔融程度相关, 可表示为:

实际岩体的粘–塑性流变是韧性流变和脆性/塑性流变两者的结合。因此, 我们在数值算法中采用Mohr-Coulomb屈服准则(Ranalli, 1995):

式中,yieldσ为屈服应力;IIε.表示应变率张量二阶不变量;0C是 P=0条件下的岩石内聚力; φ是内摩擦角; λ是孔隙流体系数(Brace and Kohlstedt, 1980);表示有效内摩擦角, 与内摩擦角和孔隙流体系数相关。

1.3 部分熔融
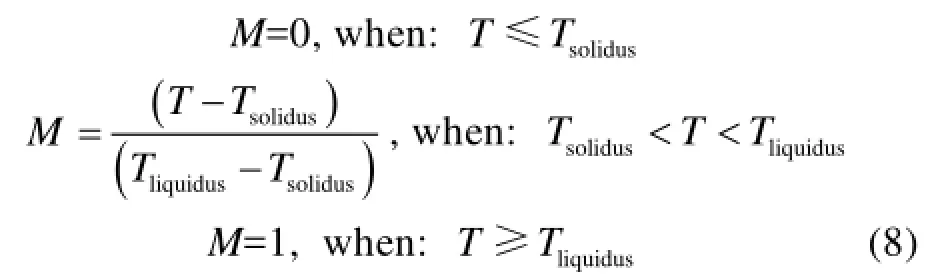
基于实验岩石学的约束条件, 该算法考虑了地壳岩石部分熔融行为(Gerya and Yuen, 2003b; Burg and Gerya, 2005)。并近似认为部分熔融体积比例与温度间存在如下线性关系:
部分熔融岩石的有效密度取决于熔融比例:


式中,0ρ代表岩石在P0= 0.1 MPa和T0= 298 K温压条件下的标准密度; α和β分别代表热膨胀系数和可压缩系数。
2 模型设计
根据现今全球洋–陆俯冲带剖面的统计结果,本文设计初始俯冲角度为19°和36°的两组模拟实验,分别对应于俯冲大洋板片平均倾角的极大值和极小值(Lallemand et al., 2005), 在上述两组模型基础上系统改变大洋岩石圈的绝对俯冲速率和上覆大陆岩石圈的向洋绝对逆冲速率, 以此探究上覆大陆岩石圈的向洋绝对逆冲速率对洋–陆俯冲模式的制约,以及初始俯冲角度对平板俯冲形成的影响。
设计初始模型长度为4000 km, 深度为670 km,使用不规则的有限差分单元对模型进行离散化, 其中俯冲带区域采用2 km×2 km单元, 而在模型边界区域采用30 km×30 km 单元。模型设计大洋板块和大陆岩石圈板块的初始长度均为2000 km, 如图2所示。其中, 大洋岩石圈年龄40 Ma, 厚度根据半空间冷却模型(Turcotte and Schubert, 2002)计算设计为74 km,其中洋壳厚度8 km, 大陆岩石圈厚度120 km(包括35 km的大陆地壳和85 km的岩石圈地幔, 而大陆地壳部分则设计为6 km大陆沉积物地壳、14 km上地壳和15 km下地壳)。不同单元内的岩石类型及其属性详见表 2和表 3。模型底部边界设计为渗透性边界, 采用近无限深度的外部自由滑动边界条件(Burg and Gerya, 2005; Ueda et al., 2008; Li et al., 2010)以满足在计算模型区域下方虚拟边界上(例如 100 km 处)的自由滑动条件, 其他边界则采用自由滑动的速度边界条件。与普通的自由滑动边界条件一样, 外部自由滑动边界条件同样需要满足计算区域内的物质守恒。模型计算过程中的洋–陆汇聚通过施加在大洋岩石圈朝向海沟的俯冲速率和大陆岩石圈朝向海沟的逆冲速率来共同实现, 因为两者均为模型内施加的速度边界条件, 并且在模型计算过程中保持恒定, 因此可以认为是相当于静止参照物的绝对运动速率。根据统计资料(Lallemand et al., 2005), 大于10 cm/a的大陆岩石圈向洋绝对逆冲速率在现今全球俯冲带处几乎是不存在的, 因而在模型实验设计中不予考虑, 从而限定其变化范围为0~10 cm/a。模型中设计的大洋板片绝对俯冲速率和大陆岩石圈绝对逆冲速率见表4和表5。另外, 模型中的初始俯冲角度由薄弱带角度形式来加以实现。

(a) 模型主要区域(1500 km×670 km)的初始物质与温度场。图中白色线条是等温线, 黄色字体和图示代表模型边界条件; (b) 初始俯冲带特征。模型中的颜色代表不同岩石组成, 如图例所示。图例中部分熔融岩石在初始模型中并未显示, 但在模拟运算过程中由于温度增加至岩石熔点时而逐渐出现。图2 初始模型和边界条件Fig.2 Initial model configuration and boundary conditions

表2 数值模拟采用的粘滞性流变参数Table 2 Parameters of viscous flow laws in the numerical experiments
关于模型的初始热边界条件, 设计模型顶部为固定温度(0 ℃), 大洋和大陆岩石圈底边界温度为1300 ℃ (Turcotte and Schubert, 2002), 软流圈地幔的温度梯度为 0.5 ℃/km, 两侧边界的水平方向温度梯度为零(即零热流)。底部边界采用的是外部边界固定温度条件, 即在模型底边界之下1000 km处假设一个固定的地幔温度(根据地幔固定温度梯度计算得出), 这样就可以使得在 670 km处的底部渗透边界上的温度和热流可以随模型计算而动态调整。
同时, 为了更真实反映俯冲碰撞的地表变化,在地壳表面和模型顶界面之间设计了一层相对高粘滞度的伪空气层, 其与上地壳的接触面被用来模拟模型计算过程中的地貌起伏变化, 且该地貌起伏面模拟包含近似的地表剥蚀和沉积作用(Gerya and Yuen, 2003a; Burg and Gerya, 2005)。伪空气层的初始厚度在大陆岩石圈之上为 10 km, 在大洋地壳之上为12 km。
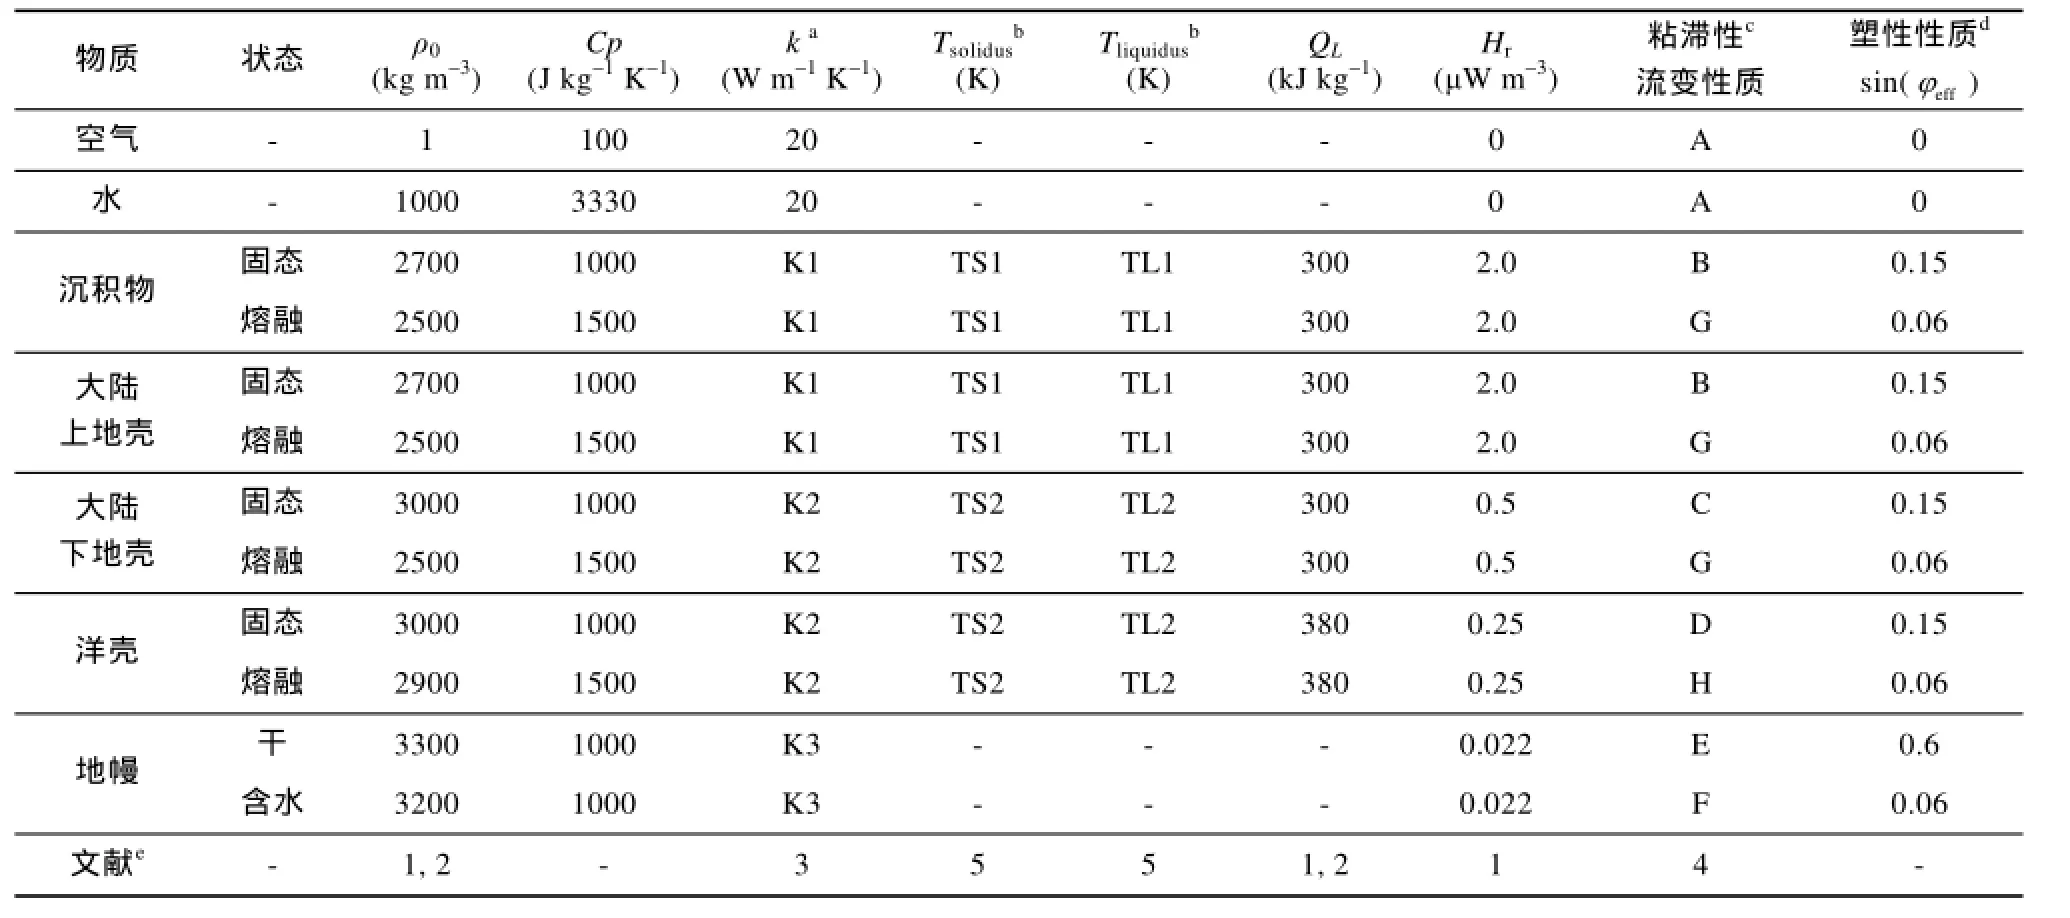
表3 数值模型中的主要材料参数Table 3 Parameters of the materials in the numerical models
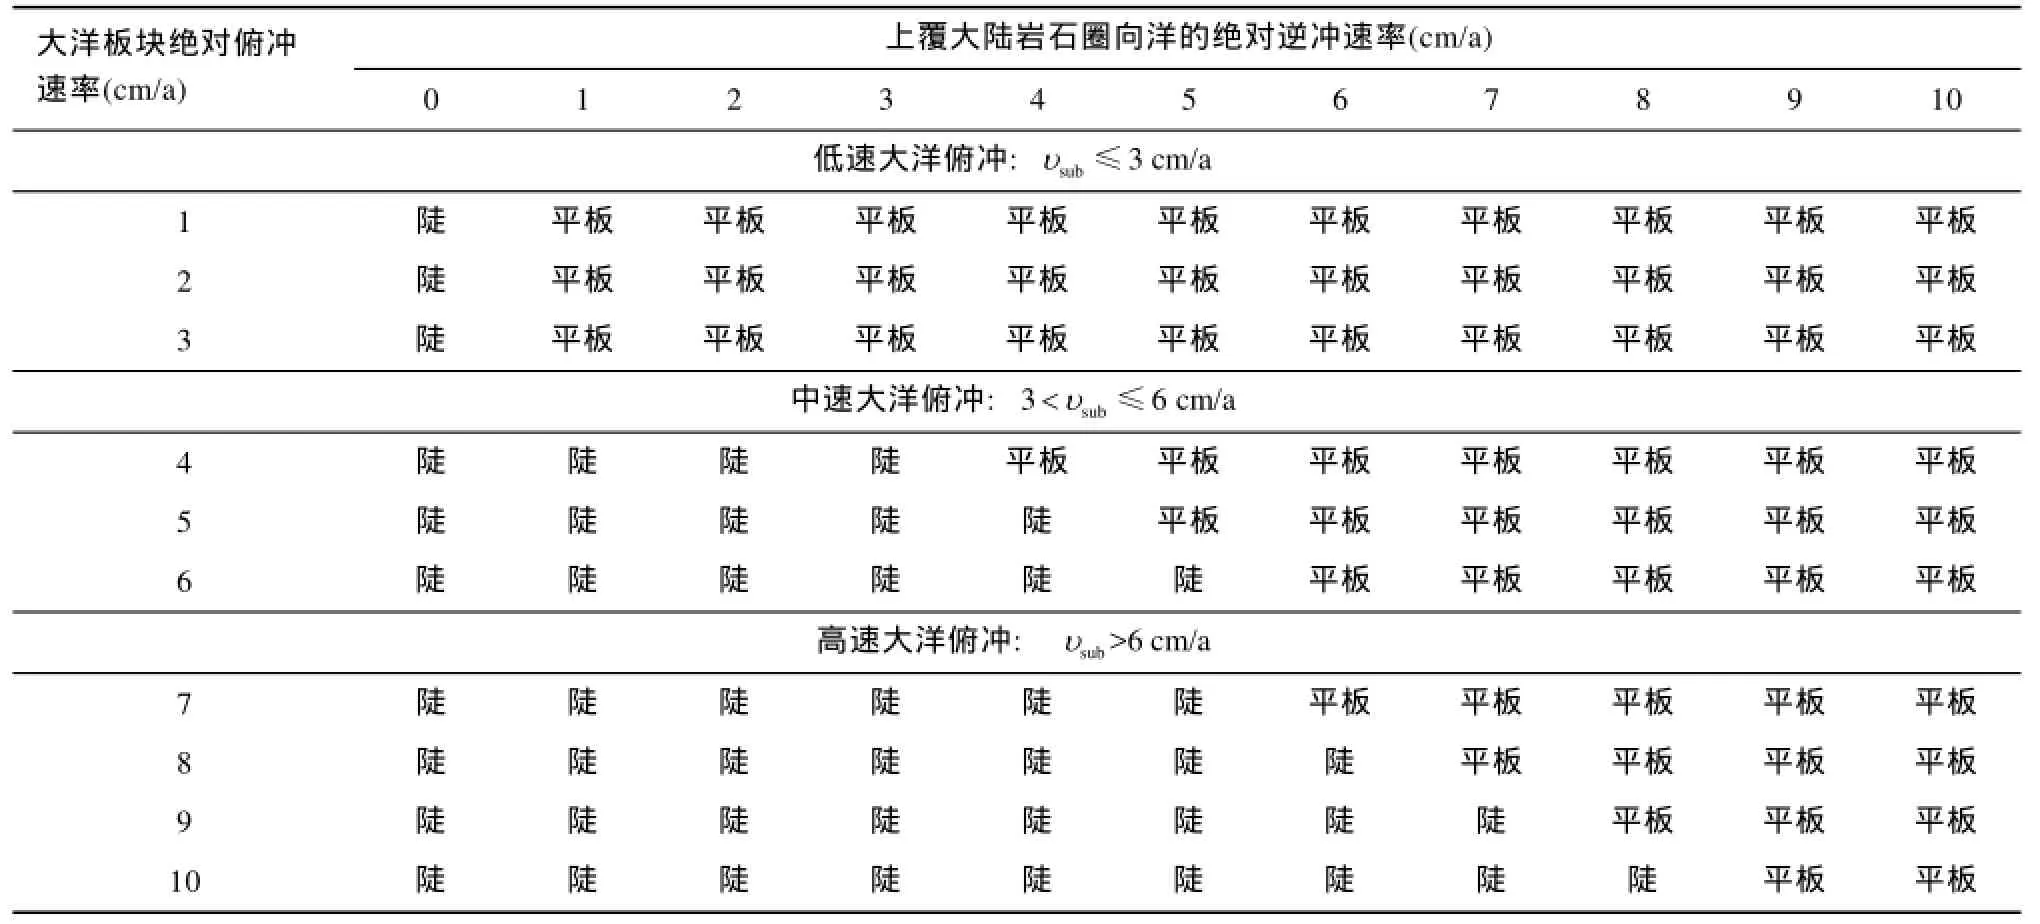
表4 初始俯冲角度为19°的模型实验结果Table 4 Numerical results at the initial subduction angle of 19°
3 模拟结果
首先根据初始俯冲角度的不同, 将模型实验分为低初始俯冲角度(19°)和高初始俯冲角度(36°)两组,模拟结果见表 4和表 5。依大洋岩石圈的绝对俯冲速率(subυ), 将归类为低速大洋俯冲,归类为中速大洋俯冲,归类为高速大洋俯冲。
3.1 低初始俯冲角度(19°)
现今全球洋–陆俯冲带的统计资料显示, 在深度<125 km的大洋岩石圈浅部, 其俯冲角度平均值为 27.5°±8.5°(Lallemand et al., 2005), 本组模型实验的初始俯冲角度设计为这一平均值的极小值 19°来代表低的初始俯冲角度情况, 以此探究其在低速、中速和高速洋–陆俯冲条件下的俯冲型式。

表5 初始俯冲角度为36°的模型实验结果Table 5 Numerical results at the initial subduction angle of 36°
模型结果显示(表 4), 低速大洋俯冲条件下, 只要上覆大陆岩石圈存在朝向海沟的绝对逆冲速率(≥1 cm/a), 就能导致平板俯冲的发生。反之, 若无绝对逆冲速率, 则为陡俯冲。图3和图4分别展示俯冲速率为2 cm/a, 绝对逆冲速率为0和1 cm/a两个模型的计算结果, 前者为陡俯冲, 后者为平板俯冲。
以绝对俯冲速率为2 cm/a和绝对逆冲速度为1 cm/a的模型为例, 论述低速大洋俯冲条件下平板俯冲的演化过程(如图 4所示)。洋-陆俯冲开始后,大洋岩石圈沿着初始俯冲界面进入软流圈, 由于较小初始俯冲角度导致的较大板间耦合力、较小的大洋俯冲速率不利于上下板块的解耦、以及上覆大陆岩石圈朝向海沟的逆冲速率更有利于俯冲板片的几何弯折的三种条件下, 大洋板片粘附在上覆大陆岩石圈地幔底部以近水平角度向前运动(图4a)。另外, 俯冲带处的挤压应力使上覆大陆岩石圈前缘发生弯折, 随后遭强烈剥蚀的大陆沉积物和地壳物质沉积于海沟处并进入俯冲隧道内, 形成“俯冲侵蚀”现象。模型运行到40.4 Ma时, 大洋俯冲平板的长度能达到600 km (图4b), 俯冲板片前端近乎垂直进入软流圈地幔。此时大洋沉积物随着俯冲板片近水平进入到俯冲板片与上覆岩石圈地幔之间的俯冲通道内, 并伴随的俯冲沉积物部分熔融。同时在俯冲通道内的沉积物和周围物质间的巨大密度差所产生的正浮力作用促使部分大洋沉积物沿俯冲通道折返至地表, 并伴随俯冲洋壳物质的减压熔融。随着俯冲作用的持续进行(图 4c), 在俯冲板片的拉力作用下发生回撤而导致板片上方地幔楔内速度场产生强烈扰动。
当绝对俯冲速率和绝对逆冲速度均为5 cm/a时,中速大洋俯冲条件下平板俯冲的演化过程如图6a所示。洋–陆俯冲开始后, 在较大的俯冲速率下, 大洋板片并不像低速大洋俯冲条件下所表现出的粘附于上覆大陆岩石圈地幔底部的水平向前运动, 而是以大约30°的俯冲角度斜向进入软流圈(图6a)。大洋和大陆岩石圈的相向汇聚导致俯冲带处的挤压应力促使上覆大陆岩石圈前缘向上弯折并遭受强烈剥蚀,此时部分大陆沉积物和地壳物质沉积于海沟处并进入俯冲隧道。随着大洋俯冲的持续进行(图6b), 上覆大陆岩石圈在大洋板片之上产生巨大压力, 促使板片在上覆岩石圈底部向上弯折而引起板片倾角陡然变小, 诱发平板俯冲发生。此时部分大洋沉积物从俯冲板片上剥离而堆积于海沟处形成增生楔, 且伴随着部分沉积物的俯冲折返。大洋俯冲19 Ma后(图6c), 500 km 长的大洋平板俯冲正式形成, 但在俯冲平板和上覆大陆岩石圈地幔之间仍残余有部分软流圈物质, 该软流圈物质将在随后大洋俯冲平板的持续向上运动直至垫付于上覆岩石圈底部而被逐渐挤出。之前形成的增生楔进入俯冲隧道而形成“俯冲侵蚀”现象, 并随着温度的上升而发生部分熔融。

图3 初始俯冲角度为19°, 板片绝对俯冲速率为2 cm/a, 上覆大陆岩石圈绝对逆冲速率为0时运行到44 Ma的模拟结果Fig.3 Numerical result at 44 Ma when assuming that the initial subduction angle is 19°, slab absolute subduction velocity is 2 cm/a and continental absolute trenchward velocity is 0 cm/a
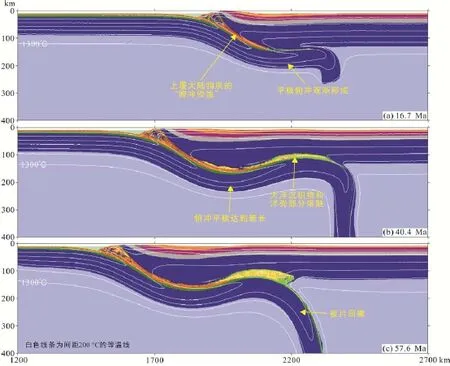
图4 初始俯冲角度为19°, 板片绝对俯冲速率为2 cm/a, 上覆大陆岩石圈绝对逆冲速率为1 cm/a的模型分别在16.7 Ma (a), 40.4 Ma (b)和57.6 Ma (c)时的演化结果(结果显示模型从开始阶段即为平板俯冲)Fig.4 Numerical results at 16.7 Ma (a), 40.4 Ma (b), and 57.6 Ma (c) when assuming that the initial subduction angle is 19°, slab absolute subduction velocity is 2 cm/a and continental absolute trenchward velocity is 1 cm/a
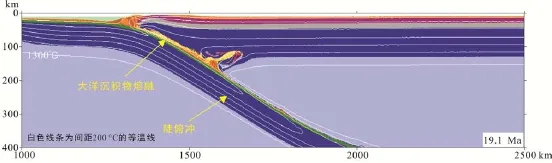
图5 初始俯冲角度为19°, 板片绝对俯冲速率为5 cm/a, 上覆大陆岩石圈绝对逆冲速率为4 cm/a的模型在运行到19.1 Ma的结果Fig.5 Numerical result at 19.1 Ma when assuming that initial subduction angle is 19°, slab absolute subduction velocity is 5 cm/a and continental absolute trenchward velocity is 4 cm/a
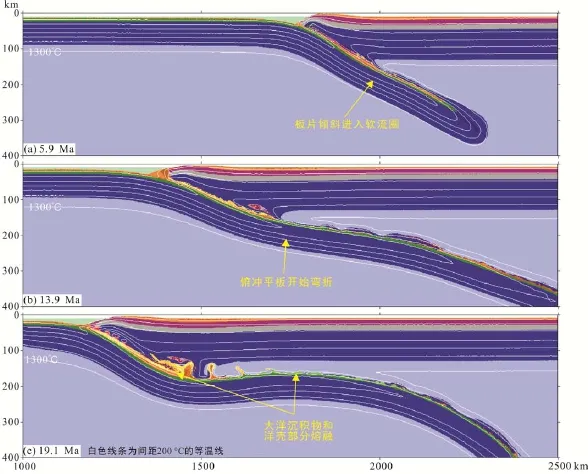
图6 初始俯冲角度为19°, 板片绝对俯冲速率为5 cm/a, 大陆岩石圈绝对逆冲速率为5 cm/a的模型分别在 5.9 Ma (a), 13.9 Ma (b)和19.1 Ma (c)时的演化结果, 模型逐渐从陡俯冲转换为平板俯冲Fig.6 Numerical results at 5.9 Ma (a), 13.9 Ma (b) and 19.1 Ma (c) when assuming that initial subduction angle is 19°, slab absolute subduction velocity is 5 cm/a and continental absolute trenchward velocity is 5 cm/a

图7 初始俯冲角度为19°, 板片绝对俯冲速率为9 cm/a, 上覆大陆岩石圈绝对逆冲速率为7 cm/a的模型在运行到11.4 Ma的结果Fig.7 Numerical result at 11.4 Ma when assuming that initial subduction angle is 19°, slab absolute subduction velocity is 9 cm/a and continental absolute trenchward velocity is 7 cm/a
我们以绝对俯冲速率为9 cm/a和绝对逆冲速度为8 cm/a的模型为例, 阐述平板俯冲的形成演化过程。随着大洋俯冲开始(图 8a), 在应力作用下, 上覆大陆岩石圈在俯冲带处向上弯折变形并遭受强烈剥蚀, 部分侵蚀的大陆物质沉积在海沟处并随着大洋岩石圈俯冲进入俯冲隧道, 并以约 30°倾角进入软流圈。随后大洋板片逐渐在大陆岩石圈底部深度处向斜下方弯折(图 8b)而形成平板俯冲型式, 随后大洋板片近水平垫付于上覆大陆岩石圈地幔底部(图8c)。
3.2 高初始俯冲角度(36°)
根据现今全球洋–陆俯冲带的统计资料, 36°为大洋岩石圈浅部俯冲角度平均值的极大值(Lallemand et al., 2005), 因而可代表初始俯冲角度较大的一类洋–陆俯冲。该组模型实验相对于前述模型仅增大初始俯冲角度, 其余参数均保持不变。计算结果显示(表5), 增大初始俯冲角度会极大地限制平板俯冲的形成。此时只有在绝对俯冲速率≤3 cm/a、且绝对逆冲速率达到10 cm/a时才能产生平板俯冲。
图9展示了绝对俯冲速率为3 cm/a且绝对逆冲速率依次为6 cm/a、8 cm/a和10 cm/a经过15 Ma时的模拟结果。模拟结果显示, 前两个模型中俯冲板片分别以40°和25°的角度倾斜进入软流圈(图9a、b), 且后者相对于前者具有更小的俯冲角度, 但由于上覆大陆岩石圈的绝对逆冲速率所产生的压力还不足以使俯冲板片发生弯折仍表现出陡俯冲型式。当大陆岩石圈绝对逆冲速率增大到 10 cm/a时, 在上覆大陆岩石圈的挤压应力作用下, 俯冲大洋板片于 120 km深度处发生几何弯折而导致平板俯冲产生(图 9c), 此时俯冲平板段的长度 300 km, 但其俯冲板片前锋仍以约20°角度倾斜俯冲。上述三个模型的模拟结果都显示在俯冲期间存在“俯冲侵蚀”现象导致上覆大陆岩石圈物质进入俯冲带内。同时随大洋岩石圈俯冲进入俯冲隧道的大洋沉积物由于热传导作用增温弱化而部分熔融。
4 讨 论
4.1 大洋岩石圈绝对俯冲速率对俯冲模式的影响
在大洋俯冲动力学研究中, 能否形成平板俯冲主要受板片正浮力作用、板间耦合力作用以及外部运动学条件等因素的影响和制约(Gutscher et al., 2000b; van Hunen et al., 2002b, 2004; Anderson et al., 2007; Perez-Gussinye et al., 2008; Rodriguez-Gonzalez and Negredo, 2012)。在其他动力学参数不变的情况下, 大洋板片绝对俯冲速率的大小在很大程度上决定了大洋板片能否克服初始板间耦合力作用。如果其绝对俯冲速率较小, 板间初始耦合力作用占据主导地位, 则大洋板片会持续粘附于上覆大陆岩石圈底部, 从而为平板俯冲产生创造有利条件。当大洋俯冲速率增大到足以克服板块间耦合力作用时, 则大洋板片会与上覆大陆岩石圈发生解耦而进入软流圈形成陡俯冲。因此, 大洋岩石圈绝对俯冲速率在一定程度上制约着洋–陆俯冲模式的转换和演化。
表 4的模拟结果表明, 在初始俯冲角度相对较低情况下(如19°), 上覆大陆岩石圈向洋绝对逆冲速率保持不变的条件下, 大洋岩石圈的绝对俯冲速率越大则越不利于平板俯冲的形成, 在当大洋岩石圈的绝对俯冲速率大于上覆大陆岩石圈向洋绝对逆冲速率时则只能导致陡俯冲型式。原因如下: (1)绝对俯冲速率越大越利于俯冲板片与上覆大陆岩石圈间的解耦, 因而越不利于平板俯冲产生; (2)相对较小的大洋俯冲速率能使俯冲板片滞留于软流圈地幔的时间较长而有利于俯冲板片增温弱化, 致使其在同样的上覆大陆岩石圈压力作用下更容易发生几何弯折而利于平板俯冲产生; (3)更重要的是, 上覆岩石圈向洋逆冲速率所引发的板片下方的向陆方向的局部地幔流的强度与平板俯冲形成关系密切, 如果该地幔流占据主导地位则有利于平板俯冲的产生, 反之则不利于。如图10所示, 在初始俯冲角度为19°、上覆大陆岩石圈逆冲速率恒定为5 cm/a时, 大洋板片俯冲速率为4 cm/a或5 cm/a时, 由上覆板块引发的板片下方的向陆地幔流占据主导而有利于平板俯冲的发育; 反之, 如果板片俯冲速率增大至 6 cm/a 或7 cm/a时, 则由板片俯冲引发的顺板片向下的地幔流占据主导地位而有利于陡俯冲的发生。
4.2 大陆岩石圈绝对逆冲速率对平板俯冲的制约
有利于大洋板片发生弯折的外部运动学条件是导致平板俯冲发生的重要因素之一, 而上覆大陆岩石圈的向洋绝对逆冲速率则是控制大洋俯冲动力学的重要外部运动学参数之一。因此, 上覆大陆绝对逆冲速率的大小对平板俯冲形成与否至关重要。
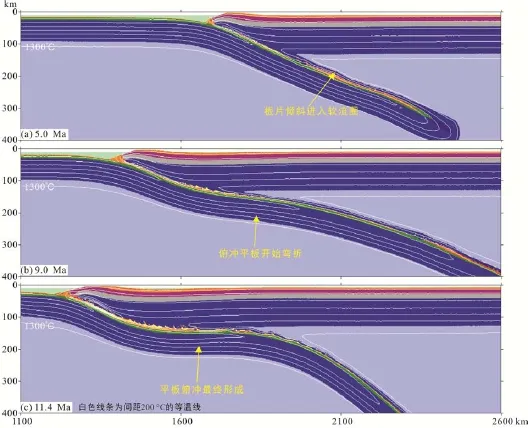
图8 初始俯冲角度为19°, 板片绝对俯冲速率为9 cm/a, 上覆大陆岩石圈绝对逆冲速率为8 cm/a的模型分别在5.0 Ma (a), 9.0 Ma (b)和11.4 Ma (c)时的演化结果(结果显示模型逐渐从陡俯冲转换为平板俯冲)Fig.8 Numerical results at 5.0 Ma (a), 9.0 Ma (b) and 11.4 Ma (c) when assuming that initial subduction angle is 19°, slab absolute subduction velocity is 9 cm/a and continental absolute trenchward velocity is 8 cm/a
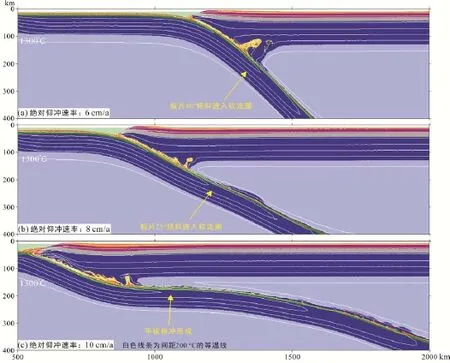
图9 初始俯冲角度为36°, 板片绝对俯冲速率为3 cm/a的模型在大陆岩石圈绝对逆冲速率分别为6 cm/a (a), 8 cm/a (b)和10 cm/a (c)运算到15 Ma时的结果(显示随上覆岩石圈绝对逆冲速率增加, 大洋俯冲逐渐从陡俯冲转变为平板俯冲)Fig.9 Numerical results for continental absolute trenchward velocity ranging from 6 cm/a (a) to 8 cm/a (b) and then to 10 cm/a (c), when assuming that initial subduction angle is 36° and slab absolute subduction velocity is 3 cm/a
表4的模拟结果显示, 在恒定大洋俯冲速率时,上覆大陆岩石圈的向洋绝对逆冲速率不小于、且与大洋板片俯冲速率差值越大则越有利于平板俯冲的形成。主要原因有: (1)上覆大陆岩石圈的绝对逆冲速率越大, 则直接作用于俯冲板片朝向斜下方的应力越大, 使之越有利于板片在上覆大陆岩石圈底部强制性弯折而导致俯冲板片倾角减小; (2)上覆岩石圈向洋逆冲速率会导致俯冲板片下方产生水平向的向陆的扰动地幔流。逆冲速率越大则局部地幔流扰动越强烈, 作用于板片的水平剪切分量越大而越有利于板片弯折和平板俯冲发生。图11所示, 在初始俯冲角度为36°、大洋板片绝对俯冲速率恒定为3 cm/a时,上覆岩石圈的向洋绝对逆冲速率为6 cm/a和8 cm/a时,俯冲板片的扰动地幔流指向深部而利于陡俯冲; 而当逆冲速率增至 10 cm/a时, 则由上覆板块向洋运动所引起的指向内陆一侧的地幔流占据主导而诱使平板俯冲发生。
在如上所述之平板俯冲能够发生的特定情况下,上覆大陆岩石圈的绝对逆冲速率大小一定程度上也影响着平板俯冲平板段的发育长度。在恒定大洋板片绝对俯冲速率条件下, 较大的大陆岩石圈绝对逆冲速率可有利于平板俯冲到更长距离。图12展示了初始俯冲角度为19°、低速大洋板片俯冲(绝对俯冲速率为3 cm/a)情况下, 大陆岩石圈绝对逆冲速率从1 cm/a增至6 cm/a时平板俯冲长度的模拟结果。该模拟结果显示上覆大陆岩石圈绝对逆冲速率大小与俯冲平板长度间具有正相关性。模型结果也表明, 由于大洋板片负浮力作用, 即使大陆岩石圈绝对逆冲速率不断增加, 但俯冲平板长度仅能保持在 1100 km以内。
通过进一步分析, 本文模型实验结果也表明上覆板块的绝对逆冲速率和俯冲板块的绝对俯冲速率之间的绝对速率比与俯冲模式之间也存在一定的联系。当初始俯冲角度较小时(~19°), 无论大洋岩石圈的俯冲速率为多少, 只要此绝对速率比不小于 1.0均能导致平板俯冲的发生; 对于低速大洋俯冲情况,绝对速率比甚至小于 1.0也能发生, 因此我们可以把 1.0作为绝对速率比能否导致平板俯冲发生的阈值的下限。但需要注意的是, 该结论仅适用于大洋板块初始俯冲角度较低的情况, 而对于初始俯冲角度较高的情况, 平板俯冲本身就极难发育, 因而也无此规律可循。
4.3 初始俯冲角度对洋–陆俯冲模式的影响
初始俯冲角度决定了上覆大陆岩石圈和俯冲板块之间的初始接触面积, 进而直接约束板间耦合力大小。而板间耦合力, 在微观上指的是两板块间可以积累和承受的物质颗粒间的粘结力, 宏观表现为两板块发生相对运动而不使板块分离的摩擦力。当板间耦合力相对较大时, 俯冲板片更容易粘附在上覆岩石圈底部向前水平运动一段距离后再倾斜进入软流圈地幔。如果被动大陆边缘是缓长型的, 那么初始俯冲时的俯冲角度可能较小; 反之, 如果被动大陆边缘是陡窄型的, 那么初始俯冲角度也就较大。
表4和5的模拟结果清晰展示了初始俯冲角度对俯冲型式的影响, 较大的初始俯冲角度会极大地抑制平板俯冲的发生。当初始俯冲角度较小时: 低速大洋俯冲时, 只要存在大陆岩石圈绝对逆冲速率即可以产生平板俯冲;而在中高速大洋俯冲时, 只有在大陆岩石圈绝对逆冲速率超过大洋板片绝对俯冲速率才可导致平板俯冲发生, 且平板俯冲长度最长不会超过1100 km。在初始俯冲角度较高时, 平板俯冲多难孕育, 如初始俯冲角度增至36°, 则平板俯冲仅在大陆岩石圈绝对逆冲速率增至10 cm/a才有可能发生。
4.4 现今平板俯冲模式的实例验证
现有资料显示, 平板俯冲区域只占现今全球俯冲带区域总长度的 10 %左右(如 Gutscher et al., 2000a; Gutscher et al., 2000b; van Hunen et al., 2002b; Skinner and Clayton., 2011)。表1总结了主要平板俯冲区域的重要地球动力学参数, 从中可以看出, 现今大部分平板俯冲区域的一个重要特征是: 与大洋板片绝对俯冲速率相比, 上覆大陆岩石圈一般都具有相对较大的绝对逆冲速率。
南美洲西海岸是现今全球平板俯冲最集中分布的区域(占全球平板俯冲区域总长度 50%以上), 也是平板俯冲研究最深入的地区。地震学证据(Gutscher, 2002; Hayes et al., 2012)显示, 纳兹板块向南美洲大陆俯冲时, 在智力中部、秘鲁以及厄瓜多尔等区域下方俯冲的大洋板片几乎水平底垫于上覆南美大陆岩石圈之下, 形成向陆内延伸几百公里的低角度近水平俯冲。同样, GPS观测数据(DeMets et al., 1994)显示, 南美大陆岩石圈在大西洋中脊向西的推力和纳兹板块偏东北向的俯冲与回撤作用下高速运动(~5 cm/a), 导致南美西海岸上覆大陆岩石圈向洋绝对逆冲速率普遍大于纳兹板块的绝对俯冲速率。例如, 在平板俯冲发育的智利中部、秘鲁和厄瓜多尔地区的大洋板片绝对俯冲速率分别为3.0 cm/a, 2.5 cm/a和1.6 cm/a, 而上覆大陆岩石圈向洋绝对逆冲速率分别达到4.5 cm/a, 4.5 cm/a和3.8 cm/a。北美洲西海岸的卡斯凯迪亚地区发育的平板俯冲则是由Farallon板块的残余板片俯冲(Juan de Fuca)所致, 其观测数据(DeMets et al., 1994; Gripp and Gordon, 2002)表明, Juan de Fuca板片以北北东方向斜向俯冲入北美大陆, 其垂直于俯冲带的绝对俯冲速率较小,而其上覆北美洲大陆岩石圈则以>2 cm/a的速度向西逆冲, 其上覆大陆岩石圈较大洋板片具有更高的绝对速率。如此特征与本文数值模拟结论一致。
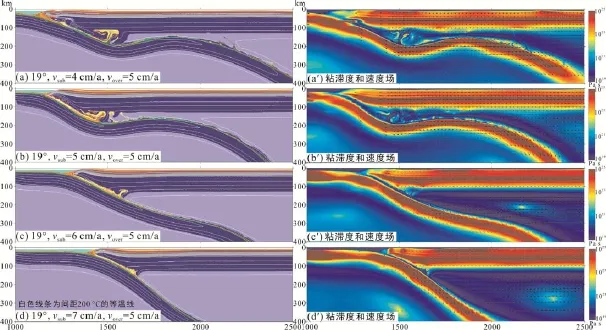
图10 初始俯冲角度为19°, 上覆大陆岩石圈绝对逆冲速率为5 cm/a时在板片绝对俯冲速率分别为4 cm/a (a), 5 cm/a (b), 6 cm/a (c)和7 cm/a (d)俯冲1000 km时的结果及相应的粘滞度场和速度场(结果显示随着大洋板片俯冲速率的增加, 大洋俯冲逐渐从平板俯冲转变为陡俯冲)Fig.10 Numerical results for slab absolute subduction velocity ranging from 4 cm/a (a), 5 cm/a (b), 6 cm/a (c), to7 cm/a (d), and the corresponding viscosity and calculated velocity fields (a′), (b′), (c′), (d′)respectively, when assuming that initial subduction angle is 19°, continental absolute trenchward velocity is 5 cm/a, the simulations stop when convergence reaches 1000 km

图11 初始俯冲角度为36°, 板片绝对俯冲速率为3 cm/a的模型在上覆大陆岩石圈绝对逆冲速率分别为6 cm/a (a), 8 cm/a (b) 和10 cm/a (c)的15 Ma时的粘滞度和速度场结果(结果显示上覆大陆岩石圈绝对逆冲速率的增加可促进大洋俯冲由陡俯冲转变为平板俯冲)Fig.11 Numerical results of viscosity and calculated velocity fields at the conditions of an initial subduction angle of 36°, slab absolute subduction velocity of 3 cm/a and continental absolute overthrusting velocity increasing from 6 cm/a (a) to 8 cm/a (b) and then to 10 cm/a (c), respectively, and the simulations stop at ~15 Ma
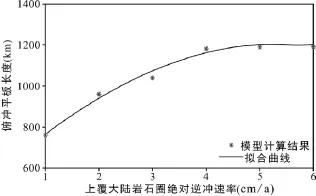
图 12 平板俯冲长度与上覆大陆岩石圈向洋绝对逆冲速率关系图(假设初始俯冲角度为 19°, 板片绝对俯冲速率 3 cm/a, 大陆岩石圈的绝对逆冲速率从 1 cm/a增至6 cm/a的模拟结果)Fig.12 Correlation between the absolute overthrusting velocity of continental lithosphere and the slab length of the flat subduction
同时, 如表 1所示, 现今平板俯冲几乎均发育于大洋板片较为年轻的太平洋东海岸汇聚边界, 所有平板俯冲区域的大洋板片年龄均小于 45 Ma, 且绝大多数小于 30 Ma, 这表明平板俯冲发生的重要条件是俯冲大洋岩石圈年龄远小于正常大洋岩石圈平均年龄 (60 Ma, Condie, 1997)。大洋俯冲板片正浮力增加(如年轻的大洋板片或增厚洋壳等)可能是导致平板俯冲发生的主要原因, 而上覆板块朝向海沟的绝对逆冲速率同样也制约着平板俯冲形成。
5 结 论
本文通过数值模拟研究再现了洋–陆汇聚速率对平板俯冲形成演化的影响效应, 获得了如下认识:
(1) 对年龄为 40 Ma的大洋板片, 当初始俯冲角度为洋–陆汇聚时平均俯冲角度的极小值(19°)时,在低速大洋俯冲(≤3 cm/a)条件下, 较小的绝对逆冲速率(≥1 cm/a)即可导致平板俯冲; 而在中高速大洋俯冲(>3 cm/a)条件下, 平板俯冲的发生要求大陆岩石圈绝对逆冲速率不小于大洋板片绝对俯冲速率。当初始俯冲角度增至洋-陆汇聚时平均俯冲角度的极大值(36°)时, 平板俯冲只有在大洋低速俯冲, 且大陆岩石圈绝对逆冲速率达到 10 cm/a以上时才可发生。初始俯冲角度的增加对平板俯冲的形成起到重要抑制作用。
(2) 较大的大洋板片绝对俯冲速率更易于克服板间的耦合作用力而不利于平板俯冲形成。相反,较大的大陆岩石圈绝对逆冲速率更易于促进俯冲板片弯折而孕育平板俯冲型式。
致谢: 衷心感谢审稿专家中国科学技术大学冷伟老师和中国科学院地质与地球物理研究所陈林老师对文章修改所提出的宝贵意见和建议!
Anderson M, Alvarado P, Zandt G and Beck S. 2007. Geometry and brittle deformation of the subducting Nazca Plate, Central Chile and Argentina. Geophysical Journal International, 171: 419–434.
Beate B, Monzier M, Spikings R, Cotten J, Silva J, Bourdon E and Eissen J P. 2001. Mio-Pliocene adakite generation related to flat subduction in southern Ecuador: The Quimsacocha volcanic center. Earth and Planetary Science Letters, 192: 561–570.
Bijwaard H. 1999. Seismic travel-time tomography for detailed global mantle structure. Utrecht University PhD thesis.
Bittner D and Schmeling H. 1995. Numerical modeling of melting processes and induced diapirism in the lower crust. Geophysical Journal International, 123: 59–70.
Bostock M G and Vandecar J C. 1995. Upper mantle structure of the northern Cascadia subduction zone. Canadian Journal of Earth Sciences, 32: 1–12.
Brace W F and Kohlstedt D L. 1980. Limits on lithospheric stress imposed by laboratory experiments. Journal of Geophysical Research: Solid Earth, 85: 6248–6252.
Brocher T M, Fuis G S, Fisher M A, Plafker G, Moses M J, Taber J J and Christensen N I. 1994. Mapping the Megathrust beneath the Northern Gulf of Alaska using wide-angle seismic data. Journal of Geophysical Research: Solid Earth, 99: 11663–11685.
Burg J P and Gerya T V. 2005. The role of viscous heating in Barrovian metamorphism of collisional orogens: Thermomechanical models and application to the Lepontine Dome in the Central Alps. Journal of Metamorphic Geology, 23: 75–95.
Clauser C and Huenges E. 1995. Thermal conductivity of rocks and minerals. AGU Reference Shelf, 3: 105-126.
Condie K C. 1997. Plate Tectonics (Forth edition). Butterworth-Heinemann.
Dávila F M and Lithgow-Bertelloni C. 2015. Dynamic uplift during slab flattening. Earth and Planetary Science Letters, 425: 34–43.
Defant M J and Drummond M S. 1993. Mount St. Helens: Potential example of the partial melting of the subducted lithosphere in a volcanic arc. Geology, 21: 547–550.
DeMets C, Gordon R G, Argus D F and Stein S. 1994. Effect of recent revisions to the geomagnetic reversal time scale on estimates of current plate motions. Geophysical Research Letters, 21: 2191–2194.
Espurt N, Funiciello F, Martinod J, Guillaume B, Regard V, Faccenna C and Brusset S. 2008. Flat subduction dynamics and deformation of the South American plate: Insights from analog modeling. Tectonics, 27.
Fuis G S, Moore T E, Plafker G, Brocher T M, Fisher M A, Mooney W D, Nokleberg WJ, Page R A, Beaudoin B C, Christensen N I, Levander A R, Lutter W J, Saltus R W and Ruppert N A. 2008. Trans-Alaska Crustal Transect and continental evolution involving subduction underplating and synchronous foreland thrusting. Geology, 36: 267–270.
Fukao Y, Widiyantoro S and Obayashi M. 2001. Stagnant slabs in the upper and lower mantle transition region. Reviews of Geophysics, 39: 291–323.
Gardner T W, Fisher D M, Morell K D and Cupper M L. 2013. Upper-plate deformation in response to flat slab subduction inboard of the aseismic Cocos Ridge, Osa Peninsula, Costa Rica. Lithosphere, 5: 247–264.
Gerya T V and Yuen D A. 2003a. Characteristics-based marker-in-cell method with conservative finite-differences schemes for modeling geological flows with strongly variable transport properties. Physics of the Earth and Planetary Interiors, 140: 293–318.
Gerya T V and Yuen D A. 2003b. Rayleigh-Taylor instabilities from hydration and melting propel ‘cold plumes’ at subduction zones. Earth and Planetary Science Letters, 212: 47–62.
Gorbatov A, Widiyantoro S, Fukao Y and Gordeev E. 2000. Signature of remnant slabs in the North Pacific from P-wave tomography. Geophysical Journal International, 142: 27–36.
Grafe K, Frisch W, Villa I M and Meschede M. 2002. Geodynamic evolution of southern Costa Rica related to low-angle subduction of the Cocos Ridge: Constraints from thermochronology. Tectonophysics, 348: 187–204.
Gripp A E and Gordon R G. 2002. Young tracks of hotspots and current plate velocities. Geophysical Journal International, 150: 321–361.
Gutscher M A and Lallemand S. 1999. Birth of a major strike-slip fault in SW Japan. Terra Nova, 11: 203–209.
Gutscher M A. 2002. Andean subduction styles and their effect on thermal structure and interplate coupling. Journal of South American Earth Sciences, 15: 3–10.
Gutscher M A, Maury R, Eissen J P and Bourdon E. 2000a. Can slab melting be caused by flat subduction? Geology, 28: 535–538.
Gutscher M A, Spakman W, Bijwaard H and Engdahl E R. 2000b. Geodynamics of flat subduction: Seismicity and tomographic constraints from the Andean margin. Tectonics, 19: 814–833.
Hayes G P, Wald D J and Johnson R L. 2012. Slab1.0: A three-dimensional model of global subduction zone geometries. Journal of Geophysical Research: Solid Earth, 117.
Jarrard R D. 1986. Relations among subduction parameters. Reviews of Geophysics, 24: 217–284.
Ji S C and Zhao P L. 1993. Flow laws of multiphase rocks calculated from experimental-data on the constituent phases. Earth and Planetary Science Letters, 117: 181–187.
Kay S M and Abbruzzi J M. 1996. Magmatic evidence for Neogene lithospheric evolution of the central Andean “flat-slab” between 30 degrees S and 32 degrees S. Tectonophysics, 259: 15–28.
Kay S M and Mpodozis C. 2001. Central Andean ore deposits linked to evolving shallow subduction systems and thickening crust. GSA today, 11: 4–9.
Kirby S H. 1983. Rheology of the Lithosphere. Reviews of Geophysics, 21: 1458–1487.
Kirby S H and Kronenberg A K. 1987. Rheology of the lithosphere-selected topics. Reviews of Geophysics, 25: 1219–1244.
Lallemand S, Heuret A and Boutelier D. 2005. On the relationships between slab dip, back-arc stress, upper plate absolute motion, and crustal nature in subduction zones. Geochemistry Geophysics Geosystems, 6(9): Q09006, doi: 10.1029/2005GC000917.
Li Z H, Gerya T V and Burg J P. 2010. Influence of tectonic overpressure on P-T paths of HP-UHP rocks incontinental collision zones: Thermomechanical modelling. Journal of Metamorphic Geology, 28: 227–247.
Li Z H, Xu Z Q and Gerya T V. 2011. Flat versus steep subduction: Contrasting modes for the formation and exhumation of high- to ultrahigh-pressure rocks in continental collision zones. Earth and Planetary Science Letters, 301: 65–77.
Li Z H. 2014. A review on the numerical geodynamic modeling of continental subduction, collision and exhumation. Science China: Earth Sciences, 57, 47–69.
Manea V C, Pérez-Gussinyé M and Manea M. 2012. Chilean flat slab subduction controlled by overriding plate thickness and trench rollback. Geology, 40: 35–38.
Morris P A. 1995. Slab melting as an explanation of Quaternary volcanism and aseismicity in Southwest Japan. Geology, 23: 395–398.
Perez-Gussinye M, Lowry A R, Morgan J P and Tassara A. 2008. Effective elastic thickness variations along the Andean margin and their relationship to subduction geometry. Geochemistry Geophysics Geosystems, 9(2): Q02003, doi: 1020/2007GC001786.
Petford N and Atherton M. 1996. Na-rich partial melts from newly underplated basaltic crust: The Cordillera Blanca Batholith, Peru. Journal of Petrology, 37: 1491–1521.
Pilger R H. 1981. Plate reconstructions, aseismic ridges, and low-angle subduction beneath the Andes. Geological Society of America Bulletin, 92: 448–456.
Preece S J. 1991. Tephrostratigraphy of the Late Cenozoic Gold Hill Loess, Fairbanks Area, Alaska. University of Toronto PhD thesis.
Ranalli G. 1995. Rheology of the Earth. Springer.
Ranalli G and Murphy D C. 1987. Rheological stratification of the lithosphere. Tectonophysics, 132: 281–295.
Rodriguez-Gonzalez J and Negredo A M. 2012. The role of the overriding plate thermal state on slab dip variability and on the occurrence of flat subduction. Geochemistry Geophysics Geosystems, 13(1): Q01002, doi: 10.1029/ 2011GC003859.
Sak P B, Fisher D M, Gardner T W, Marshall J S and LaFemina P C. 2009. Rough crust subduction, forearc kinematics, and Quaternary uplift rates, Costa Rican segment of the Middle American Trench. Geological Society of America Bulletin, 121: 992–1012.
Schmidt M W and Poli S. 1998. Experimentally based water budgets for dehydrating slabs and consequences for arc magma generation. Earth and Planetary Science Letters, 163: 361–379.
Sigloch K, McQuarrie N and Nolet G. 2008. Two-stage subduction history under North America inferred from multiple-frequency tomography. Nature Geoscience, 1: 458–462.
Skinner S M. 2013. Plate Tectonic Constraints on Flat Subduction and Paleomagnetic Constraints on Rifting. California Institute of Technology PhD thesis.
Skinner S M and Clayton R W. 2011. An evaluation of proposed mechanisms of slab flattening in Central Mexico. Pure and Applied geophysics, 168: 1461–1474.
Stevenson D J and Turner J S. 1977. Angle of subduction. Nature, 270: 334–336.
Suárez G, Monfret T, Wittlinger G and David C. 1990. Geometry of subduction and depth of the seismogenic zone in the Guerrero Gap, Mexico. Nature, 345: 336–338.
Tovish A, Schubert G and Luyendyk B P. 1978. Mantle flow pressure and the angle of subduction: Non-Newtonian corner flows. Journal of Geophysical Research, 83: 5892–5898.
Turcotte D L and Schubert G. 2002. Geodynamics. Cambridge University Press.
Ueda K, Gerya T and Sobolev S V. 2008. Subduction initiation by thermal-chemical plumes: Numerical studies. Physics of the Earth and Planetary Interiors, 171: 296–312.
Uyeda S and Kanamori H. 1979. Back-arc opening and the mode of subduction. Journal of Geophysical Research, 84: 1049–1061.
van Hunen J, van den Berg A P and Vlaar N J. 2001. Latent heat effects of the major mantle phase transitions on low-angle subduction. Earth and Planetary Science Letters, 190: 125–135.
van Hunen J, van den Berg A P and Vlaar N J. 2002a. The impact of the South-American plate motion and the Nazca Ridge subduction on the flat subduction below South Peru. Geophysical Research Letters, 29: 35– 1–35–4.
van Hunen J, van den Berg A P and Vlaar N J. 2002b. On the role of subducting oceanic plateaus in the development of shallow flat subduction. Tectonophysics, 352: 317–333.
van Hunen J, van den Berg A P and Vlaar N J. 2004. Various mechanisms to induce present-day shallow flat subduction and implications for the younger Earth: A numerical parameter study. Physics of the Earth and Planetary Interiors, 146: 179–194.
Numerical Modeling of Flat Subduction: Constraints from the Ocean-continent Convergence Velocity
HUANGFU Pengpeng1, 2, 3, WANG Yuejun3, 4*, FAN Weiming4, LI Zhonghai2, WANG Yuming5and ZHOU Yongzhi3
(1. State Key Laboratory of Isotope Geochemistry, Guangzhou Institute of Geochemistry, Chinese Academy of Sciences, Guangzhou 510640, Guangdong, China; 2. Key Laboratory of Computational Geodynamics, College of Earth Sciences, University of Chinese Academy of Sciences, Beijing 100049, China; 3. School of Earth Science and Geological Engineering, Sun Yat-Sen University, Guangzhou 510275, Guangdong, China; 4. CAS Center for Excellence in Tibetan Plateau Earth Sciences, Institute of Tibetan Plateau Research, Chinese Academy of Sciences, Beijing 100101, China; 5. Zhixin High School, Guangzhou 510080, Guangdong, China)
2-D numerical modeling is used to investigate the effects of ocean-continent convergence velocity on the flat subduction dynamics. It aims to better understand how the absolute subduction velocity of the oceanic lithosphere and absolute overthrusting velocity of the overriding continental lithosphere influence the subduction mode, in particular how the absolute overthrusting velocity regulates the development of flat subduction. Numerical models are divided into two groups with the initial subduction angle of 19° and 36°, respectively. Numerical models with 40 Ma-aged oceanic lithosphere and initial subduction angle of 19° show that (1) under the condition of low oceanic subduction velocity (≤3 cm/a), the flat subduction can be easily formed when the overthrusting velocity is no less than 1 cm/a; (2) under the condition of moderate to high oceanic subduction velocity (>3 cm/a), the flat subduction can occur only when the absolute overriding velocity is no less than the absolute subduction velocity. However, for models with initial subduction angle of 36°, the flat subduction occurs only when the absolute subduction velocity is no larger than 3 cm/a and the absolute overthrusting velocity reaches 10 cm/a. Large absolute subduction velocity can promote decoupling between the downgoing and overriding plates and thus favors the development of steep subduction. In contrast, larger absolute overthrusting velocity facilitates the slab bending and thereby contributes to the development of flat subduction. Additionally, flat subduction at a high velocity of the overriding plate is significantly correlated with the landward mantle flow beneath the slab, which can facilitate the upward bending of the slab. Our results are evidenced by the kinematic models of the flat subduction beneath the South America.
flat subduction; numerical simulation; absolute subduction velocity; absolute overthrusting velocity; initial subduction angle
P542; TE352
A
1001-1552(2016)03-0429-017
2015-11-16; 改回日期: 2016-02-05
项目资助: 973项目(2014CB440901和 2015CB856106)、国家自然科学基金项目(41190073, 41402165和 41304071)和中山大学中央高校基本科研业务费专项资金联合资助。
皇甫鹏鹏(1985–), 男, 博士研究生, 从事数值模拟研究。Email: huangfu@gig.ac.cn
王岳军(1969–), 男, 教授, 从事大地构造研究。Email: wangyuejun@mail.sysu.edu.cn
猜你喜欢
阅读(低年级)(2022年3期)2022-03-30 06:07:44
产业与科技论坛(2022年4期)2022-02-11 13:02:14
小学科学(学生版)(2021年6期)2021-07-21 09:18:38
化工机械(2021年1期)2021-04-19 02:56:34
科技视界(2020年17期)2020-07-30 14:03:27
课堂内外(小学版)(2018年7期)2018-08-14 00:52:28
小学科学(2018年2期)2018-03-21 10:04:10
小学科学(2018年1期)2018-01-30 18:01:28
地震研究(2017年3期)2017-11-06 21:54:14
地震研究(2017年3期)2017-11-06 01:58:51
