西北旱区农田土壤N2O排放空间变化特征及影响因素探讨
张 凡,王 政,李旭祥
(1.西安交通大学 人居环境与建筑工程学院 环境科学与技术系,西安 710049;2. 中国科学院地球环境研究所 黄土与第四纪地质国家重点实验室,西安 710061)
西北旱区农田土壤N2O排放空间变化特征及影响因素探讨
张 凡1,王 政2,李旭祥1
(1.西安交通大学 人居环境与建筑工程学院 环境科学与技术系,西安 710049;2. 中国科学院地球环境研究所 黄土与第四纪地质国家重点实验室,西安 710061)
旱地农田土壤被认为是重要的N2O排放源,但排放通量及影响因素仍存在不确定性。对西北干旱半干旱地区农田土壤N2O的排放分析表明,全区N2O排放通量相对较低,20世纪80 — 90年代呈波动式增长。N2O排放的空间格局总体呈现从东南向西南逐渐减少的趋势。陕西地区排放量为75.58 t · a-1,贡献了全区50%的N2O排放。过量的氮肥施用、较高的降水量以及明显的增温效应是陕西南部N2O排放增强的主要原因。
农田土壤;N2O;干旱半干旱地区
氧化亚氮(N2O)是一种重要的温室气体。虽然N2O含量低于CO2,但由于存留时间长(Crutzen,1970;Prather,1998),增温潜能高(辐射强迫0.48 W·m-2)等特点(IPCC,2007),被认为是主要的温室气体。观测数据表明:大气N2O含量的增加主要是源于农业活动(IPCC,2007)。在中国,农业源N2O排放占排放总量的92.43%,其中79.83%为农田排放(国家发展与改革委员会,2004)。因此,对各类农业系统中N2O排放通量的分布及影响因素研究就成为了核心问题之一(Smith,1997)。
旱作农业是中国主要的农业系统之一(信乃诠,2002),据估算旱地农田N2O排放约占到全国农业排放总量的78%(邢光熹和颜晓元,2000)。中国西北地区作为传统的旱作农业区(席承藩,1984)也就成为广受关注的区域。目前对N2O排放的区域估算和田间影响因素已有大量研究,表明土壤理化性质、氮素养分、温湿度变化等都会影响土壤N2O排放通量(徐文彬和洪业汤,2000;Zheng et al,2004;王立刚等,2008)。然而针对旱作农业,在中国区域尺度这些因素综合作用如何,会如何影响区域N2O的排放变化还没有过多探讨。
DNDC(Denitrifi cation-Decompostion Model)模型主要模拟农田(DNDC)(Li et al,1994;Zhang et al,2015)、森林(PnET-DNDC)(Li et al,2000;Stange et al,2000) 和湿地(Wetland-DNDC)(Zhang et al,2002)生态系统土壤碳、氮循环。模型根据气象、土壤、植被、土地利用和管理等模拟植物-土壤系统中各种环境因子的动态变化,进而计算微生物参与的硝化、反硝化以及发酵等过程的反应速率,从而追踪土壤物质的积累和转化。该模型已在世界范围得到广泛的验证和应用(Cai et al,2003;Babu et al,2006;Beheydt et al,2007),在土壤生态系统的氮循环过程模拟上具有较强的可靠性(Frolking et al,1998;Brown et al,2002;Grant et al,2004)。
本文通过DNDC模型估算了我国西北地区旱作农田土壤N2O排放的时空变化特征,结合气象资料讨论了气候和管理措施变化背景下N2O排放的变化趋势和可能影响因素,旨在为未来区域尺度农田土壤N2O的排放变化预测提供支持。
1 研究资料与方法
1.1 研究区域
本研究区域位于东经73°41'— 111°14',北纬31°43'— 49°10',包括陕西、甘肃、宁夏、青海、新疆五省区的全部。区内地貌复杂,植被类型多样,地域差异明显。气候资源随海拔、纬度分配严重不均,总体热量不足、降水少、干旱问题突出。研究区内农业植被主要以一年制旱地作物和蔬菜为主,仅陕南及内陆少部分灌区有水稻种植(张小燕和杨改河,2005)。
1.2 研究资料
模拟所需气象资料包括1981 — 2000年日最高、最低温度和降水。降水采用MERRA数据(Rienecker et al,2011)。土壤理化性质数据来源于全国土壤普查资料(全国土壤普查办公室,1993 — 1997)和中国土壤图集(1:14000000)(中国科学院南京土壤研究所,1986)。植被管理数据来源于农业普查和各种文献资料(崔读昌等,1984;刘巽浩和陈阜,2005)(http://data.cma.gov. cn)。基于西北地区典型耕作方式对西北地区农田土壤进行了20年模拟。模型参数中秸秆量估算据李长生等(2003),数据库中基肥施用量及灌溉参数来源自国家农业共享数据中心(http://www. agridata.cn)。
1.3 模型框架
DNDC 模型含土壤气候、植物生长和有机质分解以及硝化、脱氮和发酵等模块。在区域模拟中,首先利用西北地区的气象、土壤、植被、土地利用和农田耕作管理等数据建立基础数据库,其后调用数据库模拟植物-土壤系统中诸环境因子的动态变化,实现追踪农田土壤碳氮循环。数据库建立以及参数设置详见Zhang et al(2006)。
2 结果与讨论
2.1 西北地区农田N2O排放的空间分布
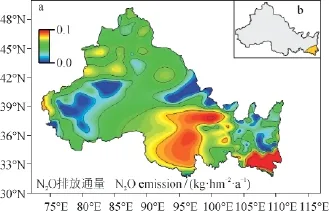
西北地区气候资源分布地域性差异显著,热量资源以陕西南部、关中和新疆中部地区最高,日均温高于10°C,青海、新疆南部部分地区热量资源不足,年均温度较低。降水资源基本从东南部的陕西、甘肃向西北部的新疆地区过渡性减少(图1)。全区农田N2O排放分布格局总体呈现从东南部向西南部随降水和温度降低而逐渐减少的趋势(图2)。宁夏地区排放最低,年排放量7 t · a-1,仅占全区总排放的5%。青海和新疆地域面积广阔,但水热资源不协调,耕地仅占全区耕地总面积的26.64%,N2O排放基本低于20 t · a-1。陕西地区最高,排放量为75.58 t · a-1,耕地面积占全区的31%,但贡献了50% 的N2O排放,并且表现出显著的南北差异。陕西南部地区水热资源丰富,西北地区的水田作物及二熟、三熟作物主要种植在该地区,并有大面积的蔬菜种植,N2O排放系数较高。

图1 西北地区年均温度及年均降水分布Fig.1 Distribution of average annual temperature and precipitation in Northwest China
2.2 西北地区农田N2O排放的时间序列变化
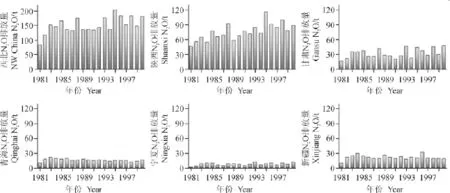
20世纪80 — 90年代整个西北地区N2O排放总量呈波动式增长,20世纪80年代年平均排放总量为137.5 t · a-1,90年代为163.7 t · a-1,增幅19%(图3),20年平均N2O排放通量为0.016 kgN·hm-2·a-1。陕西地区年际变化明显,20年间平均排放通量为0.078 kgN·hm-2·a-1,20世纪80年代排放通量为0.069 kgN·hm-2·a-1,20世纪90年代增加了24%,达到0.086 kgN·hm-2·a-1。甘肃地区20年间有微弱的N2O排放增加,而宁夏、青海、新疆没有显著变化。
2.3 西北地区农田N2O排放的影响因素
旱作农业区氮肥的施用会对N2O排放具有明显促进作用,因此各省施肥量差异对西北地区N2O排放的空间分布有决定性作用。全区排放量结果显示(图2)陕西年均排放通量较高,西北地区最高值集中出现在陕西南部和关中地区。1980年至2000年间,陕西地区是西北区氮肥用量最高的省份,总量达到77.8万吨,远高于其他省份(刘全清等,2005)。其中,关中地区施肥量严重过量,小麦田过量施用氮肥达55 kg · hm-2,玉米田间过量施肥56 kg · hm-2(同延安等,2004)。笔者认为过量的氮肥施用是该地区N2O排放明显较高的主要原因。由于我国农业肥料的平均利用率还较低(国家发展与改革委员会,2013),大量的氮肥施用还会进一步加剧土壤面源污染问题(张维理,2004)。因此该地区合理的化肥施用比例也是农业生态管理的重要问题。
各类田间试验的结果还显示,温度、降水的变化会影响N2O排放(Magg and Vinther,1996;Smith et al,1998)。因此除施肥等管理条件的影响外,区域N2O排放量变化还与气候变化相关。对降水而言,绝大多数西北地区属于干旱、半干旱气候,降水很少且季节性明显(丁一汇等,2013)。由于在土壤低湿度情况下,N2O排放与降水量存在正相关性(郑循华等,1996;徐文彬等,2002;Zheng et al,2004;张小燕和杨改河,2005)。在西北地区降水相对较高的陕西南部,这一因素可能加强了由于过量氮肥施用而导致的N2O排放。降水和氮肥的综合效应使得该地区成为西北地区N2O排放高值集中出现的区域。

图2 西北地区农田土壤N2O排放通量分布a. 全区排放通量分布;b. N2O排放和年际温度变化呈显著正相关区域Fig.2 N2O emission fl ux in cropland soil in Northwest China a. N2O emission fl ux; b. The area of signifi cant correlation between temperature and annual N2O emissions

图3 西北地区1981—2000年农田土壤N2O排放Fig.3 N2O emission in cropland soil in Northwest China from 1981 to 2000
但降水对N2O年际变化的影响并不明显。从372个研究点的逐县相关分析结果看,仅甘肃中南部以及青海个别县的N2O排放量与年降水表现出显著的正相关(p< 0.05)。比如20世纪90年代在青海东南部地区、甘肃中南部降水略有减少(刘德祥等,2005;时兴合等,2007),这一时段N2O排放都有所降低。20世纪80年代青海地区N2O排放量为0.029 kgN·hm-2·a-1,20世纪90年代下降为0.025 kgN·hm-2·a-1。但在西北地区绝大多数区域,降水的年际变化与N2O排放并没有表现出确定的相关关系。在20世纪80—90年代西北降水整体表现为平稳的年际波动,时间上的变化幅度远小于各区域的空间差异,这可能是年际降水对N2O排放影响不明显的主要原因。
对温度而言,适度的升温可以加强微生物活动,从而促进土壤硝化反硝化作用,因此温度一直被认为是农田N2O排放的主要控制因子(陈卫卫等,2007;王立刚等,2008)。从N2O排放量与年均温度的相关分析看,表现出显著正相关(p< 0.05)的区域集中在整体高排放量的陕西南部地区(图2b)。由于20世纪80 —90年代西北地区气温在20年间呈整体上升趋势(于淑秋等,2003),其中陕西南部整体温度较高且升温最快。因此这一区域土壤温度对N2O排放具有很强的促进效应。但同时也应该注意到,温度升高会加剧土壤水分的散失,当土壤湿度过低时又会抑制N2O排放。因此在其他低降水的区域,N2O的排放并没表现出与温度的显著相关。低降水区域的温度对N2O排放的促进可能被升温导致的干旱所抵消。因此气候因子对N2O排放变化的影响根据不同的水热组合而具有区域差异。
3 结论
对西北干旱半干旱地区农田土壤N2O排放估算分析表明,西北地区农田N2O排放相对较低。农田土壤N2O平均排放通量为0.016 kgN·hm-2·a-1,N2O排放分布格局总体呈现从东南部向西南部逐渐减少的趋势。在西北地区,陕西南部N2O排放量最高,过量的氮肥施用为主要原因。同时陕西南部较高的降水量以及明显的增温效应也会进一步增强N2O排放。因此加强对农业氮肥和水资源的控制及合理有效利用,降低N2O的排放潜力,应成为未来西北旱作农业的重点管理环节。
陈卫卫, 张友民, 王毅勇, 等. 2007. 三江平原稻田N2O通量特征[J].农业环境科学学报, 26(1): 364 – 368. [Chen W W, Zhang Y M, Wang Y Y, et al. 2007. Characteristics of N2O fluxes in paddy fields of the Sanjiang Plain [J].Journal of Agro-Environment Science, 26(1): 364 – 368.]
崔读昌, 刘洪顺, 闵谨如. 1984. 中国主要农作物气候资源图集[M]. 北京: 气象出版社. [Cui D C, Liu H S, Min J R. 1984. Atlas of major agricultural climate resources of China [M]. Beijing: Meteorological Press.]
丁一汇, 王绍武, 郑景云, 等. 2013. 中国气候[M]. 北京: 科学出版社. [Ding Y H, Wang S W, Zheng J Y, et al. 2013. Climate in China [M]. Beijing: Science Press.]
国家发展与改革委员会. 2004. 中华人民共和国气候变化初始国家信息通报[M]. 北京: 中国计划出版社. [National Development and Reform Commission. 2004. The Peoples's Republic of China initial national communication on climate change [M]. Beijing: China Planning Press.]
国家发展与改革委员会. 2013. 全国高标准农田建设总体规划[A]. [National Development and Reform Commission. 2013. The master plan of national high standard farmland construction [A].]
李长生, 肖向明, Frolking S, 等. 2003. 中国农田的温室气体排放[J].第四纪研究, 23(5): 493 – 503. [Li C S, Xiao X M, Frolking S. et al. 2003. Greenhouse gas emissions from croplands of China [J].Quaternary Sciences, 23(2): 493 – 503.]
刘德祥, 董安祥, 邓振镛. 2005. 中国西北地区近43年降水资源变化对农业的影响[J].干旱地区农业研究, 23(4): 179 – 185. [Liu D X, Dong A X, Deng Z Y. 2005. Impact of precipitation vacillation on agriculture for the past 43 years in Northwest China [J].Agricultural Research in the Arid Areas, 23(4): 179 – 185.]
刘全清, 张卫锋, 杜 森,等. 2005. 中国西北地区肥料使用和生产现状及问题[J].磷肥与复肥, 20(5): 69 – 73. [Liu Q Q, Zhang W F, Du S, et al. 2005. The status and problems of fertilizer production and application in northwest area of China and some suggestions [J].Phosphate & Compound Fertilizer, 20(5): 69 – 73.]
刘巽浩, 陈 阜. 2005. 中国农作制[M]. 北京: 中国农业出版社. [Liu X H, Chen F. 2005. Farming systems in China [M]. Beijing: China Agriculture Press.]
全国土壤普查办公室. 1994. 中国土种志[M]. 北京: 中国农业出版社. [China NSSO. 1994. Soils in China [M]. Beijing: Agricultural Publishing House.]
时兴合,汪青春, 赵燕宁, 等. 2007. 青海东部气候变化及其对农牧业生产的影响[J].青海农林科技, (4): 51 – 57. [Shi X H, Wang Q C, Zhao Y N, et al. 2007. Change and effect on climate to agriculture and animal husbandry in east of Qinghai [J].Science and Technology of Qinghai Agriculture and Forestry, (4): 51 – 57.]
同延安, Emteryd O, 张树兰, 等. 2004. 陕西省氮肥过量施用现状评价[J].中国农业科学, 37(8): 1239 – 1244.[Tong Y A, Emteryd O, Zhang S L, et al. 2004. Evalution of over-application of nitrogen fertilizer in China's Shaanxi Province [J].Scientia Agricultura Sinca, 37(8): 1239 – 1244.]
王立刚, 李 虎, 邱建军. 2008. 黄淮海平原典型农田土壤N2O 的排放特征[J].中国农业科学, 41(4): 1248 – 1254. [Wang L G, Li H, Qiu J J. 2008. Characterization of emissions of nitrous oxide from soils of typical crop fi elds in Huang-Huai-Hai Plain [J].Scientia Agricultura Sinca, 41(4): 1248 – 1254.]
席承藩. 1984. 中国自然区划概要[M]. 北京: 科学出版社. [Xi C P. 1984. Physio-geographic regionalization of China: introduction [M]. Beijing: Science Press.]
信乃诠. 2002. 中国北方旱区农业研究[M]. 北京: 中国农业出版社. [Xin N Q. 2002. Agricultural research in arid regions in northern China [M]. Beijing: Agricultural Publishing House.]
邢光熹, 颜晓元. 2000. 中国农田N2O排放的分析估算与减缓对策[J].农村生态环境, 16(4): 1 – 6. [Xing G X, Yan X Y. 2000. Analysis and estimation of N2O emissions from croplands in China and its mitigation options [J].Rural Eco-Environment, 16(4): 1 – 6.]
徐文彬, 洪业汤. 2000. 贵州省旱田土壤 N2O 释放及其环境影响因素[J].环境科学, 21(1): 7 – 11. [Xu W B, Hong Y T. 2000. N2O emission from upland soils in Guizhou and its environmental controlling factors[J].Environmental Science, 21(1): 7 – 11.]
徐文彬, 刘广深, 刘维屏. 2002. 降雨和土壤湿度对贵州旱田土壤 N2O 释放的影响[J].应用生态学报, 13(1): 67 – 70. [Xu W B, Liu G S, Liu W P. 2002. Effects of precipitation and soil moisture on N2O emissions from upland soils in Guizhou [J].Chinese Journal of Applied Ecology, 13(1): 67 – 70.]
于淑秋, 林学椿, 徐祥德. 2003. 我国西北地区近50年降水和温度的变化[J].气候与环境研究, 8: 9 – 18. [Yu S Q, Lin X C, Xu X D. 2003. The climatic change in Northwest China in recent 50 years [J].Climatic and Environmental Research, 8: 9 – 18.]
张维理, 武淑霞, 冀宏杰, 等. 2004. 中国农业面源污染形势估计及控制对策Ⅰ: 21 世纪初期中国农业面源污染的形势估计[J].中国农业科学, 37(7): 1008 – 1017. [Zhang W L, Wu S X, Ji H J, et al. 2004. Estimation of agricultural non-point source pollution in China and the alleviating strategiesⅠ. Estimation of agricultural nonpoint source pollution in China in early 21 century [J].Scientia Agricultura Sinca, 37(7): 1008 – 1017.]
张小燕, 杨改河. 2005. 中国西北地区退耕还林还草研究[M]. 北京: 科学出版社. [Zhang X Y, Yang G H. 2005. Research of return farmland to forests or grassland in northwest China [M]. Beijing: Science Press.]
郑循华, 王明星, 王跃思, 等. 1996. 稻麦轮作生态系统中土壤湿度对N2O产生与排放的影响 [J]. 7(3): 273 – 279. [Zheng X H, Wang M X, Wang Y S, et al. 1996. Impact of soil humidity on N2O production and emission from a rice-wheat rotation ecosystem [J].Chinese Journal of Applied Ecology, 7(3): 273 – 279.]
中国科学院南京土壤研究所. 1986. 中国土壤图集[M]. 北京:地图出版社. [Institute of Soil Science, Chinese Academy of Sciences. 1986. The soil atlas of China [M]. Beijing: Cartographic Publishing House.]
Babu Y J, Li C, Frolking S, et al. 2006. Fielding validation of DNDC model for methane and nitrous oxide emissions from rice-based production systems of India [J].Nutrient Cycling in Agroecosystems, 74: 157 – 174.
Beheydt D, Boeckx P, Sleutel S, et al. 2007. Validation of DNDC for 22 long-term N2O field emission measurements [J].Atmospheric Environment, 41: 6196 – 6211.
Brown L, Syed B, Jarvis S C, et al. 2002. Development and application of a mechanistic model to estimate emission of nitrous oxide from UK agriculture [J].Atmospheric Environment, 36(6): 917 – 928.
Cai Z, Sawamoto T, Li C, et al. 2003. Field validation of the DNDC model for greenhouse gas emissions in East Asian cropping systems [J].Global Biogeochemical Cycles, 17(4), 1107, doi:10.1029/2003GB002046.
Crutzen P J. 1970. The influence of nitrogen oxides on the atmospheric ozone content [J].Quarterly Journal of the Royal Meteorological Society, 96(408): 320 – 325.
Frolking S, Mosier A R, Ojima D S, et al. 1998. Comparison of N2O emissions from soils at three temperate agricultural sites: simulations of year-round measurements by four models [J].Nultrient Cycling in Agroecosystems, 55: 77 – 105.
Grant B, Smith W N, Desjardins R, et al. 2004. Estimated N2O and CO2emissions as infl uenced by agricultural practices in Canada [J].Climatic Change, 65: 315 – 322.
IPCC. 2007. Climate Change 2007: The Physical Science Basis [R].Cambridge: Cambridge University Press.
Li C, Aber J, Stange F, et al. 2000. A process-oriented model of N2O and NO emissions from forest soils: 1 Model development [J].Journal of Geophysical Research, 105: 4369 – 4384.
Li C, Steve F, Robert H. 1994. Modeling carbon biogeochemistry in agricultural soils [J].Global Biogeochemical Cycles, 8(3): 237 – 254.
Magg M, Vinther F P. 1996. Nitrous oxide emission by nitrifi cation and denitrifi cation in different soil types and at different soil moisture contents and temperatures [J].Applied Soil Ecology, 4: 5 – 14.
Prather M J. 1998. Time scales in atmospheric chemistry: coupled perturbations to N2O, NOy, and O3[J].Science, 279(5355): 1339 – 1341.
Rienecker M M, Suarez M J, Gelaro R, et al. 2011. MERRA: NASA's modern-era retrospective analysis for research and applications [J].Journal of Climate, 24(14): 3624 – 3648.
Smith K A, Thomson P E, Clayton H, et al. 1998. Effects of temperature, water content and nitrogen fertilisation on emissions of nitrous oxide by soils [J].Atmospheric Environment, 32(9): 3301 – 3309.
Smith K. 1997. The potential for feedback effects induced by global warming on emissions of nitrous oxide by soils [J].Global Change Biology, 3(4): 327 – 338.
Stange F, Butterbach-Bahl K, Papen H, et al. 2000. A processoriented model of N2O and NO emissions from forest soils: sensitivity analysis and validation [J].Journal of Geophysical Research: Atmospheres, 105(D4): 4385 – 4398.
Zhang F, Li C, Wang Z, et al. 2006. Modeling impacts of management alternatives on soil carbon storage of farmland in Northwest China [J].Biogeosciences, 3: 451 – 466.
Zhang F, Li C, Wang Z, et al. 2015. Modeling impacts of management on farmland soil carbon dynamics along a climate gradient in Northwest China during 1981—2000 [J].Ecological Modelling, 312: 1 – 10.
Zhang Y, Li C, Trettin C C, et al. 2002. An integrated model of soil, hydrology, and vegetation for carbon dynamics in wetland ecosystems [J].Global Biogeochemical Cycles, 16(4): 1 – 17.
Zheng X, Han S, Huang Y, et al. 2004. Re-quantifying the emission factors based on field measurements and estimating the direct N2O emission from Chinese croplands [J].Global Biogeochemical Cycles, 18(2): 1 – 19.
Spatial variation and infl uence factors of cropland N2O emission in the Northwest Arid Area
ZHANG Fan1, WANG Zheng2, LI Xuxiang1
(1. Department of Environmental Science and Technology, School of Human Settlements and Civil Engineering, Xi'an Jiaotong University, Xi'an 710049, China; 2. State Key Laboratory of Loess and Quaternary Geology, Institute of Earth Environment, Chinese Academy of Sciences, Xi'an 710061, China)
Background, aim, and scopeUpland soil is considered as an important source of N2O emissions. At present there are many research about the field influence factors on N2O emissions. However, in traditional rainfed agricultural region of Northwest China, it still lack of in-depth discussion about how these factors affect N2O emissions synthetically at regional scale. In this study the change trend of N2O emissions and its influence factors under climate fluctuation and management change were discussed based on regional simulation to support the future prediction of change of cropland N2O emissions.Materials and methodsDaily weather data for simulation were taken from the Modern-Era Retrospective Analysis for Research and Application (MERRA). Soil property data were collected form the national soil survey and the Chinese Soil Atlas. Crop parameters, fertilizer application rates were described in the database using agriclutural census data and other sources. Twenty years simulation about the N2O emissions of cropland in Northwest China were made based on these database.ResultsThe analysis of the cropland N2O emission in arid and semi-arid areas of Northwest China show that the regional N2O flux is relatively low and reduced gradually from southeast to southwest with thedecreasing precipitation and temperature overall. The lowest emissions appeared in Ningxia, which account for only 5% of total N2O emissions. Shaanxi has the highest N2O emission, accounting for 50% of the total N2O emissions of the region. There showed signifi cant regional difference and the highest fl ux appeared in southern Shaanxi. Through the 20 years average N2O fl ux was 0.016 kgN·hm-2·a-1and increased fl uctuantly in Nothwest China in the 1980s and 1990s.DiscussionFertilizer rate has decisive effect to the spatial distribution of N2O emissions. High N2O emissions value concentrated in southern Shaanxi and Guanzhong regions mainly due to excessive nitrogen fertilization application in these areas. In addition, this high N2O emissions could be strengthened in southern Shaanxi because of the increased soil moisture caused by higher level of precipitation. However it should also be noticed that southern Shaanxi have higher temperature and is warming fastest. The increasing of soil temperature can promote N2O emissions. Rising temperature can also promote soil water loss and inhibits N2O emission when soil moisture is too low. The influence of climate factor on N2O emissions changed according to different hydrothermal condition.ConclusionsCropland N2O emissions in the Northwest Arid Area was relatively low. N2O emissions reduced gradually from southeast to southwest. Excessive fertilization lead to high N2O emissions in southern Shaanxi. High precipitation and signifi cant warming can further enhance N2O emissions.Recommendations and perspectivesIn the future strengthen the management and effective utilization of chemical fertilizer and water resource to reduce N2O emissions should be the focus of northwest dryland farming management.
cropland soil; N2O; arid and semi-arid area
ZHANG Fan, E-mail: zhangfan@mail.xjtu.edu.cn
10.7515/JEE201603008
2015-11-20;录用日期:2016-01-04
Received Date:2015-11-20;Accepted Date:2016-01-04
国家自然科学基金项目(41301213);中央高校基本科研业务费;黄土与第四纪地质国家重点实验室开放基金(SKLLQG1522)
Foundation Item:National Natural Science Foundation of China (41301213); Fundamental Research Funds for the Central Universities; State Key Laboratory of Loess and Quaternary Geology, IEECAS (SKLLQG1522)
张 凡,E-mail: zhangfan@mail.xjtu.edu.cn
- 地球环境学报的其它文章
- First workshop on indoor air pollution and advanced air pollution control technologies Kumamoto, Japan, January 8 — 11, 2016
- 利用加速器质谱仪进行快速129I检测的方法研究
- The effect of Mg2+on boron incorporation into carbonate and the infl uence of B/Ca proxies for the deep ocean carbonate system
- 湖泊沉积多指标记录的长寿湖近60年来营养化过程
- 大气环流模式CAM4对亚洲气候的高分辨率模拟
- 兴隆山自然保护区优势植物的物候格局对气候变化的响应

