
China's low-carbon investment pathway under the 2°C scenario
2016-02-23 06:45:51JIANGJunZHUANGXingHEChnMinLIUJiXUXingYngCHENSh
JIANG K-Jun*,ZHUANG XingHE Chn-Min,LIU Ji,XU Xing-Yng,CHEN Sh
aEnergy Research Institute,National Development and Reform Commission,Beijing 100038,China
bEnvironment Science and Engineering College,Peking University,Beijing 100871,China
cRenm Consulting,Beijing 100038,China
dBeijing University of Mining&Technology,Beijing 100083,China
eBeijing University of Technology,Beijing 100124,China
China's low-carbon investment pathway under the 2°C scenario
JIANG Ke-Juna,*,ZHUANG Xinga,HE Chen-Minb,LIU Jiac,XU Xiang-Yangd,CHEN Shae
aEnergy Research Institute,National Development and Reform Commission,Beijing 100038,China
bEnvironment Science and Engineering College,Peking University,Beijing 100871,China
cRenm Consulting,Beijing 100038,China
dBeijing University of Mining&Technology,Beijing 100083,China
eBeijing University of Technology,Beijing 100124,China
The generally adopted worldwide target is to keep the increase in the global mean temperature lower than 2°C by 2100,which is comparable with that of the preindustrial era.It is feasible for China to realize an emission pathway that is consistent with this target;however,we need to understand the roadmap to do so.In this paper,the results of a modeling study by the Integrated Policy Assessment Model for China(IPAC) concerning the investment required to realize the 2°C scenario by examining the penetration of low-carbon technologies including energy supply and energy effciency improvement in end-use sectors is presented.It is found that the investment required in the energy supply sector to realize the 2°C scenario could reach CN¥1.2 trillion by 2020,CN¥1.0 trillion by 2030,and CN¥1.4 trillion by 2050.The investment needed for energy saving could reach CN¥1.6 trillion by 2020,CN¥1.8 trillion by 2030,and CN¥1.5 trillion by 2050,which represents the additional investment as compared with the use of old technologies.If the investment required both in the energy supply sector and in energy saving in enduse sectors is considered,the total investment is estimated to be CN¥2.8 trillion by 2020,CN¥2.8 trillion by 2030,and CN¥2.9 trillion by 2050. These investments account for 2.5%of China's total GDP in 2020,1.3%in 2030,and 0.6%by 2050,which represents quite a small investment percentage to realize the goal of low-carbon development.
Climate change;Mitigation;2°C target;Investment;China;Modeling
1.Introduction
Responding to climate change has become a mainstream global policy concern.The goal of achieving a global 2°C temperature target by 2100 was confrmed during the international negotiation process in recent years.For China,it is essential that CO2emissions be reduced to support the global climate change target.
In the research of the IPAC model team(Jiang et al.,2013), it is possible for China to realize the 2°C emission pathway if the policies options could be implemented.The policy options in the studies were also assessed to be made and implemented based on the policy framework in China.However there is strong need to understand the size of investment,which is commonly considered to be huge for the 2°C emission pathway,and will be a big barrier.
China still heavily relies on fossil fuel energy,especially on coal use.Share of coal in total primary energy is 66%in 2014 (NBSC,2015a;NBSC,2015b).There is need to be a rapid transition on energy system under the 2°C emission pathway for China.Among several key policy options,the use of low-carbon technologies to reduce emissions is one of the most important pathways.However,for this to happen,there must be an investment in low-carbon technologies in order for them to become widely established.
Investment for future low-carbon development is a key issue in future pathway to match the future climate targets.There are already some researches to present the related fnding.IEA (2015)concludes that the global demand on newly increased investment is around US$65 trillion from now to 2040 for the 2°C scenario.Global modeling teams also calculated the investment need for the target of 2°C(Chaturvedi et al.,2014; IPCC,2014).In China there are also some researches to estimate the investment demand for low-carbon development (Wang and Zhao,2014;Li,2011;UNDP,2010).These international analysis did not provide technology details for the calculation on investment,and the researchesfrom China did not look at the 2°C target,and more short term focused.To understand the investment requirements,a quantitative modeling tool is used in this study to analyze the technology investment demands under different scenarios.
2.Methodology
2.1.Methodology framework
For future CO2emission reduction,changes in energy supply sector and energy effciency improvement in end-use sector including transport,building and industry are the most important area.This study will mainly focus on the investment need for technology penetration in future in energy supply sector and energy effciency in end-use sectors.
The investment need for energy supply sector will be presented as total fxed cost need,that is the investment for technologies.Other investment such as investment on land, investment on other environment protection,etc.are not covered.For energy effciency investment,it is the additional investment to compare the technologies in baseline scenario and the technologies in the 2°C scenario.For this purpose,in the baseline scenario,benchmark technologies as comparison for higher energy effciency technologies are identifed.Then the investment need is calculated by comparing the difference between fxed cost for both bench mark technologies and higher effciency technologies.In transport sector,investment for subway is given without any baseline comparison,total investment for subway by investment per kilometer is given.
The defnition of power saving investment is the investment in power saving technology minus the investment in baseline technology,which is equal to the extra investment.Concerning transportation,it is diffcult to compare it with baseline technology,with respect to investments in subways,railway locomotives,vessels,and aircrafts.Under these circumstances, investments in these technologies are included in the total investment.
The target year is 2050.This is a milestone year for global greenhouse gas(GHG)emission reduction to realize the longterm climate change target.The investment need is also given up to 2050.
2.2.Model framework
In 1992,the Integrated Policy Assessment Model for China (IPAC)model group of China's Energy Research Institute began building models.After more than twenty years of research and development,the current IPAC has become a comprehensive policy evaluation model that uses a variety of model approaches(http://www.ipac-model.org).The IPAC model has been widely applied to policy evaluations of energy and climate change in China,e.g.,the national 10th Five-Year, 11th Five-Year,and 12th Five-Year Plans.The IPAC-AIM/ technology model is a major component of the IPAC model, whose aim is to give a detailed description of the energy services and related equipment of both the status quo and future development and to simulate the energy consumption process.It includes the computable general equilibrium model, the dynamic economic model,the partial equilibrium model, the minimum cost optimization model based on linear programming techniques that are described in detail,and industry simulation models(Jiang et al,1998,2000,2006,2008).
The IPAC-AIM/technology model covers more than 700 kinds of technologies in 55 sectors,of which more than 150 important technologies were selected in the low-carbon and energy-saving felds for this analysis.To consider these main technologies,we also included their associated learning curves, i.e.future investment costs,as a basis on which to calculate the investment requirements.In the IPAC-AIM/technology model, the technological parameters include the amount of per unit output,the energy consumption in sub-species,other nonenergy inputs,fxed technology investments,and technological pollutant emissions factors.Fixed technology investments are given year by year,including both the technology learning curve and the description of future technology costs.
The IPAC-AIM/technology model employs the minimum cost analysis method,in which a variety of minimum cost technologies can be chosen to examine their energy service performances.This model uses linear programming to analyze some of the complex processes of energy use,and the analysis is conducted with respect to process systems rather than any single technique.In the model analysis,when setting various parameters,different criteria and methods can be used,which can expand the scope of the analysis.For example,various investments during technology operation add up to the total technology operating costs,and these investments can,under different circumstances,cover investments in energy,raw materials,labor,and so on.As such,the analysis of the technology costs can refect those of the actual situation.
2.3.Scenarios
In the IPAC modeling studies,to comprehensively refect the future emissions of GHGs in China,various emission scenarios were designed based on several main factors related to future emissions,drawn from a previous study of scenarios for 2050 that was carried out by the IPAC modeling team (Jiang et al.,2008,2013).In this study,two scenarios are chosen for the investment analysis.
First,a business-as-usual(BAU)scenario was examined in which no extra climate change countermeasures are adopted and all development models are possible.The main driving factor in this scenario is economic development.Based on the conclusions of the previous scenario analysis research(Jiang et al.,2008,2013),it basically refects China's economic development path for the next 50 years,which can be reviewed and commented upon today.The population development model follows the national population plan,in which the population of China will reach a peak of 1.47 billion during 2040-2050.Since 2010 is used as the baseline year,policies issued before 2010 are included in the scenario.
The second scenario is the 2°C scenario,which mainly analyzes whether the emissions in China can support the 2°C warming limit of the pre-industrialization era(generally considered to be 1850-2100).The method used here is to frstly analyze China's emission space under the 2°C target. Then,the IPAC-AIM/technology model is used to analyze China's scenario for this space and focused on the possibilities. The main measures include further enhancing energy conservation,enhanced renewable energy sources,and nuclear power development as well as the further use of carbon capture and storage(CCS).
In this research,the different scenarios are also compared in the discussion of investment and cost.Key parameters for these scenario such as macro-economic development,democracy,industry products output,technology parameters could be found in Jiang et al.(2008,2013).
3.Key factor in future energy and GHG emissions in China
The 2°C target proposed by the G8 summit in Italy in 2009 was written into the Copenhagen Accord,but another indicator-cutting the 2050 global GHG emissions by half from those of 1990-was not included in the Accord.
Among the emission pathways determined by current global model groups for the different warming goals(UNEP, 2015),the green emission range,in which the possibility of achieving the target of 2°C temperature rise is more than 66%, is considered the least likely way to achieve the desired emission target.In the IPCC Fifth Assessment Report,the most likely way to realize the 2°C warming target scenario offered by the model group was to achieve a global emission peak by 2020-2025.The sooner the global emission peak is achieved,the greater the pressure will be imposed on China. So,to analyze China's emission scenario,a scenario in which the global emission pathway will achieve the emission peak later was selected.Based on this consideration and analysis, the Chinese emission scenario is the most favorable for China in realizing the global warming target.
Low-carbon development is not always costly.In this analysis,there are two factors.First,because the energy demand resulting from energy saving in a low-carbon scenario is signifcantly less than that in the baseline scenario,judging the scale of the energy industry sector,the investment in lowcarbon scenario is less than that in the baseline scenario. Second,the technology cost in the low-carbon scenario is higher than that in the baseline scenario,which requires an increasing investment in the energy industry sector.Considering these two factors together,investment in the energy industry sector in the low-carbon scenario is slightly less than that in the baseline scenario.
A country's energy consumption is another indicator for determining that country's required investment.National energy consumption expenditure refers to the amount of end-use energy multiplied by energy prices.On one hand,due to energy saving,fnal energy demand declines in the low-carbon scenario,so expenditure decreases,but due to the increase in energy and carbon taxes,energy prices rise,which leads to increase in cost.Overall,the energy cost in the low-carbon scenario is below that of the baseline scenario.If energy and carbon taxes are not considered,energy prices in the lowcarbon scenario decline compared with those in the baseline scenario.
To achieve a target of a global 2°C temperature increase by 2100,the CO2emissions across the world related to energy activities must drop by 60%by 2050,which is consistent with a 50%decrease in GHG emissions.Considering the diffculty of decreasing GHG emissions by non-energy activities,the main contribution of this decrease is the GHGs discharged due to energy activities.Based on the previous research(Jiang et al.,2013),from 2005 to 2050,the accumulative CO2emission in the baseline scenario is 480 Gt.Under the scenario for achieving the 2°C target,China must control the accumulative emission volume to within 300 Gt,which will account for 38%of the world's emissions.
4.Computation of required investment
Investment in energy supply sector will increase in both BAU scenario and the 2°C scenario because of the future increasing demand for energy.In BAU scenario(Fig.1),due to the slowing down of heavy industry after 2015,the investment energy demand increase will also slow down,and then the newly increase energy infrastructure will be smaller compared with previous years.
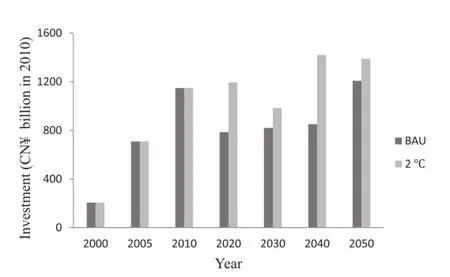
Fig.1.Energy supply sector investment in the baseline scenario and 2°C scenario(unit:CN¥billion in 2010).
Compared with BAU scenario,investment need in the 2°C scenario(Fig.1)increase signifcantly by 2020 and after.The major driving force is to invest on renewable energy development such as wind and solar power,together with grid development to support renewable energy.In 2020,the investment demand in 2°C scenario is 51%higher than the BAU scenario,and 20%,66%,14%higher in 2030,2040 and 2050 respectively.
For investment in energy effciency,there is not big difference between the BAU scenario and the 2°C scenario.In the BAU scenario(Table 1),energy effciency improvement is emphasized,there is not big potential for further improvement in the 2°C scenario(Table 2).In 2020,investment for energy effciency in the 2°C scenario goes up to CN¥1.56 trillion, and then increase to CN¥1.84 trillion in 2030.
Investment in transport is given in Table 3.The investment on subway is given as targeted amount based on the total length of subway system in China,by fguring out the demand of subway with different size of cities.By 2030 altogether there will be 17,000 km subway in China in the 2°C scenario. With the technology progress for higher effciency vehicles, aircraft,vessel etc.,there cost increase is not signifcant compared with traditional technologies.
Investment in power generation sector in detail is given in Table 4.Renewable energy including wind,solar and hydro dominates the newly increased investment.With the assumption of cost reduction in future for renewable energy and nuclear power,the investment for the low carbon power is not huge.
Table 5 lists the detailed investments and emissions per sector,and Tables 6 and 7 detail the capacity of generation per technology.These tables could tell more detailed calculation from the model.It refects the technology progress with learning curve effects in different sectors.Investment in renewable energy is the major part for the investment needs.
As fossil fuel fred power generation,Integrated Gasifcation Combined Cycle(IGCC)should be launched at early time as a clean technology of both CO2emissions and local air pollution.IGCC is not yet on the way to be supported by policies right now.CCS also need to be promoted from today, in order to follow the roadmap for CO2emission reduction by CCS.The policies need to be designed to support CCS to be developed today while its CO2emission reduction will be in future.This is time mismatch which need the policy support. With the 2°C emission pathway,CCS will getting to be very crucial in long term,especially in the negative emission world.
Investment on renewable energy will increase in future,to reach the high penetration by 2050.A good news is the investment for renewable energy already go more than CN¥600billion in 2015,which is higher than the data shows in Table 5. The key question is whether the investment will keep for long time.Based on EU's data,EU only put investment on renewable energy to be more than US$100 billion for 2-3 years,and then decrease sharply(REN21,2016).If China will make the transition in power generation to be low carbon,large amount of investment on renewable energy is essential.The cost of wind and solar,and other modern renewable energy will drop in future.

Table 1Energy saving investment in the baseline scenario(unit:CN¥billion in 2010).
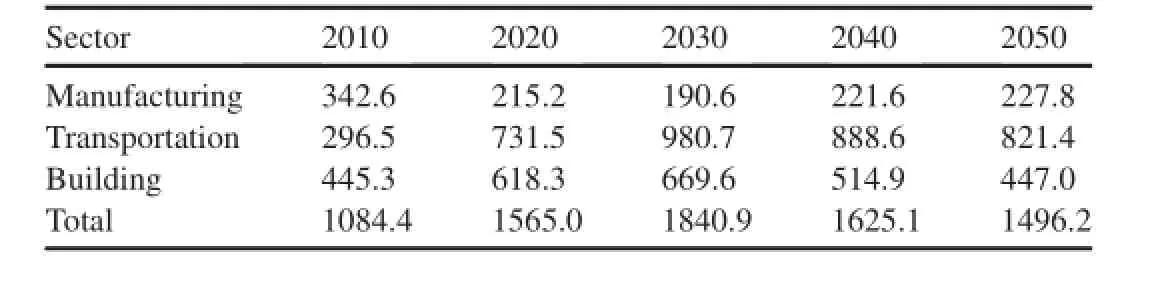
Table 2Energy saving investment in the 2°C scenario(unit:CN¥billion in 2010).
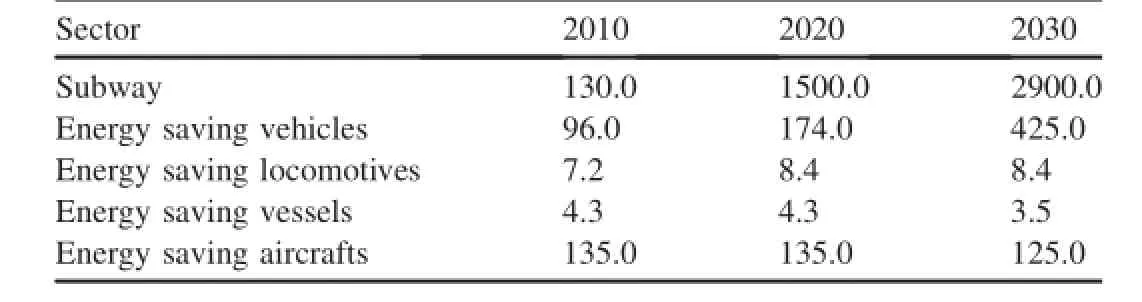
Table 3Transportation investment in the 2°C scenario(unit:CN¥billion in 2010).
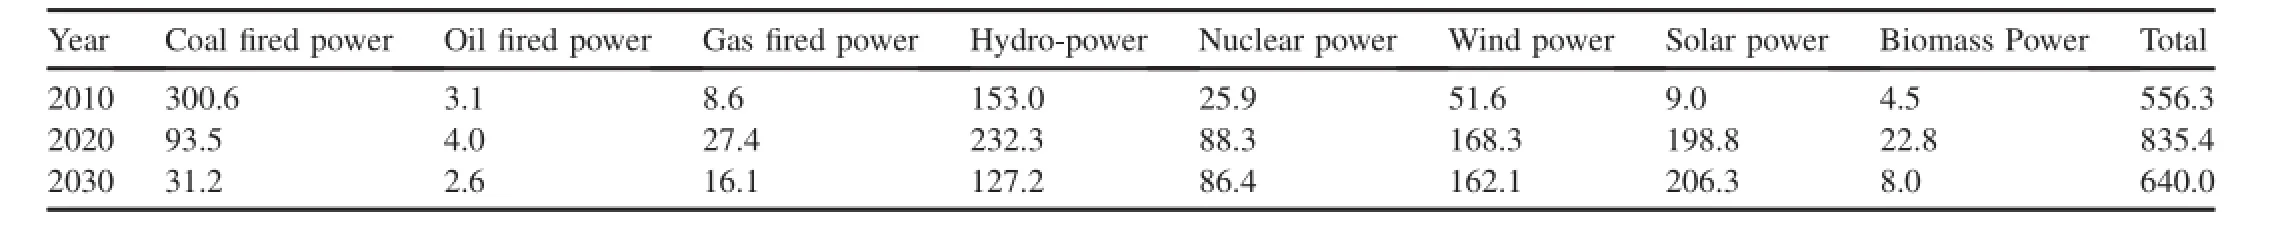
Table 4Energy supply sector investment in the 2°C scenario(unit:CN¥billion in 2010).
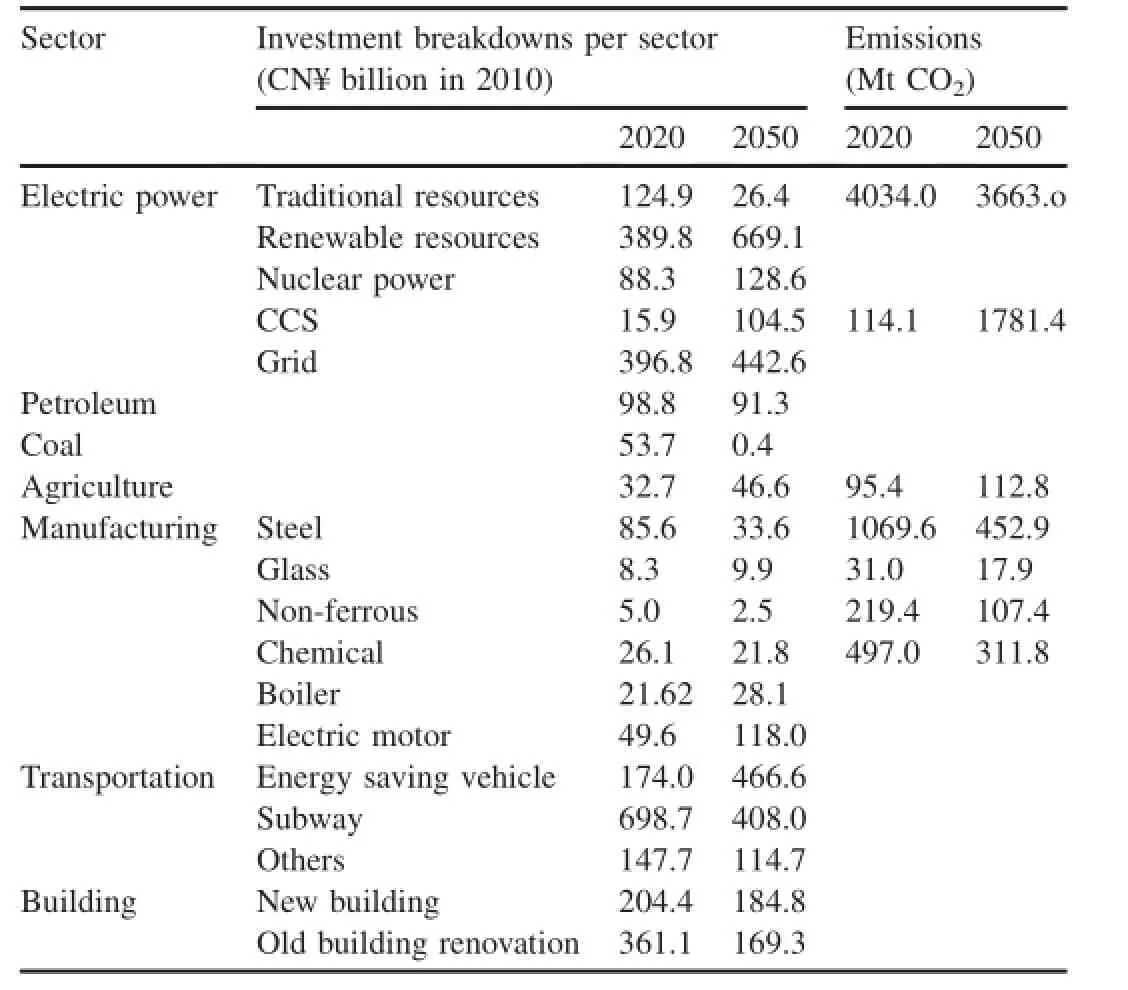
Table 5Investment/power saving investment in the 2°C scenario.
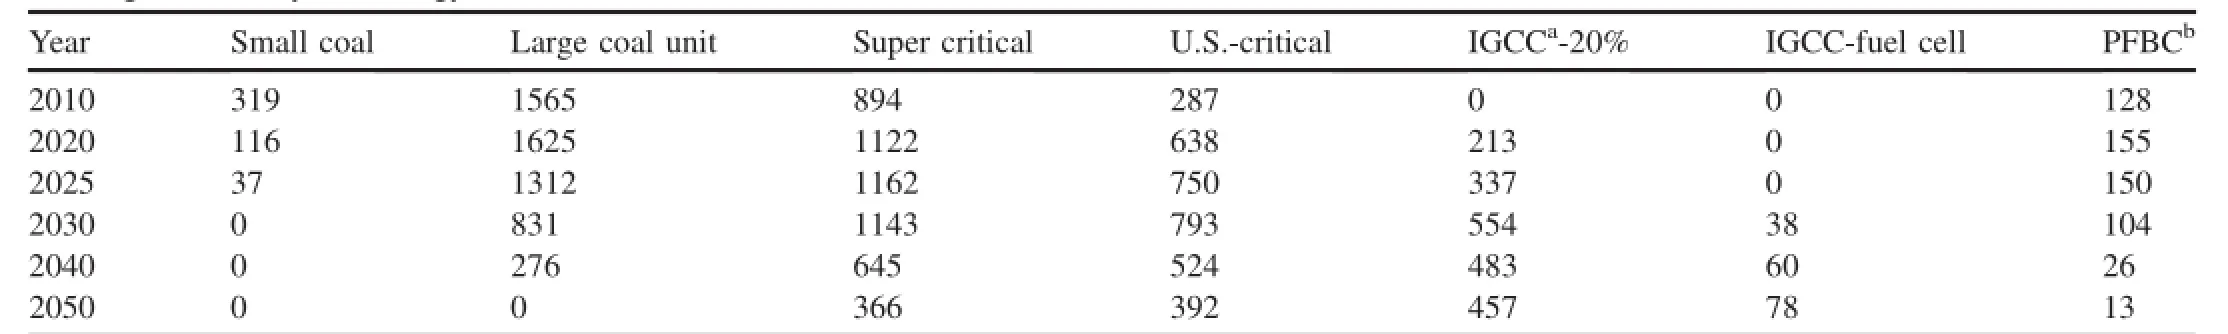
Table 6Power generation by technology in the 2°C scenario(unit:TW h).
5.Conclusions
Despite the diffculty in determining the investment required to realize China's CO2emission target,due to the various defnitions and methodologies used to quantify it,the required investment based on the required technology investment has been considered.Based predictions of the investment needed in the energy industry on the specifc technologies required in the low-carbon scenario with respect to the associated fxed assets.For other end-use energy sectors,the investment required based on the additional cost for more highly energy effcient technologies was calculated,as compared with reference technologies.
Based on the IPAC modeling analysis,the investment required for the energy sector in the 2°C scenario could reach CN¥1.2 trillion by 2020,CN¥1 trillion by 2030,and CN¥1.4 trillion by 2050.
Investment requirements for energy saving could be CN¥1.6 trillion by 2020,CN¥1.8 trillion by 2030,and CN¥1.5 trillion by 2050,which represent the additional investment as compared with using old technologies.
The investments in the energy sector and in energy saving was put together,the requirement would be CN¥2.8 trillion by 2020,CN¥2.8 trillion by 2030,and CN¥2.9 trillion by 2050. These investments account for 2.5%of China's total GDP by 2020,1.3%by 2030,and 0.6%by 2050.As such,they represent quite a small percentage to meet national investment goals for low-carbon development.
Acknowledgments
This study was supported by National Science and Technology Program(2012CB955801),Basic Research and National Objectives&National Basic Research Program of China (2014CB441300),and National Social Science Foundation (15ZDA055).
Chaturvedi,V.,Clarke,L.,James Edmonds,J.,et al.,2014.Capital investment requirements for greenhouse gas emissions mitigation in power generation on near term to century time scales and global to regional spatial scales. Energy Econ.46,267-278.
IEA(International Energy Agency),2015.World Energy Outlook 2015.IEA Publication,Paris.
IPCC,2014.Climate Change:Mitigation of Climate Change.Cambridge University Press,Cambridge and New York.
Jiang,K.,Hu,X.,Zhu,S.,2006.Multi-gas mitigation analysis by IPAC, volume multi-greenhouse gas mitigation and climate policy.Energy J.27 (Special Issue 3),425-440.
Jiang,K.,Hu,X.,Matsuoka,Y.,et al.,1998.Energy technology changes and CO2emission scenarios in China.Environ.Econ.Policy Stud.1, 141-160.
Jiang,K.,Masui,T.,Morita,T.,et al.,2000.Long-term GHG emission scenarios of Asia-Pacifc and the world.Technol.Forecast.Soc.Change 61 (2-3),207-229.
Jiang,K.-J.,Hu,X.-L.,Zhuang,X.,et al.,2008.China's energy demand and emission scenarios by 2050.Adv.Clim.Change Res.Rev.4(5), 296-302.
Jiang,K.-J.,Zhuang,X.,Miao,R.,et al.,2013.China's role in attaining the global 2 target.Clim.Policy 13(S01),S55-S69.http://dx.doi.org/10.1080/14693062. 2012.746070.
Li,M.,2011.Calculation of fund needs for low carbon transition in China.J. Huazhong Univ.Sci.Technol.Soc.Sci.Ed.25(3),98-103.
NBSC(National Bureau of Statistics of China),2015a.China Statistic Year Book.China Statistic Press,Beijing(in Chinese).
NBSC(National Bureau of Statistics of China),2015b.China Energy Statistic Year Book 2015.China Statistic Press,Beijing(in Chinese).
REN21 Renewables,2016.Global Status Report.REN21 Report,Paris.http:// www.ren21.net/status-of-renewables/global-status-report/.
UNDP(The United Nations Environment Programme),2010.China Human Development Report.UNDP Publication.
UNEP,2015.Emission Gaps 2015.UNEP Publication.
Wang,L.-J.,Zhao,Y.,2014.Analysis of economic losses and capital needs in China to achieve low carbon development.Ecol.Econ.30(3).
*Corresponding author.
E-mail address:kjiang@eri.org.cn(JIANG K.-J.).
Peer review under responsibility of National Climate Center(China Meteorological Administration).
http://dx.doi.org/10.1016/j.accre.2016.12.004
1674-9278/Copyright©2017,National Climate Center(China Meteorological Administration).Production and hosting by Elsevier B.V.on behalf of KeAi. This is an open access article under the CC BY-NC-ND license(http://creativecommons.org/licenses/by-nc-nd/4.0/).
Received 27 June 2016;revised 17 October 2016;accepted 7 December 2016
Available online 4 January 2017
 Advances in Climate Change Research2016年4期
- Advances in Climate Change Research的其它文章
- China's response to climate change issues after Paris Climate Change Conference
- Global low-carbon transition and China's response strategies
- The“Sino-India Monitor on INDCs Adequacy and Necessity”(SIMIAN)initiative
- Moving past the rhetoric:Policy considerations that can make Sino-African relations to improve Africa's climate change resilience and the attainment of the sustainable development goals
- Effect of urban symbiosis development in China on GHG emissions reduction
- A modeling study of effective radiative forcing and climate response due to increased methane concentration