综合评分与CTA光点征在预测颅内自发性出血后再出血风险的评估价值比较*
王同钰 徐建国 刘浩 单宝印 胡利刚
(四川大学华西医院神经外科, 四川 成都 610041)
综合评分与CTA光点征在预测颅内自发性出血后再出血风险的评估价值比较*
王同钰徐建国刘浩单宝印胡利刚
(四川大学华西医院神经外科, 四川 成都 610041)
【摘要】目的比较综合评分与CTA光点征在预测颅内自发性出血后再出血风险的临床准确性及可靠性。方法选择2014年2月~2014年10月在我院神经外科治疗的自发性脑出血病人119例,纳入病人均行头部CTA检查,且24小时内未行手术治疗者,复查头部CT,依据已制定的评分标准对每个病人进行评分,最后比较综合评分与CTA光点征的评估价值。 结果评分5~7分的病人有37例(31.1%),CTA光点征阳性的病人有48例(40.8%,一致性检验,κ=0.87)。综合评分的阴性预测值、阳性似然比、灵敏度及Youden指数均高于CTA光点征,其特异度、阴性似然比较CTA光点征没有优势。结论我院设计的综合评分在灵敏度、阴性预测值、Youden指数等方面均较CTA光点征有优势,该综合评分在预测颅内再出血的风险方面具有更好的准确性及可靠性。
【关键词】CTA; 自发性颅内血肿; 血肿再增加; 预测指标
文献报道,自发性脑出血占全部脑卒中的7%~15%,其死亡率接近40%,且无有效的治疗方法[1]。2006年以后较多文献报道颅内出血后,血肿再增加是导致病人死亡以及预后不良的一个独立危险因素,并且探讨了一些影响再出血的因素,比如:CTA光点征、首次出血后到就诊的时间、收缩压、基础血肿量、部位、脑室出血等,其中最受关注的就是CTA光点征[2]。之前及正在进行的一些临床研究表明,通过积极地降压或者促凝治疗可以有效地预防血肿的再增大,然而这些治疗均存在一些风险,比如血栓等,这些风险的发生率虽然不高,但是其后果往往是致命的[3,4]。所以,临床上对待是否给予病人积极治疗的问题上,就存在筛选病人的问题,我们需要一个准确可靠的指标以确定再出血风险更高的病人来给予积极的治疗。至今,在预测颅内再出血方面已有较多的临床指标,其中最受关注的就是CTA光点征,文献报道其特异度为77%左右,灵敏度仅48%左右,这就在一定程度上限制了其在临床的应用。为了提高选择病人的准确性,我们通过查阅文献,选择了光点征、收缩压、基础出血量及出血时间作为指标,采用logistics回归模型对119例病人数据进行了分析,依据其RR值赋予不同指标不同的权重分数,并对其与病人再出血的风险性进行了分析,现报告如下。
1资料和方法
1.1临床资料选取2014年2月~2014年10月在我院住院治疗的自发性脑出血病人119例为研究对象。纳入标准:①发病12小时以内,出血量<100ml(以ABC/2计算)。②24小时内未行手术治疗,且有复查的头部CT。排出标准:①有肾功能损害未能行CTA的病人。②因肿瘤、颅内动脉瘤、血管畸形以及接受抗凝治疗导致的继发性脑出血病人。③深昏迷的病人(GCS评分为3~7分)。脑出血的诊断依据头部CT扫描,详细记录病人的病史、检查及影像学资料,包括:GCS评分、入院后的平均收缩压、入院后平均舒张压、体温、药物史、影像学资料以及常规实验室检查等。并将我们的研究方案详细地告知患者或患者家属以取得所有患者、家属的支持,并在知情同意书上签字,同时通过了医院伦理委员会的审批。
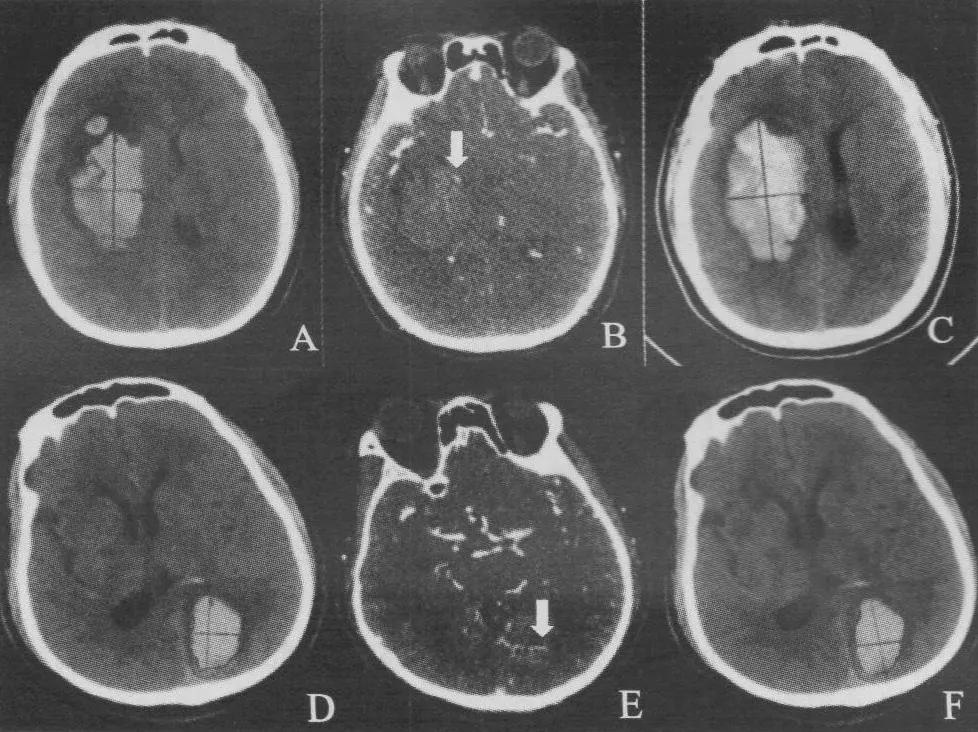
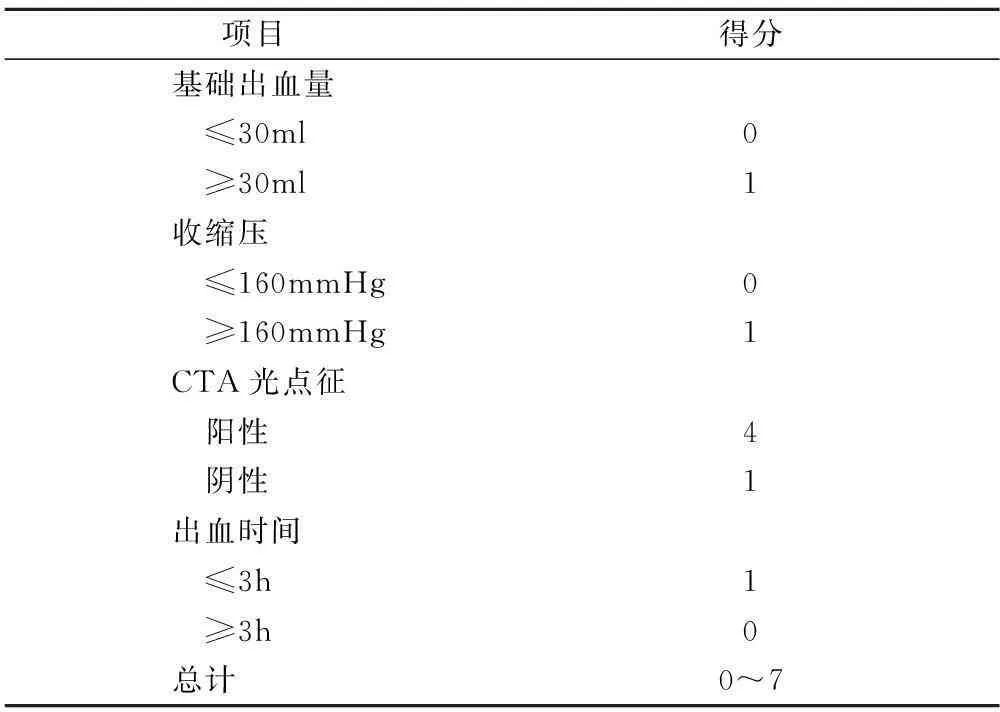
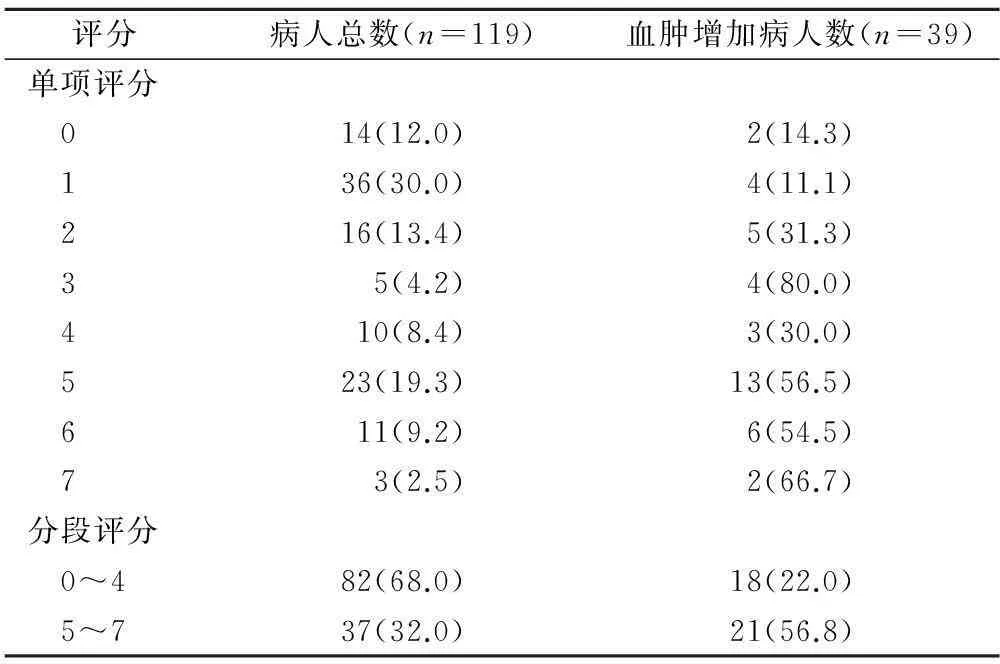
1.2评判标准与方法对病人的资料进行整理,由两名住院医师对血肿量、临床资料进行计算及处理;由两名影像科医师针对有无CTA光点征进行判读并记录,当血肿相差6ml或30%时,或CTA光点征判读结果不一致时,交上级医师评判并最终决定结果。采用如下几条作为判断光点征的定义[5,7]: ①血肿的中心或周边有线样、点状的高密度影。②高密度影直径至少在一个维度上>1.5mm。③高密度影的亨特值,至少是背景血肿的2倍或以上。④在普通CT扫描的相同位置上没有高密度影,以除外钙化灶,见图1。对文献中明确报道的相关危险因素进行单因素及多因素分析,最终根据RR值使用CTA光点征、收缩压、基础出血量、出血时间来建立一个预测血肿增加风险的综合评分系统,见表1:①有光点征得4分。②收缩压>160mmHg得1分。③基础血肿量>30ml得1分。④出血时间≤3h 得1分。将0~7分的病人例数进行统计,并将其分为0~4分及5~7分两组,再将使用该方法与单独使用CTA光点征预测血肿再增加的风险进行比较[8]。
1.3统计学分析数据处理采用SPSS Statistics version 20统计软件。对所有相关危险因素进行单因素分析,并对有统计学意义的独立危险因素进行多因素分析,变量资料采用U检验,分类变量采用Fisher进行分析,多因素分析采用Logistic回归分析,以P<0.05为差异有统计学意义。


图1 CTA光点征的影像学表现
2结果
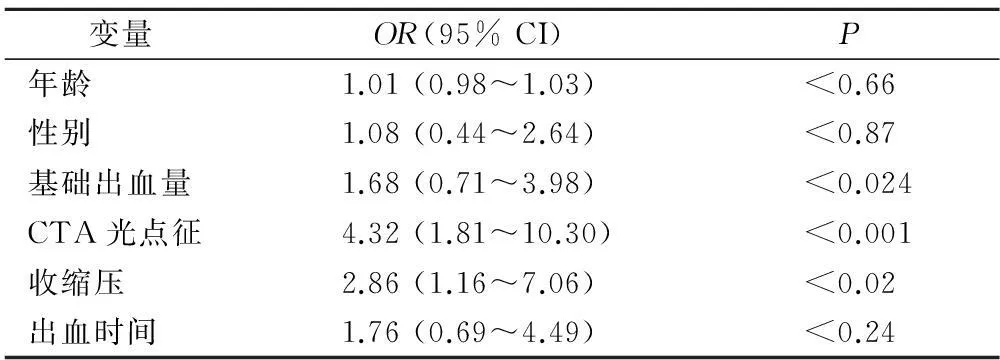
我们记录并分析了两组方法中病人的人口学特征、临床资料及影像学资料,其特征及分布见表2。单因素分析中,各个危险因素的OR值见表3,所有因素中,除年龄、性别及出血时间外均有统计学意义(均P<0.05)。依据评分系统,计算所有病人的综合得分,见表4。并依据评分结果分为低评分及高评分两组,对其判断血肿再增加的预测效果与单独采用CTA光点征进行比较,结果显示,37例 (31.1%)病人评分为 5~7分, 48 例(40.3%)病人光点征阳性,光点征的阳性预测值为61.5%,阴性预测值为70%,灵敏度为50%,特异度为78.9%,阳性似然比为2.37,阴性似然比为0.63,Youden指数为0.29;而高分组的阳性预测值为58.3%,阴性预测值为80%,灵敏度为53.8%,特异度为78.1%,阳性似然比为2.59,阴性似然比为0.55,Youden指数为0.35。两种方法评估价值比较,结果显示,两者在预测血肿再增大方面的一致性较差(McNemar配对χ2检验,kappa=0.33,P<0.05)。

表2 119例病人的临床资料及其分布±s)

表3 各个危险因素的OR值

表4 病人得分分布[n(×10-2)]
3讨论
不少研究都在探讨自发性颅内出血后血肿再增大的因素,然而多数研究都仅仅局限于单一因素的研究与分析,联合使用多种因素对病人的整体情况进行评分,并根据评分的高低来判断患者再出血的风险研究尚未在文献中报道。依据我中心的临床经验,我们倾向于认为出血再增加是由多种因素共同作用的结局,而不是单一因素的作用。查阅文献后我们提出这样的假设:颅内自发性出血后血肿量再增加是由于损伤或破裂血管的破口尚未在物理及化学因素的作用下完全闭合,即血管壁尚存薄弱点,而薄弱点的存在与出血后的时间、颅内压力相关,在薄弱点的存在情况下,由于血压增高所导致的血管透壁压力的上升,必然导致血管薄弱点的破裂风险增加以致再次出血[9~13]。在这一假设的驱动下,我们广泛的查阅文献,选择了4个已被前瞻性临床研究所证实的危险因素,并使用该危险因素对病人进行评分,经过对119例病人的评估分析后,出血时间是该研究中唯一的在单因素分析有意义而多因素分析没有意义的危险因素,但是在我们的评分系统中还是采用了该因素,因为我们认为,之所以出现这种情况的原因,可能是因为我们的样本偏倚导致的,119例病人中仅有39例在发病后3小时内入院,所以我们认为是因为样本分布的不平衡导致了这样的结果[14~16]。
在本研究中,来我院就诊的自发性脑出血病人大多数来自周边县、市的医疗机构,以至于不能及时将病人送至我院,导致出血时间这个危险因素难以控制。其次,我院病人的病情相对较重,以至于本研究的结论适用人群受到限制,不能广泛地用于我国的自发性脑出血人群。针对本研究的不足,我们计划在下一步工作中联合周边县市医院进行统一的多中心的前瞻性临床研究,增加病人的纳入量,以提高研究结果的外延性。
4结论
本研究结果显示,我院设计开发的综合评分指标在灵敏度、阴性预测值、Youden指数等方面均较CTA光点征有优势,该综合评分在预测颅内再出血的风险方面具有更好的准确性、可靠性及临床应用前景。
【参考文献】
[1]Demchuk AM, Dowlatshahi D, Rodriguez-Luna D,etal. Prediction of haematoma growth and outcome in patients with intracerebral haemorrhage using the ct-angiography spot sign (predict): A prospective observational study[J]. The Lancet, 2012,11(9): 307-314.
[2]Davis SM, Broderick J, Hennerici M,etal. Hematoma growth is a determinant of mortality and poor outcome after intracerebral hemorrhage[J]. Neurology, 2006,66(3):1175-1181.
[3]Garg RK, Liebling SM, Maas MB,etal. Blood pressure reduction, decreased diffusion on mri, and outcomes after intracerebral hemorrhage[J]. Stroke, 2012,43(11):67-71.
[4]Tsivgoulis G, Katsanos AH, Butcher KS,etal. Intensive blood pressure reduction in acute intracerebral hemorrhage: A meta-analysis[J]. Neurology, 2014,83(2):1523-1529.
[5]Koga M, Arihiro S, Hasegawa Y,etal. Intravenous nicardipine dosing for blood pressure lowering in acute intracerebral hemorrhage: The stroke acute management with urgent risk-factor assessment and improvement-intracerebral hemorrhage study[J]. Journal of stroke and cerebrovascular diseases,2014,79(4):1889-1903.
[6]Wada R, Aviv RI, Fox AJ,etal. Ct angiography "spot sign" predicts hematoma expansion in acute intracerebral hemorrhage[J]. Stroke,2007,38(2):1257-1262.
[7]Koculym A, Huynh TJ, Jakubovic R,etal. Ct perfusion spot sign improves sensitivity for prediction of outcome compared with cta and postcontrast ct[J]. American journal of neuroradiology, 2013,34(7):965-970, S961.
[8]Thompson AL, Kosior JC, Gladstone DJ,etal. Defining the ct angiography 'spot sign' in primary intracerebral hemorrhage The Canadian journal of neurological sciences[J]. Le journal canadien des sciences neurologiques,2009,36(17):456-461.
[9]Ederies A, Demchuk A, Chia T,etal. Postcontrast ct extravasation is associated with hematoma expansion in cta spot negative patients[J]. Stroke,2009,40(8):1672-1676.
[10] Takeda R, Ogura T, Ooigawa H,etal. A practical prediction model for early hematoma expansion in spontaneous deep ganglionic intracerebral hemorrhage[J]. Clinical neurology and neurosurgery, 2013,115(6):1028-1031.
[11] Rodriguez-Luna D, Dowlatshahi D, Aviv RI,etal. Venous phase of computed tomography angiography increases spot sign detection, but intracerebral hemorrhage expansion is greater in spot signs detected in arterial phase[J]. Stroke,2014,45(5):734-739.
[12] Romero JM, Brouwers HB, Lu J,etal. Prospective validation of the computed tomographic angiography spot sign score for intracerebral hemorrhage[J]. Stroke,2013,44(1):3097-3102.
[13] Dowlatshahi D, Wasserman JK, Momoli F,etal. Evolution of computed tomography angiography spot sign is consistent with a site of active hemorrhage in acute intracerebral hemorrhage[J]. Stroke, 2014,45(8):277-280.
[14] Brouwers HB, Biffi A, Ayres AM,etal. Apolipoprotein e genotype predicts hematoma expansion in lobar intracerebral hemorrhage[J]. Stroke,2012,43(10):1490-1495.
[15] Radmanesh F, Falcone GJ, Anderson CD,etal. Risk factors for computed tomography angiography spot sign in deep and lobar intracerebral hemorrhage are shared[J]. Stroke,2014,45(11):1833-1835.
[16] Gazzola S, Aviv RI, Gladstone DJ,etal. Vascular and nonvascular mimics of the ct angiography "spot sign" in patients with secondary intracerebral hemorrhage[J]. Stroke,2008,39(13):1177-1183.
Comparison between comprehensive score system and CTA ‘spot sig’ in predicting the risk of spontaneous intracranial hemorrhageWANG Tongyu,XU Jianguo,LIU Hao,etal
(DepartmentofNeurosurgery,WestChinaHospital,SichuanUniversity,Chengdu610041,China)
【Abstract】ObjectiveThe prospective clinical trial was conducted to make a comparison between a new developed mixed prediction score system and ‘spot sign’ only on the accuracy and reliability to predict hematoma. MethodsFrom February to the end of October 2014, according to the protocol we had designed in advance, 119 patients were included in this trial. The medical records of these patients were collected and arranged by our trained resident doctors, the presence or not of spot sign and 24h follow-up head CT were judged by two masked neuro-radiologists. The score for each item and total points were made by resident doctors. The agreement of interobserver was evaluated by the multirater κ statistics. ResultsTotally, 37 (31.1%) patients located in 5 to 7 scores subgroup and 48 (40.3%) patients with spot sign were detected (κ=0.87). The negative predictive value (80%), the positive likelihood ratio (2.59), the sensitivity (56.7%) and the Youden index (0.35) for the score system were superior to the that of spot sign only, but the specificity (78.1%), the negative likelihood ratio (0.55 ) took no advantages to the spot sign. ConclusionsThe newly developed score system by our center takes advantages in the sensitivity, negative predictive value, likelihood ratio and Youden index to spot sign alone. The new system might be a more accurate and reliable predictor.
【Key words】Computed Tomography Angiography; Intracerebral hemorrhage; Hematoma growth; Prediction score
(收稿日期:2015-01-08; 修回日期: 2015-05-12; 编辑: 母存培)
通讯作者:徐建国,E-mail:342964431@qq.com
基金项目:国家自然科学基金(81172411)
【中图分类号】R 651.1+5
【文献标志码】A
doi:10.3969/j.issn.1672-3511.2015.09.011

