Hydraulic metal structure health diagnosis based on data mining technology
* Corresponding author.
Hydraulic metal structure health diagnosis based on data mining technology
Guang-ming Yanga,b,*,Xiao Fengc,Kun YangcaCollege of Energy and Electrical Engineering,Hohai University,Nanjing 210098,PR ChinabResearch Center for Renewable Energy Generation Engineering,Ministry of Education,Hohai University,Nanjing 210098,PR China
cDayu College,Hohai University,Nanjing 210098,PR China
Received 14 November 2013; accepted 31 October 2014 Available online 8 May 2015
* Corresponding author.
Abstract
In conjunction with association rules for data mining,the connections between testing indices and strong and weak association rules were determined,and new derivative rules were obtained by further reasoning.Association rules were used to analyze correlation and check consistency between indices.This study shows that the judgment obtained by weak association rules or non-association rules is more accurate and more credible than that obtained by strong association rules.When the testing grades of two indices in the weak association rules are inconsistent,the testing grades of indices are more likely to be erroneous,and the mistakes are often caused by human factors.Clustering data mining technology was used to analyze the reliability of a diagnosis,or to perform health diagnosis directly.Analysis showed that the clustering results are related to the indices selected,and that if the indices selected are more significant,the characteristics of clustering results are also more significant,and the analysis or diagnosis is more credible.The indices and diagnosis analysis function produced by this study provide a necessary theoretical foundation and new ideas for the development of hydraulic metal structure health diagnosis technology.©2015 Hohai University.Production and hosting by Elsevier B.V.This is an open access article under the CC BY-NC-ND license (http://creativecommons.org/licenses/by-nc-nd/4.0/).
Keywords:Hydraulic metal structure; Health diagnosis; Data mining technology; Clustering model; Association rule
This work was supported by the Key Program of the National Natural Science Foundation of China (Grant No.50539010)and the Special Fund for Public Welfare Industry of the Ministry of Water Resources of China (Grant No.200801019).
E-mail address: gmyang@hhu.edu.cn (Guang-ming Yang).Peer review under responsibility of Hohai University.
http://dx.doi.org/10.1016/j.wse.2015.04.010
1674-2370/©2015 Hohai University.Production and hosting by Elsevier B.V.This is an open access article under the CC BY-NC-ND license (http://creativecommons.org/licenses/by-nc-nd/4.0/).
1.Introduction
Hydraulic metal structure health diagnosis is based on investigation and analysis of the status of operating equipment,site safety testing,review of the structural safety calculation results,and comprehensive analysis of every diagnosis index,eventually obtaining the final equipment health diagnosis through fuzzy comprehensive diagnosis analysis.At present,there are many health diagnosis methods in engineering fields,such as the reliability evaluation method,analytic hierarchy process,expert judgment method,and neural network technology.Each method has its advantages and disadvantages,applicable in different occasions.The hydraulic metal structure health diagnosis system needs to consider various factors,and perform comprehensive diagnosis with the multilayer,multi-standard,and multi-factor analysis model.Yang (2011)established an expert system for evaluating the safety of hydraulic metal structures.Yang (2012)developed a multilayer fuzzy comprehensive evaluation index system for hydraulic metal structure health diagnosis.
Data mining is the process of extracting or mining useful information from large amounts of data.Because data mining technology has significant advantages in the processing of large amounts of data,many industries,especially scientific research,finance,and education,have been utilizing data mining technology.In the fields of water resources and hydropower engineering,many scholars have used data mining technology to research dam safety monitoring system (Xiang et al.,2003; Zhu et al.,2007).However,few experts have conducted research on hydraulic metal structure diagnosiswith data mining technology.Combining data mining with information theory technology (Han and Kamber,2006; Mao et al.,2007; Hu et al.,2012),this study used data mining technology to establish a clustering data mining model for hydraulic metal structure health diagnosis,and examined key technology for hydraulic metal structure health diagnosis,which includes importance analysis of the indices,correlation analysis of the indices,and analysis of the diagnosis conclusion.The significant problem in hydraulic metal structure health diagnosis is ensuring the accuracy and consistency of the original data.First,in conjunction with association rules for data mining,the connections between testing indices and strong and weak association rules were obtained by making full use of the historical data,and new derivative rules could be obtained by further reasoning.Based on correlation analysis of indices with association rules,checking the consistency between index data was proposed.Based on that,this study analyzed the reliability of diagnosis with clustering technology.Using this method,data mining technology can be applied in real-world hydraulic metal structure health diagnosis.
2.Association rules of testing indices
Association rules (Su et al.,2004; Lou et al.,2003)are an important subject in data mining; they are used to dig out valuable correlations between data.Using the gate testing as an example,we studied the use of association rules to mine the possible connection between different testing indices (Li and Li,2003; Cover et al.,2003; Liang,2006; Sha,2008).It is difficult to determine whether there is a correlation between indices by tested data directly,so multi-level association rules are used in mining.For two testing indices,X and Y,there exists an association rule between them: X: x/Y: y.The association rule can be classified into the following three types: (1)a strong association rule: when the grade of index X is x,the grade of index Y is most likely to be y; (2)a weak association rule (even a non-association rule): when the grade of index X is x,the grade of index Y is most unlikely to be y; and (3)a derivative rule,the other weak association rule,deduced by the weak association rule: when the grade of index X is x,the grade of index Y is most unlikely to be y and less likely to be grades lower than y.
2.1.Strong association rules
We selected 18 samples from historical testing data records of gates,and numbered them from 1 to 18.To analyze correlation between six indices (also referred to as six items in association rules),the strength of main components,depth of the corrosion pit,area of corrosion,maintenance,years of operation,and performance,the calculation process of mining strong association rules was as follows:
(1)Based on each data sample,1-itemsets were obtained,as shown in Table 1.
(2)Assuming that the minimum support value was 5/18,grades of testing indices with support values less than the minimum value were deleted,and frequent 1-itemsets were obtained,as shown in Table 2.The support value can be calculated with the following formula:

where m1is the number of same samples with the testing index X at grade x and the testing index Y at grade y,and M is the total number of all samples.
(3)Connecting different indices in frequent 1-itemsets in pairs,candidate 2-itemsets were obtained.The 2-itemsets with support values less than the minimum value in the candidate 2-itemsets were deleted,and frequent 2-itemsets were obtained,as shown in Table 3,where the testing indices X1and X2are two items of a frequent 2-itemset.
(4)Connecting the items in Table 3,candidate 3-itemsets were obtained.The 3-itemsets with support values less than the minimum value in the candidate 3-itemsets were deleted,and frequent 3-itemsets were obtained,as shown in Table 4,where the testing indices X1,X2,and X3are three items of a frequent 3-itemset.According to Tables 3 and 4,secondary association rules

Table 1 1-itemsets.

Table 2 Frequent 1-itemsets.
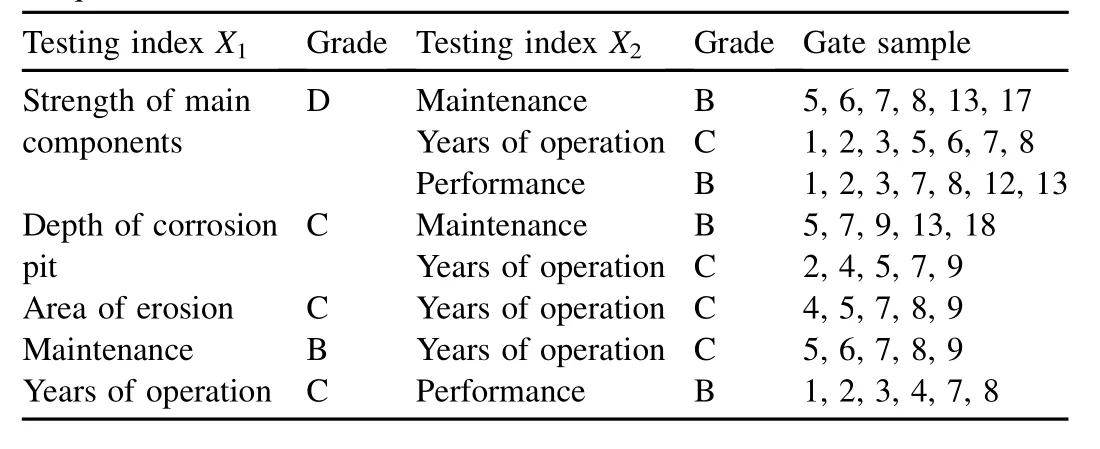
Table 3 Frequent 2-itemsets.
and three-level association rules were obtained separately,and
the confidence of each rule was obtained with the following

formula: where m2is the number of samples with the testing index X at grade x.
The confidence calculation results of strong association rules are given in Table 5.
It can be seen from Table 5 that the confidence (Strength of main components: D/Years of operation: C)is 0.7.That is to say,the probability of the tested grade of years of operation being C is 70%.
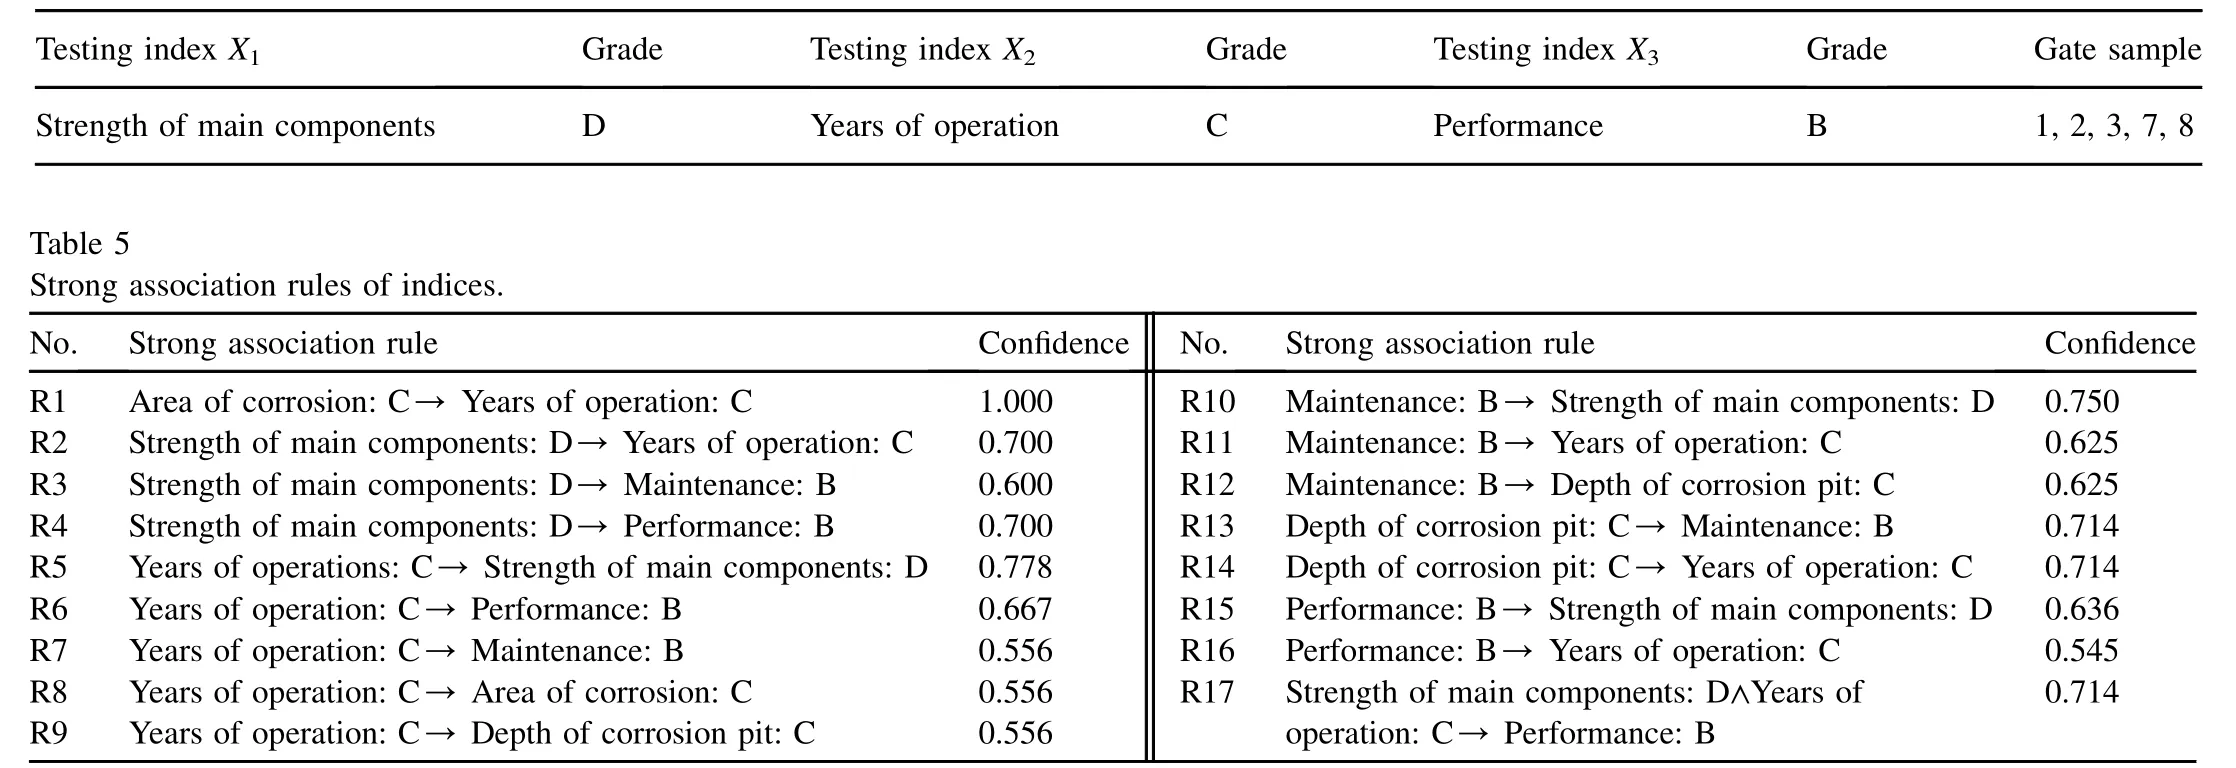
Table 4 Frequent 3-itemsets.
2.2.Weak association rules
In the strong association rules,some indices that should be associated do not appear,including the depth of the corrosion pit and the area of corrosion.Although this is related to the number of samples,it still suggests that the mining of strong association rules is not complete,and some weak association rules are also very effective in the inspection of testing index grades.We again use the above example to examine the mining process of weak association rules.Steps (1)and (2)are still used,and in step (3),after a minimum confidence is given,we connect the indices with support values greater than or equal to the minimum value in pairs.If the confidence of an association rule is less than the minimum confidence,a secondary association rule is produced.For example,in Table 1,the gate sample set shown is {10,11,14,15,17} when the grade of the depth of the corrosion pit is B,and the gate sample set shown is {5,6,7,8,9,13,17,18} when the grade of maintenance is B.After connecting them in pairs,the gate sample set changes to {17},and the confidence (Depth of the corrosion pit: B/Maintenance: B)is 1/5¼0.2.Conversely,the confidence (Maintenance: B/Depth of the corrosion pit: B)changes to 1/8¼0.125.In this study,the two weak association rules: X: x/Y: y and Y: y/X: x,were the same,but the larger confidence of the two was selected.Therefore,we determined that the confidence (Depth of the corrosion pit: B/Maintenance: B)was 0.2.That is to say,the probabilityfor the situation in which both the depth of the corrosion pit and maintenance are not at grade B is at least 80%.Given a minimum confidence of 0.2,weak association rules are given in Table 6.In this way,the association between the depth of the corrosion pit and the area of corrosion can be seen more clearly: the R4 rule shows that,when the tested grade of the depth of the corrosion pit is B,the tested grade of the area of corrosion cannot be C; the R7 rule shows that,when the tested grade of the depth of the corrosion pit is C,the tested grade of the area of corrosion cannot be A.In most cases,a judgment based on weak association rules and non-association rules is more accurate and more credible than one based on strong association rules such as those in Table 5.
We noticed that when the tested grade of the depth of the corrosion pit was B,the tested grade of the area of corrosion could not be C.The depth of the corrosion pit and the area of corrosion are positively correlated: the deeper the corrosion pit is,the larger the area of corrosion will be; conversely,the larger the area of corrosion is,the deeper the corrosion pit will be.Thus,based on the weak association rules in Table 6,we further infer that if the tested grade of the depth of the corrosion pit is B,the tested grade of the area of corrosion cannot be D; if the tested grade of the depth of the corrosion pit is A,the tested grade of the area of corrosion cannot be C; if the tested grade of the depth of the corrosion pit is A,the tested grade of the area of corrosion cannot be D; and so on.
Accordingtothedefinitionofaweakassociationrule(X:x/Y: y)with a confidence of k,we deduced the following:
(1)If X and Y are positively correlated,then the weak association rule (X: x'/Y: y')with a confidence of k can be derived,where the grade denoted by x' is higher than that denoted by x and the grade denoted by y' is lower than that denoted by y.
(2)If X and Y are negatively correlated,then the weak association rule (X: x'/Y: y')with a confidence of k can be derived,where the grades denoted by x' and y' are higher than those denoted by x and y,respectively (or the grades denoted by x' and y' are lower than those denoted by x and y,respectively).
Therefore,weak association rules can be derived from Table 6,as shown in Table 7.
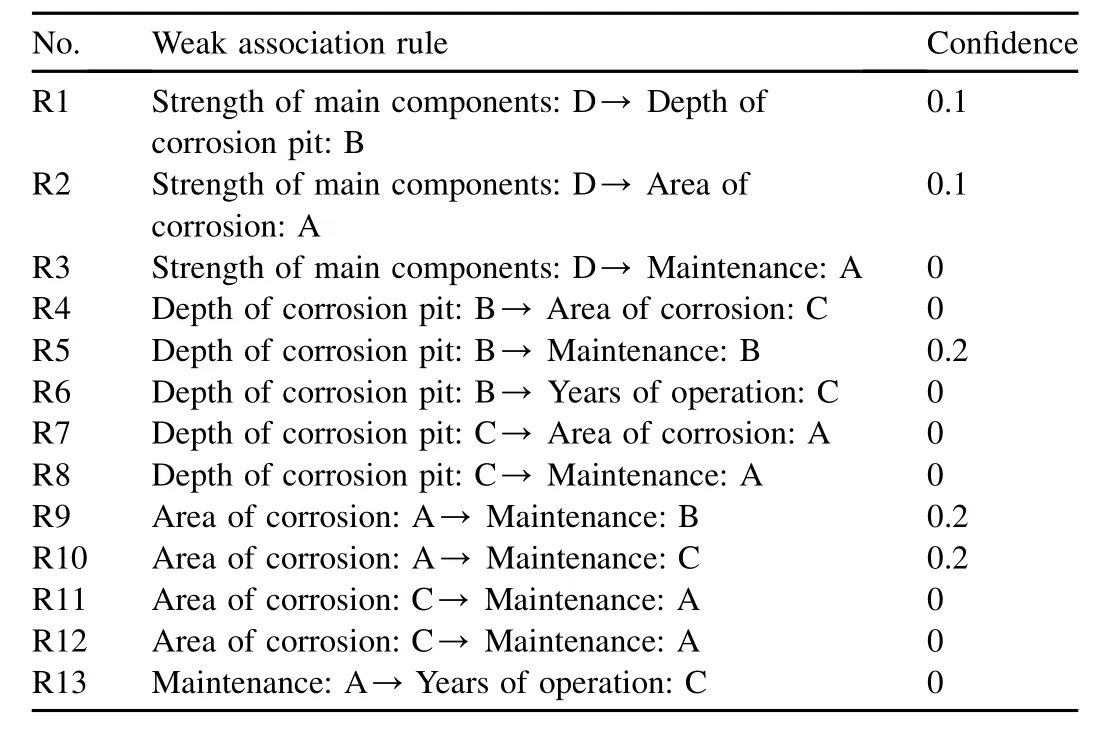
Table 6 Weak association rules of indices.
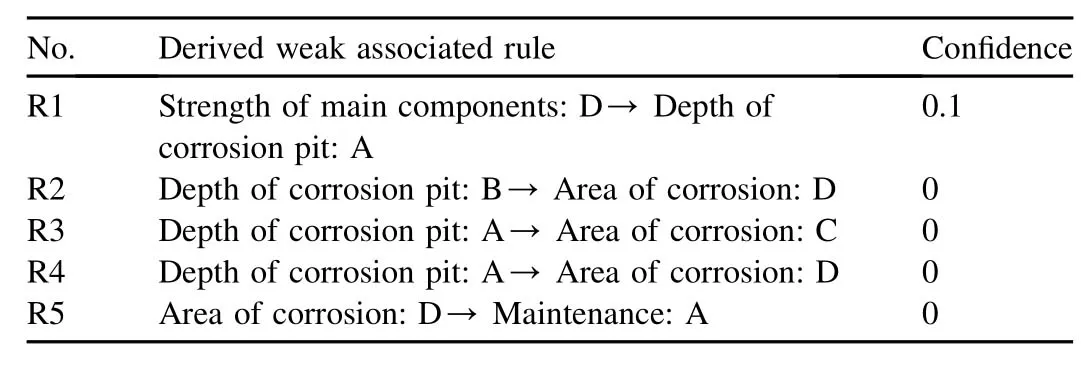
Table 7 Derived weak associated rules of indices.
3.Index consistency testing
Health diagnosis of metal structures,such as gates and hoists,needs to test a lot of indices,and determination of the values of these indices affects the final diagnosis (Li et al.,2014; Ma,2009; Patev and Putcha,2005; Qi and Hu,2014; Zhu,2014).However,testing of many index values often includes some subjectivity; different experts may obtain different testing values in different environments,and error can also be caused by artificial input.Therefore,the significant problem in health diagnosis is ensuring the accuracy and consistency of the original data,which can be tested using association rules.Based on analysis of historical testing data,it is assumed that we obtained an association rule: when the grade of index X is x,the grade of index Y is most likely y.Thus,when the testing grade of index X is x,and the testing grade of index Yis not y,this means that the testing grades of X and Y may not be consistent.
For a health diagnosis,based on association rules obtained with mining or derivation,we can further analyze the consistency of testing index grades.Assuming that X and Yare testing indices,according to the existing association rule (denoted as R)X: x/Y: y,the consistency is evaluated as follows:
(1)If R is a strong association rule,and the testing grades of Xand Yarexand y,respectively,then the testinggradesof Xand Y are consistent.If the testing grade of X is x,and the testing grade of Y is not y,then their testing grades are not consistent.
(2)If R is a weak association rule,and the testing grades of X and Yare x and y,respectively,then testing grades of X and Y are not consistent.Otherwise,their testing grades are consistent.
For a metal structure,after standardizing the testing grades of indices,based on the above principles,the association rules can be used to test each index and remind the users when the testing grades are not consistent.Of course there are also some special cases.However,in most cases,the users pay attention to the tests,and verify the grades when they are not consistent.This research shows that,when the testing grades of two indices in a weak association rule are not consistent,the testing grades are more likely to be erroneous.Usually the errors are caused by human factors.
4.Clustering data mining model for hydraulic metal structure health diagnosis
Compared with fuzzy analytic hierarchy process (FAHP)(Yang and Jia,2011; Yang,2012; Yang and Jing,2014),theneural network diagnosis method has unclear interpretability.Therefore,according to the data mining technology (Han and Kamber,2006; Mao et al.,2007; Li and Li,2003; Liang,2006),we proposed a clustering data mining model for hydraulic metal structure health diagnosis.Clustering analysis is a process of grouping a set of objects into different classes or clusters so that objects in a cluster have high similarity,but are dissimilar to objects in other clusters.This clustering analysis first groups historical data to obtain different clusters,then determines which cluster a sample to be analyzed belongs to,and finally evaluates the health status according to the characteristics of the cluster.
In a sense,as a kind of health diagnosis method,the clustering data mining model for hydraulic metal structure health diagnosis can be used to diagnose the health status of a testing item.However,through comparison and analysis of experimental results,we found that the clustering data mining model for hydraulic metal structure health diagnosis does not have high stability,and the diagnosis accuracy fluctuates greatly with different samples.Therefore,in this study the clustering data mining model for hydraulic metal structure health diagnosis was used as an auxiliary method,to analyze and explain the diagnosis of a neural network model.For a specific testing item,the health grade should be calculated with the neural network model (Yang et al.,2014).In this study,after that calculation we used clustering analysis to determine which cluster the sample belonged to.Samples from the same cluster had similar characteristics,and the diagnosis conclusion could be explained through all samples from the cluster.
Next,we studied how to cluster gate samples based on clustering data mining technology.It was assumed that each sample had p indices,mapped to a point of p dimensional space (x1,x2,/,xp),where xirepresents the grade of the ith indices.Similarity of the samples was measured by calculating the Manhattan distance of the sample to the center of the cluster:

where yiis the center of the cluster of ith index.
The steps of the clustering algorithm are as follows:
(1)Samples are classified into several clusters.Then,several samples are randomly selected as the centroids of the clusters.(2)The Manhattan distances of the rest of the samples to the centroid of each cluster are computed,and these samples are assigned to corresponding clusters based on the principle of minimum distance.(3)The mean value of the samples of each cluster is computed and taken as the new centroid.(4)Steps (2)and (3)are repeated,until the mean value no longer changes.
In the application of clustering data mining technology,the main difficulty encountered is making the characteristics of clustering results more apparent in order to make the analysis results more credible.Through the experiment,we found that clustering results were related to indices selected.After a great deal of experimental comparison,we chose 48 gate samples,and the samples were grouped into six clusters.A cluster contains different gate samples,and the total number of samples is n.The numbers of gate samples corresponding to the grades of the health status I,II,and III are n1,n2,and n3,respectively,and the characteristics of a cluster are represented by the ratio of nito n (i¼1,2,and 3).Table 8 shows the clustering results based on all indices.From the clustering results,we can see that the polymerization of results obtained is not obvious and the distinction between clusters is not very significant.For example,in the second cluster,the gate samples of all statuses appeared at the same time.
The degrees of important of different indices to gate health status are different,so some unimportant indices can be ignored in the clustering process,which can reduce the interference to the clustering results.We chose ten important testing indices,including the strength of main components,depth of the corrosion pit,area of corrosion,stability of the radial gate,deflection of the main beam,maintenance,performance,safety detection,years of operation,and material.Clustering of the 48 gate samples was carried out again.Clustering results are given in Table 9.The results show that gate samples of each cluster have two statuses or only one status,and the distinction between clusters is very significant.
According to the clustering results,the diagnosis can be analyzed.Given a metal structure that needs to be diagnosed,we calculated the distance of the sample of the metal structure to each cluster,then determined which cluster the sample belonged to using the minimum distance principle,and finally determined the health status with the characteristics of the cluster.For example,if a metal structure that needs to be diagnosed falls in cluster 2 in Table 9,it can be determined that the health grade is III with a probability of 87.5%.
5.Conclusions
(1)In conjunction with association rules for data mining,the connections between testing indices and strong and weak association rules were determined,and new derivative rules were obtained with further reasoning.After analysis of the correlation between the indices with association rules,we used association rules to test the consistency between index data.Inmost cases,the judgment obtained by the weak association rule or non-association rule was more accurate and more credible than that obtained by the strong association rule.
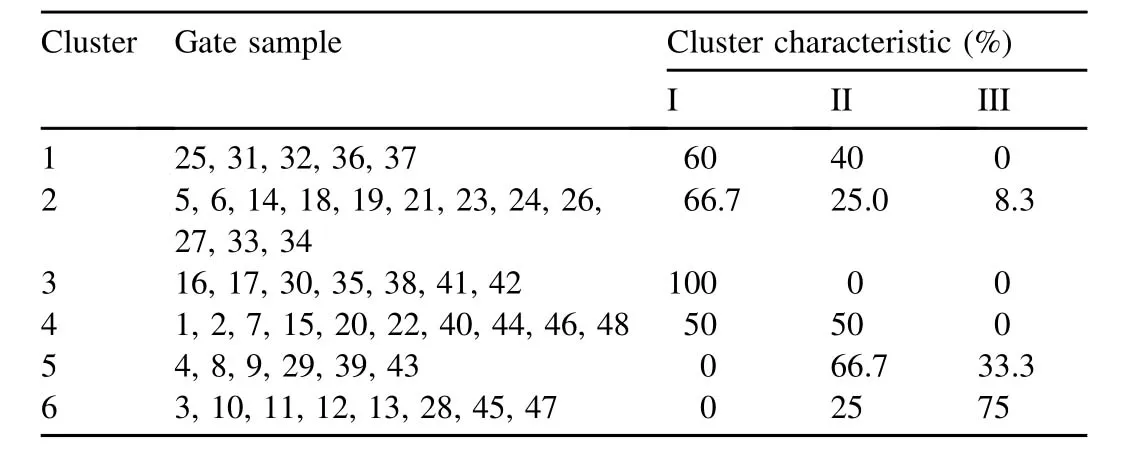
Table 8 Clustering results according to all indices.
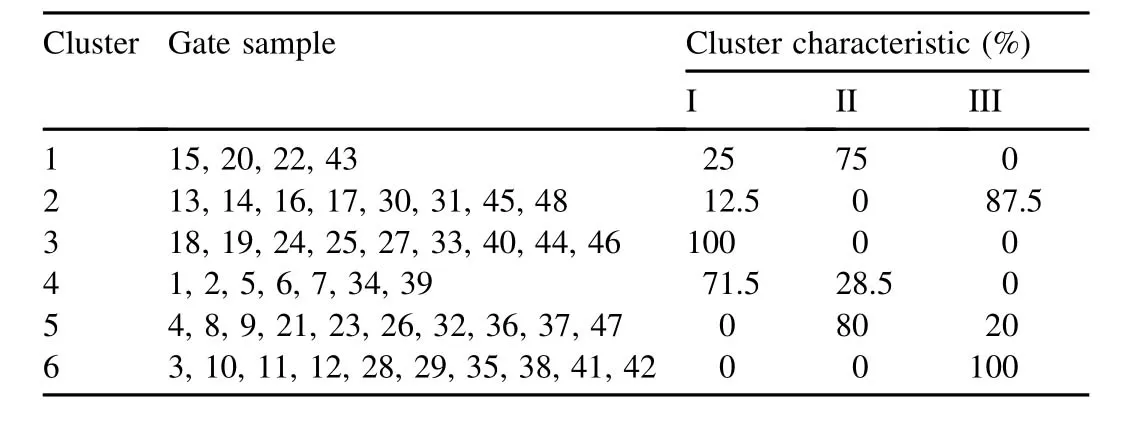
Table 9 Clustering results according to important indices.
(2)Through tests of the consistency of indices with association rules,the users pay attention to the tests,and verify the testing results when the testing grades of indices in weak association rules are inconsistent,which can reduce the interference of human factors.This study shows that when the testing grades of indices in the weak association rules are inconsistent,the testing grades of indices are more likely to be erroneous.Usually,the errors are caused by human factors.
(3)We analyzed the reliability of diagnoses,and obtained different clusters by clustering the historical records.According to the characteristics of data records in the cluster,we could evaluate the reliability of diagnoses,or perform health diagnoses directly.This study shows that the clustering results are related to the indices selected.Choosing significant testing indices makes the characteristics of clustering results more apparent,and the analysis or diagnosis results more credible.
(4)Based on data mining technology,we diagnosed the health status of hydraulic metal structures,verified the index parameters,and analyzed the diagnosis conclusion,which makes the diagnosis process more scientific,and the diagnosis conclusion more reasonable and reliable.The indices and diagnosis analysis function in this study provide a necessary theoretical foundation and new ideas for the development of hydraulic metal structure health diagnosis technology.
References
Cover,M.,Thomas,A.,Thomas,J.,2003.Element of Information Theory.Tsinghua University Press,Beijing (in Chinese).
Han,J.W.,Kamber,M.,2006.Data Mining: Concepts and Techniques,2nd ed.China Machine Press,Beijing (in Chinese).
Hu,B.G.,He,R.,Yuan,X.T.,2012.Information-theoretic measures for objective evaluation of classifications.Acta Autom.Sin.38(7),1169e1182.http://dx.doi.org/10.3724/SP.J.1004.2012.01169.
Li,H.N.,Yi,T.H.,Ren,L.,Li,D.S.,Huo,L.S.,2014.Reviews on innovations and applications in structural health monitoring for infrastructures.Struct.Monit.Maint.1(1),1e45.http://dx.doi.org/10.12989/smm.2014.1.1.001.
Li,X.F.,Li,J.,2003.Data Mining and Knowledge Discovery.Higher Education Press,Beijing (in Chinese).
Liang,X.,2006.Data mining: modeling,algorithms,applications and systems.Comput.Technol.Dev.16(1),1e4 (in Chinese).
Lou,L.F.,Jiang,Z.F.,Tian,S.Z.,2003.Studying on the influence factor of interestingness of association rules in data mining.Comput.Eng.Appl.6,190e192 (in Chinese).
Ma,H.,2009.Objective weight method in comprehensive evaluation system.Coop.Econ.Sci.17,50e51 (in Chinese).
Mao,G.J.,Duan,L.J.,Wang,S.,Shi,Y.,2007.Data Mining Principles and Algorithms,2nd ed.Tsinghua University Press,Beijing (in Chinese).
Patev,R.C.,Putcha,C.S.,2005.Development of fault trees for risk assessment of dam gates and associated operating equipment.Int.J.Model.Simul.25(3),190e195.http://dx.doi.org/10.2316/Journal.205.2005.3.205-4342.
Qi,D.J.,Hu,H.Y.,2014.Design and realization on the financial early-warning analysis system of colleges and universities based on data mining technology.Appl.Mech.Mater.623,229e233.http://dx.doi.org/10.4028/www.scientific.net/AMM.623.229.
Sha,C.F.,2008.Some Data Mining Algorithms Based on Information Theory.Ph.D.Dissertation.Fudan University,Shanghai (in Chinese).
Su,Z.D.,You,F.C.,Yang,B.R.,2004.Comprehensive evaluation method of association rules and a practical example.Comput.Appl.24(10),17e20 (in Chinese).
Xiang,Y.,Wu,Z.R.,Fu,Z.M.,2003.Application of data mining technology in dam safety decision support system.Water Power 29(1),20e23 (in Chinese).
Yang,G.M.,2011.Research to safety evaluation expert system of hydraulic engineering metal structures.Appl.Mech.Mater.48e49,994e1001.http://dx.doi.org/10.4028/www.scientific.net/AMM.48-49.994.
Yang,G.M.,Jia,W.B.,2011.Research to health diagnose model of gate and hoist machinery based on AHP.Adv.Mater.Res.287e290,3036e3042.http://dx.doi.org/10.4028/www.scientific.net/AMR.287-290.3036.
Yang,G.M.,2012.Theory and Methods of Health Comprehensive Diagnosis on Hydraulic Metal Structures.Ph.D.Dissertation.Hohai University,Nanjing (in Chinese).
Yang,G.M.,Gu,C.S.,Huang,Y.,Yang,K.,2014.BP neural network integration model research for hydraulic metal structure health diagnosing.Int.J.Comput.Intell.Syst.7(6),1148e1158.
Yang,G.M.,Jing,P.D.,2014.FAHP weight method for hydraulic metal structure health diagnosis.Inf.Technol.J.13(11),1819e1824.http://dx.doi.org/10.3923/itj.2014.1819.1824.
Zhu,K.,2014.Applying data mining technology to solve the problem of traffic: a case study.J.Simul.2(4),214e217.
Zhu,Z.H.,Zheng,D.J.,Zhang,X.H.,2007.Application of Chaos-data mining model in dam safety prediction.J.Yangtze River Sci.Res.Inst.24(5),34e37 (in Chinese).
 Water Science and Engineering2015年2期
- Water Science and Engineering的其它文章
- Water requirement pattern for tobacco and its response to water deficit in Guizhou Province
- Effects of leachate infiltration and desiccation cracks on hydraulic conductivity of compacted clay
- Receptivity of plane Poiseuille flow to local micro-vibration disturbance on wall
- Degradation of bisphenol A using electrochemical assistant Fe(II)-activated peroxydisulfate process
- Distribution and release of 2,4,5-trichlorobiphenyl in ice
- Effects of benthic algae on release of soluble reactive phosphorus from sediments: a radioisotope tracing study
