Isolation and characterization of a degradation product in leflunomide and a validated selective stability-indicating HPLC-UV method for their quantification
Balraj Saini,Gulshan Bansal
Department of Pharmaceutical Sciences and Drug Research,Punjabi University,Patiala 147002,India
SHORT COMMUNICATION
Isolation and characterization of a degradation product in leflunomide and a validated selective stability-indicating HPLC-UV method for their quantification
Balraj Saini,Gulshan Bansal✽
Department of Pharmaceutical Sciences and Drug Research,Punjabi University,Patiala 147002,India
Leflunomide;
Characterization;
Forced degradation;
Degradation product;
HPLC-UV
Leflunomide(LLM)is subjected to forced degradation under conditions of hydrolysis, oxidation,dry heat,and photolysis as recommended by International Conference on Harmonization guideline Q1A(R2).In total,four degradation products(I-IV)were formed under different conditions. Products I,II and IV were formed in alkaline hydrolytic,acidic hydrolytic and alkaline photolytic conditions.LLM and all degradation products were optimally resolved by gradient elution over a C18column.The major degradation product(IV)formed in hydrolytic alkaline conditions was isolated through column chromatography.Based on its1H NMR,IR and mass spectral data,it was characterized as a British Pharmacopoeial impurity B.The HPLC method was found to be linear,accurate,precise, sensitive,specific,rugged and robust for quantification of LLM as well as product IV.Finally,the method was applied to stability testing of the commercially available LLM tablets.
©2015 Xi’an Jiaotong University.Production and hosting by Elsevier B.V.All rights reserved.This is an open access article under the CC BY-NC-ND license(http://creativecommons.org/licenses/by-nc-nd/3.0/).
1. Introduction
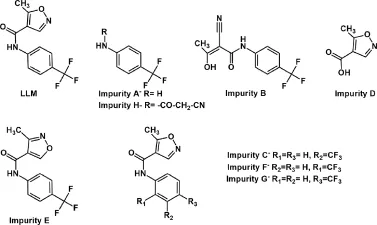
Leflunomide(LLM),5-methyl-N-(4-(trifluoromethyl)phenyl)isoxazole-4-carboxamide(Fig.1),is a pyrimidine synthesis inhibitor belonging to disease-modifying antirheumatic drugs.It is used to relieve joint inflammation and pain in rheumatoid arthritis[1].It is official in British Pharmacopoeia(BP)wherein eight impurities are reported in its monograph(Fig.1)[2].International Conference on Harmonization (ICH)guideline Q1A(R2)requires characterization of all degradation products formed during forced degradation of a drug substance under varied chemical environments like hydrolysis,oxidation,dry heat and photolysis[3].A few HPLC and LC-MS methods are reported in literature for determination of LLM,and its active metabolite[4-6]. A few specific stability-indicating HPLC methods for LLM are also available in literature[7,8].In addition,one method is known for determination of its related substances[9].However,none of these reported studieshaveattempted to isolateand/orcharacterizedegradation products of LLM.Moreover,no method has afforded simultaneous quantification of LLM and its degradation product(s).In the present study,we(i)conducted systematic forced degradation study on LLM under the ICH prescribed conditions,(ii)isolated and characterized a degradation product,and(iii)developed and validated a simple,sensitive and selective stability-indicating RP-HPLC-UV method for simultaneous quantification of LLM and the isolated degradation product.
✽Corresponding author.Tel.:+91 175 3046255;fax:+91 175 2283073.
E-mail addresses:gulshanbansal@rediffmail.com, gulshanbansal@gmail.com(G.Bansal).
Peer review under responsibility of Xi’an Jiaotong University.
http://dx.doi.org/10.1016/j.jpha.2014.10.003
2095-1779©2015 Xi’an Jiaotong University.Production and hosting by Elsevier B.V.All rights reserved.This is an open access article under the CC BYNC-ND license(http://creativecommons.org/licenses/by-nc-nd/3.0/).

Fig.1 Structures of leflunomide and its pharmacopoeial impurities.
2. Experimental
2.1. Drug and chemicals
LLM was procured from Cadila Healthcare Ltd.(Goa,India)as a generous gift sample.Sodium hydroxide(NaOH),hydrochloric acid(HCl),hydrogen peroxide(H2O2,30%)and anhydrous ammonium acetate were purchased from Loba Chemical Pvt.Ltd. (Mumbai,India).Methanol and acetic acid(HPLC grade)were purchased from Merck Specialist Pvt.Ltd.(Mumbai,India).HPLC grade water was obtained from Direct Ultra water purification system(Bio-Age Equipment and Services,SAS Nagar,India)in the laboratory.LLM tablets(Lefumide-10,Batch No.J95242,Cipla Ltd.,Goa,India)were purchased from a local pharmacy store.
2.2. Equipments
Hydrolytic and thermal forced degradations were carried out in high precision water bath and a hot air oven equipped with digital temperature control capable of controlling temperature within a range of±1°C and±2°C(Narang Scientific Works,New Delhi, India).Photo-degradation was carried out in a photostability chamber(KBF 240,WTB Binder,Tuttlingen,Germany)capable of controlling temperature and relative humidity(RH)within a range of±2°C and±5%.The chamber was equipped with an illumination bank of light source as described in Option 2 in the ICH guideline Q1B[10],and was set at a temperature of 25°C and 55%RH.The forced degradation samples were analyzed on a Waters HPLC system consisting of binary pumps(515),dual wavelength detector(2487)and Rheodyne manual injector(Milford,MA,USA).The data were acquired and processed in Empower2software.The chromatographicseparationwas achieved on Kromasil C18(250 mm×4.6 mm;5 μm)column. LC-MS-TOF studies were carried out in positive mode of electrospray ionization(+ESI)on micrOTOF-Q mass spectrometer(BrukerDaltonics GmbH,Germany)controlled by microTOF control software ver.2.0.The LC components comprised Agilent 1100 series LC system(Agilent Technologies Inc., CA,USA),controlled by Hystar(Ver.3.1)software.The column in LC-MS study was the same as that used for LC-UV study.For characterization of product IV of LLM,the1H NMR spectra were recorded on a Bruker FT-NMR spectrophotometer(Bruker India Scientific Pvt.Ltd.,New Delhi,India,400 MHz)in DMSO-d6. Chemical shifts were reported in ppm(δ)relative to tetramethylsilane as an internal standard.FT-IR spectra were recorded using KBr disc with FTIR-spectrophotometer(Perkin Elmer,England).
2.3. Forced degradation study
For hydrolytic degradation,about 0.1 g of LLM was mixed separately with 100 mL of water,HCl solutions of varied strengths(0.1,1,2 and 5 M),and 0.1 M NaOH solution in volumetric flasks.Each flask was placed in the high precision water bath maintained at 85°C for 8 h. For oxidative degradation,about 0.1 g of LLM was dispersed in 100 mL of 30%H2O2and placed at room temperature under dark for 24 h.Thermal degradation was carried out on solid LLM sealed in amber colored vials at 50°C for 30 days.For photolytic degradation, 2 mL of a 0.1%(w/v)solution of LLM in acetonitrile was mixed separately with 3 mL of water,0.1 M HCl and 0.1 M NaOH in transparent glass vials.These vials as well as the solid drug,spread as a thin layer,in a petri-dish,were exposed to the light in the photostability chamber.The samples were placed at a distance of about 23 cm from the light source for 14 days during which the total UV and white light exposure equaled about 200 Wh/m2and 1.2 million lx h,respectively.A parallel set of solid drug and drug solutions was kept in dark under the same temperature and humidity for the same period of time to serve as dark control.
2.4. HPLC method and sample preparation
LLM and its degradation products were optimally resolved on a Kromasil C18(250 mm×4.6 mm,5 μm)column at ambient temperature(30°C)with methanol(mobile phase A)and ammonium acetate(pH 5.0,10 mM)(mobile phase B)flowing at a rate of 0.7 mL/min in gradient mode(0-21 min,A:B;25:75%→21-22 min,A:B from 25:75%to 60:40%→22-50 min,A:B; 60:40%→50-51 min,A:B from 60:40%to 25:75%,51-55 min, A:B;25:75%).The injection volume and detection wavelength were fixed at 20 μL and 260 nm,respectively.Each degraded drug solution was diluted up to 10 times with a diluent.The acid and alkali hydrolyzed solutions were neutralized before dilution.The
solid drug samples exposed to thermal and photolytic conditions were rendered into solutions(1 mg/mL)in a diluent before dilution.
2.5. LC-MS-TOF studies
The chromatographic conditions for the LC-MS-TOF study were the same as those for the HPLC method.The LC-MS-TOF study was carried out using+ESI,-ESI and APCI modes of ionization with dry heat temperature of 180°C,capillary voltage of 4.8 kV, end plate offset voltage of-500 V,collision cell RF of 280.0 Vpp and nebulizer set at 1.2 Bar.The dry gas flow was set at 6.0 L/min. The data were recorded at ionization potentials of 10 and 15 V.
2.6. Isolation and characterization of product IV of LLM
Product IV was formed as a major degradation product,and it was isolated through normal phase column chromatography.For its generation,LLM(1.0 g)in 1 M NaOH in a 100 mL volumetric flask was heated at 85°C.The solution was cooled to room temperature,neutralized with HCl solution,and extracted with ethyl acetate.The organic layer was dried over anhydrous sodium sulfate,and the solvent was recovered under reduced pressure to obtain a solid mass.The latter was chromatographed over a column of silica gel with dichloromethane and methanol in gradient mode.The elution was started with 100%dichloromethane.Polarity of the eluent was increased stepwise by methanol with its 1%increment at a time,i.e.,using mobile phase composed of a mixture of dichloromethane and methanol in ratios of 99:1 followed by 98:2,97:3,and so on going up to 90:10.The column was run with a minimum of 100 mL of each mixture of this mobile phase or till the analyte continued to elute with a particular mixture.The fractions containing product IV were pooled,and the solvent was recovered under reduced pressure. The solid residue so obtained was characterized through IR,1H NMR and mass spectral analyses.
2.7. Method validation
The method was validated in accordance with ICH guideline Q2 (R1)for both LLM and product IV[11].Linearity was established by plotting calibration curves(n=3)using standard solutions of LLM and product IV in concentration range of 0.1-100 μg/mL in methanol.Intra-day precision was determined by analyzing(n=6) each of the three concentrations of LLM(0.1,1.0 and 10 μg/mL) and product IV(0.5,5 and 20 μg/mL)on the same day.Inter-day precision was evaluated by analyzing the same three concentrations on three different days.Method accuracy was evaluated as percent recovery(n=3)of three different concentrations of LLM and product IV from a degraded drug solution.Selectivity and specificity of the method towards LLM and its degradation products were established through study of resolution factor of each peak from the nearest resolving peak.LOD and LOQ were determined by the calibration curve method[11].Subsequently, drug solutions of concentrations equal to the calculated LOD and LOQ were prepared and analyzed(n=10).Robustness of the method was determined by making small but deliberate changes in various chromatographic parameters of the optimized method. Standard solutions of LLM and product IV(10 μg/mL)were analyzed (n=3)ateach varied chromatographiccondition. Recovery of LLM was calculated,and the change in retention time(RT)was noted vis-à-vis the optimized chromatographic conditions.
2.8. Stability study of LLM tablets
A blister pack of LLM tablets(Lefumide-10,label claim of 10 mg per tablet)was stored at 4°C to serve as control.Each of the three strips of tablets was placed in a hot air oven(50±2°C)for one month,and in photolytic chamber as well as in dark for 14 days.A strip was also placed at room temperature(30±3°C)for one year. Solutions of tablets from each stability condition were prepared as follows:all 10 tablets from each blister pack were weighed, crushed and powdered separately.Tablet powder equivalent to 10 mg of LLM was suspended in 5 mL of methanol in a 10 mL volumetric flask.The contents were sonicated for 5 min,allowed to cool to room temperature,and the volume was made up with methanol.Each of the stock solutions was diluted with methanol to achieve a drug concentration of 10 μg/mL,and analyzed by the validated stability-indicating HPLC method.The drug content was calculated as mg per tablet.
3. Results and discussion
3.1. Forced degradation behavior
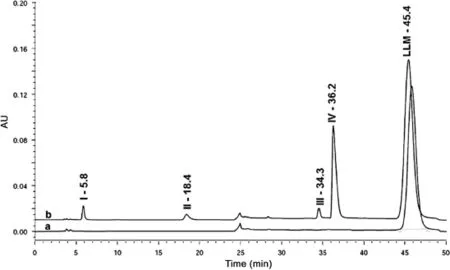
HPLC method as reported by Yeniceli et al.[5]was modified to resolve LLM and all its degradation products in a single run. No impurity was detected in LC-UV chromatogram of standard solution of LLM(Fig.2).LLM degraded to three products(I,II and IV)in 0.1 M NaOH(Fig.2)and one minor product(III)in 5 M HCl.Products I,II and IV were also detected as minute peaks in alkaline medium under photolytic condition,which suggested that LLM was stable to photo-degradation,and its degradation in alkaline medium was dependent upon temperature.The drug remained stable in solution to hydrolysis in water,to photolysis in acid and in water,to oxidation,and in solid state to thermal and photolytic degradation.Hence,based on these results,the drug is found susceptible to acidic and alkaline hydrolytic conditions.
3.2. Isolation and characterization of degradation product

Fig.2 Chromatogram of standard solution of leflunomide(LLM)(a),and of LLM solution subjected to degradation under acid and alkaline hydrolysis(b).

Table 1 1H NMR and IR data for LLM and product IV.
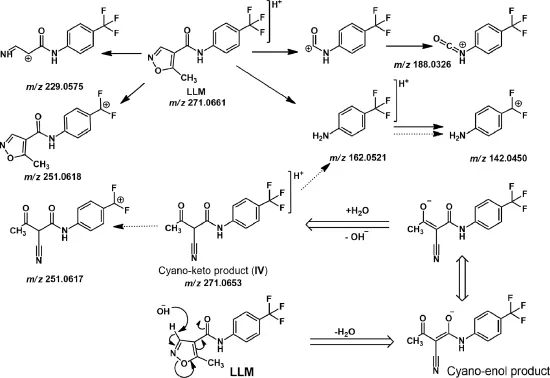
In order to characterize the degradation products(I-IV),a degraded drug sample was analyzed on LC-MS-TOF using+ESI, -ESI and APCI techniques,but none of the degradation products was ionized by any of these techniques.Hence,the degraded sample was eluted by column chromatography wherein product IV was eluted with a mixture(93:7)of dichloromethane and methanol.No other product was isolated probably due to their low content in the sample.Product IV was isolated as white needle-shaped crystals,and its purity was found to be 98.7%as determined by HPLC analysis.1H NMR spectrum of product IV showed all signals similarly as noted in that of LLM(Table 1 and Supplementary Fig.1).The only difference was that a signal at δ 9.06 due to-N=CH-proton was absent,and a new signal at δ 5.47 appeared in the spectrum of product IV.It revealed that although p-disubstituted phenyl ring,amide linkage and methyl groups were present in product IV similar to LLM,the isoxazole ring might have undergone some chemical change(s)under alkaline hydrolytic conditions,which wasresponsible forthe disappearance of the signal at δ 9.06 and the appearance of the signal at δ 5.47.Literature reports on chemical reactivity of isoxazole have revealed that isoxazole undergoes ring opening to generate a cyano-substituted enol product[12].Based on these reports,product IV was proposed to be a cyano-enol product (Fig.3).Further,due to keto-enol tautomerism,the cyano-enol product IV can tautomerize to a cyano-keto product IV(Fig.3). In general,keto form is more stable,and it is also known that keto form predominates over enol form in an alkaline medium[13]. Hence,product IV was proposed to be a cyano-keto product. Conversion of LLM to cyano-keto product was supported by a comparative analysis of IR spectra of LLM and product IV.The IR spectrum of product IV showed vibrational bands at 2220 cm-1, which is a characteristic of-CN group,and a broad strong intensity band at 1700-1500 cm-1,which is a characteristic of-C=O group (Table 1 and Supplementary Fig.2)[14]. The other vibrational bands were noted similarly as in IR spectrum of LLM.The additional signal at δ 5.47 amounting to one proton in1H NMR spectrum of product IV vis-á-vis LLM was attributed to the methine proton flanked by a cyano and two carbonyl groups. Based on these IR and1H NMR spectral data,and known behavior of isoxazole ring in alkaline medium,product IV was proposed to be 2-cyano-3-oxo-N-[4-(trifluoromethyl)phenyl]butanamide, which is incidentally mentioned as impurity B in BP(Fig.1). Finally,MS-TOF spectrum of product IV showed its[M+H]+(parent)ion at m/z 271.0653,which matched very closely with theoretical accurate mass of parent ions of product IV as well as LLM.The fragment ions noted in MS-TOF spectrum of product IV were also noted in that of LLM(Fig.3 and Supplementary Fig.3).
3.3. Method validation

Fig.3 Proposed mass fragmentation pattern of LLM(→)and product IV(),and mechanisms of LLM degradation(⇒).

Table 2 Accuracy and precision for LLM and product IV.
The method was linear for quantification of LLM and product IV in the concentration ranges of 0.1-10 μg/mL and 0.5-50 μg/mL, respectively.The mean(±SD)slope,intercept and correlation coefficient for LLM were found to be 4397.7(±46.785),59.8 (±46.8),and 0.9999(±0.001),respectively,whereas those for product IV were 0.616(±0.002),0.102(±0.03),and 0.9996 (±0.001),respectively.The LOD and LOQ were found to be 0.03 and 0.11 μg/mL,respectively,with relative standard deviation(RSD)values of 1.15%and 1.27%for LLM.The LOD and LOQ for product IV were 0.16 and 0.49 μg/mL,respectively, with RSD of 1.89%and 1.01%.Good-to-excellent recoveries of LLM(97.2-100.4%)and product IV(99.99-100.90%)at each fortification level were achieved with RSD less than 1.1% (Table 2).It suggested that the method was sufficiently accurate for quantification of LLM and product IV.The method was found to be sufficiently precise with RSD for inter-day and intra-day precision being less than 1.7%(Table 2).No significant variation in the calculated concentrations of LLM and product IV was observed on any day.It suggested that the method was sufficiently precise for determination of LLM and product IV. The method was found to be robust as%change in the calculated content,and change in RT of LLM and product IV was not significant(<5%)after deliberate changes in the method variables including detection wavelength,composition of mobile phase,pH of mobile phase,flow rate and column.Further,LLM and product IV peaks were resolved from their nearest peak with a resolution factor of>2,which established the method to be selectively stability-indicating.
3.4. Stability testing of LLM tablets
The method was applied successfully to stability testing of LLM tablets.No significant change in the content of LLM in the tablets exposed to varied conditions was noted.The drug peak in all stability samples was found to be pure and no additional peak was noted in any chromatogram.Hence,the tablets were found to be stable under all stability conditions.
4. Conclusion
LLM was subjected to various ICH prescribed forced degradation conditions.It was found to be unstable under alkaline hydrolytic, acid hydrolytic,and alkaline photolytic conditions but stable under all other conditions.An HPLC method was developed to resolve LLM and all its degradation products in a single run.The major degradation product(IV)formed upon alkaline hydrolysis was
isolated through column chromatography,and was characterized through spectral analysis as a known impurity reported in BP. The method was validated by evaluating various validation parameters like linearity,precision,robustness and accuracy.The method was applied successfully for stability testing of commercially available LLM tabletsundervaried ICH prescribed conditions.
Acknowledgments
The authors are thankful to Cadila Healthcare Ltd.(Goa,India) for providing LLM as a generous gift sample,and to Prof.Saranjit Singh,Head,Department of Pharmaceutical Analysis,National Institute of Pharmaceutical Education and Research(SAS Nagar, India)for extending the facilities for photostability studies.The authors are also thankful to University Grants Commission,New Delhi,India,for providing financial assistance to carry out the study(F.No.:37-323/2009(SR)).
Appendix A. Supporting information
Supplementary data associated with this article can be found in the online version at http://dx.doi.org/10.1016/j.jpha.2014.10.003.
[1]Immunosuppressive chemotherapy,in:C.S.Foster,A.T.Vitale (Eds.),Diagnosis and Treatment of Uveitis,Jaypee Brothers Medical Publishers(P)Ltd.,New Delhi,2013,pp.238-294.
[2]British Pharmacopoeia Commission,British Pharmacopoeia,The Stationery Office,London,2012,p.1099.
[3]ICH,Stability Testing of New Drug Substances and Products Q1A (R2),2003〈http://www.ich.org/fileadmin/Public_Web_Site/ICH_Pro ducts/Guidelines/Quality/Q1A_R2/Step4/Q1A_R2__Guideline.pdf〉(accessed 12.08.14).
[4]K.Sobhani,D.A.Garrett,D.P.Liu,et al.,A rapid and simple highperformance liquid chromatography assay for the leflunomide metabolite,teriflunomide(A77 1726),in renal transplant recipients,Am.J. Clin.Pathol.133(2010)454-457.
[5]D.Yeniceli,D.Dogrukol-AK,M.Tuncel,Determination of leflunomide in tablets by high performance liquid chromatography,J.Pharm. Biomed.Anal.40(2006)197-201.
[6]N.Sultana,M.S.Arayne,M.M.Khan,et al.,Development of liquid chromatography-UV method for simultaneous determination of leflunomide and NSAIDS in API and pharmaceutical formulations: its application to in vitro interaction studies,Med.Chem.3(2013) 262-270.
[7]G.J.Kher,V.R.Ram,K.L.Dubal,et al.,Validation of a stabilityindicating method for assay of leflunomide in tablets and for determination of content uniformity,Int.J.Chem.Tech.Res.3 (2011)523-530.
[8]D.S.Shokry,M.A.Kawy,S.A.Weshahy,Application of spectrophotometric and chromatographic methods for stability indicating determination of leflunomide,J.Appl.Sci.Res.8(2012)1547-1557.
[9]M.Giorgis,M.L.Lolli,B.Rolando,et al.,1,2,5-Oxadiazole analogues of leflunomide and related compounds,Eur.J.Med.Chem. 46(2011)383-392.
[10]ICH,Stability Testing:Photostability Testing of New Drug Substances and Products Q1B,1996〈http://www.fda.gov/downloads/ Drugs/GuidanceComplianceRegulatoryInformation/Guidances/ ucm073373.pdf〉(accessed 12.08.14).
[11]ICH,Validation of Analytical Procedures:Text and Methodology Q2 (R1),2005〈http://www.ich.org/fileadmin/Public_Web_Site/ICH_Pro ducts/Guidelines/Quality/Q2_R1/Step4/Q2_R1__Guideline.pdf〉(accessed 12.08.14).
[12]A.S.Kalgutkar,H.T.Nguyen,A.D.N.Vaz,et al.,In vitro metabolism studies on the isoxazole ring scission in the anti-inflammatory agent leflunomide to its active-cyanoenol metabolite a771726:mechanistic similarities with the cytochrome p450-catalyzed dehydration of aldoximes,Drug Metab.Dispos.31(2003)1240-1250.
[13]R.T.Morrison,R.N.Boyd,Organic Chemistry,sixth ed.,Pearson Education,New Delhi,2002.
[14]R.M.Silverstein,F.X.Webster,Spectrometric Identification of Organic Compounds,sixth ed.,Wiley,New York,1998.
Received 14 May 2014;revised 26 September 2014;accepted 10 October 2014 Available online 22 October 2014
 Journal of Pharmaceutical Analysis2015年3期
- Journal of Pharmaceutical Analysis的其它文章
- Non-covalent binding analysis of sulfamethoxazole to human serum albumin:Fluorescence spectroscopy,UV-vis,FT-IR,voltammetric and molecular modeling
- Determination of diclofenac in pharmaceutical preparations by voltammetry and gas chromatography methods
- Comparison of conventional and supported liquid extraction methods for the determination of sitagliptin and simvastatin in rat plasma by LC-ESI-MS/MS
- Quality evaluation of synthetic quorum sensing peptides used in R&D
- Extraction,characterization and biological studies of phytochemicals from Mammea suriga
- Liquid chromatography-tandem mass spectrometry method for the estimation of adefovir in human plasma:Application to a pharmacokinetic study
