Structural Strength Degradation Model Based on Non-stationary Gamma Process
SUN Dao-ming (孙道明),AN Zong-wen (安宗文)
School of Mechatronics Engineering,Lanzhou University of Technology,Lanzhou 730050,China
Introduction
Fatigue failure is a process with increasing damage and strength degradation of the part or link under cyclic loading.The strength degradation mentioned above will directly lead to the decrease of reliability and safety of the structure.So,it is necessary to further investigate the strength degradation law of structural material.
The strength degradation of structural material is always a stochastic process as it is affected by many random factors such as stress and external environment.It is also an irreversible process because the strength can't recover under the action of external loading.Gamma process is a stochastic process with monotone increasing pattern and it is a natural selection to describe the degradation process[1].Wu et al.built a model with measurement data based on Gamma process and attained the degradation law of performance[2].An et al.extracted the information about strength degradation through P-S-N curve which characterized the fatigue performance of structural material and established a stochastic strength degradation model[3].It is irrational to assume that the strength degradation trend is linear as it may violate the fact.Si et al.pointed out that the propagation of fatigue crack was a non-stationary process which had much relation with strength degradation of structural material[4].In recent years,a lot of attention is paid to the research of strength degradation of structural material.Lü et al.built a continuous nonlinear strength degradation model of structural material according to the characteristics of the fatigue damage process and it was verified through the analysis of strength degradation of 16Mn steel[5].Li et al.pointed out that the power law proposed by Schaff was more suitable for describing strength degradation law of structural material through the analysis of test data of 35CrMo steel[6].Sun et al.also pointed out that the strength degradation at a certain time was in proportion to the power of time under general circumstance[7].Wu et al.emphasized that empirical studies showed that strength degradation law could be described by power law[8].The literature mentioned above indicates that it is more reasonable to choose power law to describe strength degradation law.So,the power law is chosen to characterize strength degradation law based on the preliminary work[3].The stochastic strength degradation model built based on the nonstationary Gamma process can accurately reflect the strength degradation law,which provides a solid foundation for the reliability analysis of structural material.
1 Gamma Degradation Process
Under the cyclic loading,strength degradation of structural material is a monotone increasing process.Gamma process is a stochastic process with independent,non-negative increments.Gamma process is a natural model for the degradation process in which the degradation is supposed to take place gradually over time in a sequence of tiny positive increments.It is widely used in modeling degradation process.Van Noortwijk et al.presented an excellent review on the Gamma process in the context of maintenance[9].In their review,the rich theoretical aspects of the Gamma processes were reviewed as well as successful maintenance applications.
The Gamma process{X(t),t ≥0}with the shape function α(t)> 0 and scale parameter λ > 0 is a continuous-time stochastic process with independent Gamma-distributed increments.
If a random variable X ~Ga(α,λ),then its probability density function is given by:

where IA(x)= 1 for x ∈A and IA(x)= 0 for x ∉A;anddt is a Gamma function and e is the base number of natural logarithm function.
Let X(t)represent the strength degradation at time t,t ≥0,and let α(t)be a non-decreasing,right continuous,and real valued function for t ≥0 with α(0)= 0.The Gamma process is a continuous-time stochastic process {X(t),t ≥0}with the following properties:
(1)P{X(0)= 0}= 1;
(2)X(t2)-X(t1)~Ga(α(t2)-α(t1),λ)for all t2>t1≥0;
(3)X(t)has independent increments.
Let the probability density function of X(t),in conformity with the definition of the Gamma process,be given by

Its expectation and variance are given by

As depicted in Fig.1,actually,the strength degradation rate of structural material may increase,keep invariant or decrease over time.

Fig.1 Strength degradation trend
The assumption that strength degradation of structural material is linearly dependent on time is limited and can't reflect the actual strength degradation law.As mentioned above,empirical studies show that strength degradation obeys the power law.The power law is a general model which contains the linear one.The linear model is just a special case of the proposed power law.Here,let α(t)= atb,where a >0,b >0.Then the expectation and variance of X(t)are given by

2 Non-stationary Gamma Process-Based Strength Degradation Model
P-S-N curve is stress-number of stress cycles to failure with a specified survival probability,also called probability fatigue life curve.P-S-N curve of structural material is got with the test program using approximately 15 specimens at each of the four or five constant cyclic stress levels.As shown in Fig.2,P-S-N curve is given in the double logarithmic coordinate system.The curves in Fig.2 give three types of information[10]:(1)the distribution of fatigue life (N)under certain fatigue strength(S);(2)the distribution of fatigue strength (S)under certain fatigue life (N);(3)the distribution of fatigue limit under infinite fatigue life.

Fig.2 P-S-N curve
The fatigue test data and P-S-N curve can be obtained according to Mechanical Engineering Material Performance Data Manual[11].The equation of P-S-N curve is given by where S represents the stress amplitude,β and C are two constants related to material property,shape of samples and the way of loading.

An et al.established a relationship between the number of stress cycles (N)and time (t)[3],given by Eq.(8).Then PS-N curve is converted into P-S-t curve by substituting N in Eq.(7)with Eq.(8).After transformation of the equation,S-t relation is given by Eq.(9).

where t represents the time and N represents the number of stress cycles.
P-S-t curve indicates the information of strength degradation of structural material.Then a strength degradation model is built based on a non-stationary Gamma process and the parameters of the model are estimated with the implicit information from the P-S-t curve.
Assume there are m curves in P-S-N curve,and Δ Xijrepresents the strength degradation on the time interval[tj,tj+1]and with a specified survival rate Pi.The computation formula is as follows:

According to property (2) of Gamma process,the distribution of ΔXijis given by

Replace the parameter α(t)in Expression (11)with α(t)= atb,the distribution now becomes:

Then substitute the parameters of Gamma process in Eq.(1)with the given parameters in Eq.(12),and the probability density function of ΔXijis given by

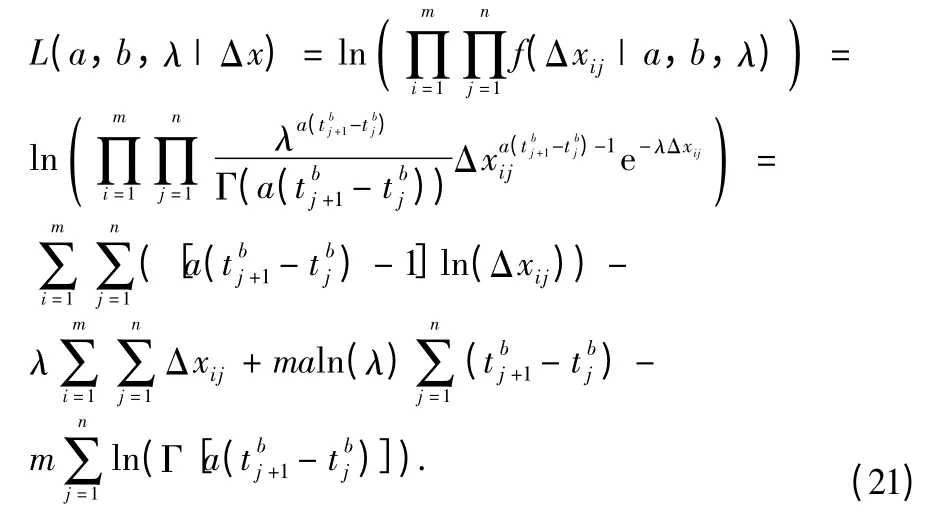
Take logarithm on both sides of Eq.(13)to simplify the computation.Therefore,the log-likelihood function is in the form of

The maximum likelihood estimator of model parameters is the value that maximizes L(a,b,λ | Δ x).Now the question becomes

The estimated values of parameters,,andcan be solved through genetic algorithm implemented by MATLAB software.
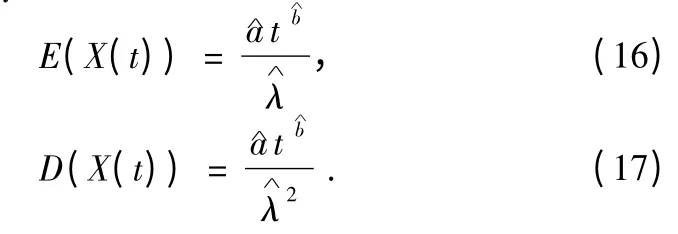
Then substitute the corresponding parameters in Eqs.(5)and (6)with,,and,then the expectation and variance of X(t)are given by

3 Example
The 20CrMnTi steel is one of the commonly used materials in the mechanical industry.By looking up the Mechanical Engineering Material Performance Data Manual[11],the test conditions and test data of the contact fatigue of 20CrMnTi are shown below.
(1)Test conditions are as follows.Rectangular samples are heated and carburized at 920 ℃,then cooled in oil.Next,the samples are tempered at 200 ℃for 2 h,then cooled in air.The test is done with JPM-1 fatigue testing machine (Yichang Testing Machine Factory,Hubei,China).
(2)The estimated values of the parameters of P-S-N curve are shown in Table 1.
(3)P-S-N curve is shown in Fig.3.

Table 1 Parameters estimation of P-S-N curve for 20CrMnTi steel(N = C·S -β)

Fig.3 P-S-N curves of 20CrMnTi steel
The rotation speed of fatigue test machine is 2 000 r/min.The unit of rotation speed,r/min,is converted into r/h.In Ref.[3],the relationship between the number of stress cycles N and time t is established given by Eq.(18).Then substitute N in Eq.(7)with Eq.(18),and P-S-t curve is given in Eq.(19).

Next,plug Eq.(19)into Eq.(20),and the computation formula of ΔXijis as follows

where i = 1,2,…,m;j = 1,2,…,n,m = 4.Let tj= 10j,time interval be[tj,tj+1](j = 1,2,…,9),n = 9.Then substitute the variables Δ Xijand tjin Eq.(14)with the calculated results above.The log-likelihood function is given by

Plug Eq.(21)into Eq.(15),and then the estimated values of model parameters,,andare obtained by solving a non-linear optimization problem through genetic algorithm implemented by MATLAB software.The estimated results are:= 1.628,= 0.520,and= 0.047.
Replace the corresponding parameters in Eq.(16)with the estimated values above.The expectation of X(t)is given by

The former expectation of X(t)in Ref.[3]is as follows

In order to compare the results obtained under different assumptions,these two curves are drawn in the same figure as Fig.4 shows.

Fig.4 Comparative drawing of the mean of degradation
(1)According to Eq.(19),the strength degradation amount decreases over time within the same length of time interval.It is obvious that the new model can reflect this property while the former can't reflect this property as can be seen in Fig.4.
(2)Figure 4 shows that strength degradation amount of the linear one is conservative compared with the new model proposed in this article.But,two curves tend to be parallel as time goes,which means that strength degradation rates are nearly the same in the later period.This property is in accord with the“Bathtub Curve”in the early and steady stages.In the early stage,strength degradation rate is mainly affected by the external random factors, such as dimension size, and environment.So,degradation rate changes quickly with time.But,the influence of internal factors,such as material property,plays leading roles in the strength degradation after a certain time.Then the degradation rate becomes steady.The former model in the preliminary work can't reflect the actual situation.
4 Conclusions
(1)A stochastic strength degradation model is built based on the non-stationary Gamma process with power law characterizing strength degradation trend.
(2)The validity of the proposed model is verified by contrast analysis.
(3)There is an implicit assumption that variance-to-mean ratio of strength degradation is a constant among the Gamma process-based strength degradation model.So,further research needs to be done to eliminate this limitation.
[1]Kallen M J,van Noortwijk J M.Optimal Maintenance Decisions under Imperfect Inspection[J].Reliability Engineering &System Safety,2005,90(2/3):177-185.
[2]Wu B J,Jin G.The Reliability Modeling and Analyzing of Momenum Wheel Based on Gamma Process [J].Value Engineering,2010,1(25):25-27.(in Chinese)
[3]An Z W,Gao J X,Liu B.Stochastic Model of Strength Degradation Based on P-S-N Curve[J].Chinese Journal of Computational Mechanics,2015,32(1):118-122.(in Chinese)
[4]Si X S,Wang W W,Hu C H,et al.Remaining Useful Life Estimation—a Review on the Statistical Data Driven Approaches[J].European Journal of Operational Research,2011,23(1):1-14.
[5]Lü W G,Xie L Y,Xu H.A Nonlinear Model of Strength Degradation[J].Journal of Mechanical Strength,1997,19(2):55-57,62.(in Chinese)
[6]Li L,Xie L Y,He X H,et al.Investigation of Residual Strength Degradation of 35CrMo Steel [J].China Mechanical Engineering,2009,20(23):2890-2892,2897.(in Chinese)
[7]Sun Z Q,Zhao J J.Stochastic Gamma Process Degradation Failure Analysis [J].Journal of Naval Aeronautical and Astronautical University,2010,25(5):581-584.(in Chinese)
[8]Wu Y,Xie L Y,Wu N X,et al.Time-Dependent Reliability Model of Components with Strength Degradation Based on Gamma Process[C].2011 International Conference on IEEE Reliability,Maintainability and Safety,Guiyang,China,2011:12-15.
[9]van Noortwijk J M,van der Weide J A M,Kallen M J,et al.Gamma Processes and Peaks-over-Threshold Distributions for Time-Dependent Reliability[J].Reliability Engineering and System Safety,2007,92(12):1651-1658.
[10]Yao W X.Structure Fatigue Life Prediction[M].Beijing:National Defence Industry Press,2003.(in Chinese)
[11]Mechanical Engineering Material Performance Data Book Editorial Board.Mechanical Engineering Material Performance Data Manual[M].Beijing:Mechanical Industry Press,1995.(in Chinese)
 Journal of Donghua University(English Edition)2015年6期
- Journal of Donghua University(English Edition)的其它文章
- Reliability Analysis of Electrical System of CNC Machine Tool Based on Dynamic Fault Tree Analysis Method
