A New Minimax Probabilistic Approach and Its Application in Recognition the Purity of Hybrid Seeds
A New Minimax Probabilistic Approach and Its Application in Recognition the Purity of Hybrid Seeds
Liming Yang1,Yongping Gao2and Qun Sun3
Minimax probability machine(MPM)has been recently proposed and shown its advantage in pattern recognition.In this paper,we present a new minimax probabilistic approach(MPA),which can provide an explicit lower bound on prediction accuracy.Applying the Chebyshev-Cantelli inequality,the MPA is posed as a second order cone program formulation and solved effectively.Following that,this method is exploited directly to recognize the purity of hybrid seeds using near-infrared spectroscopic data.Experimental results in different spectral regions show that the proposed MPA is competitive with the existing minimax probability machine and support vector machine in generalization,while requires less computational time than them.These results illustrate the feasibility and effectiveness of the proposed approach in recognition the purity of hybrid seeds.
Sample moments,Minimax probability machine,Second order cone programming,Maize seeds classi fication.
1 Introduction
The recognition of the purity of hybrid seeds is a challenging task in agricultural science.Applying machine learning techniques to discriminate the purity of hybrid seeds has the advantages of saving time and reducing cost.The challenge is to construct a recognition rule(called the classifier),which is trained by using a number of samples with known class labels.This approach is also known as supervised learning method such as minimax probability machine(MPM)[Lanckriet,Ghaoui,Bhattacharyya and Jordan(2002);Yoshiyama and Sakurai(2014);Lanckriet,Ghaoui,Bhattacharyya and Jordan(2002)]and support vector machine(SVM)[Vapnik(1998)].Usually,the purity of seeds are determined by seedling identi fication method and field experiment technology,but these methods can notdirectly provide probability outputs[Bai and Huang(2007)].
The MPM has several advantages over other methods in machine learning.Without making no assumption about the data distribution,the MPM utilizes the mean and covariance of each class of data to find a classification hyperplane.Compared with the popular SVM where separation hyperplane is determined by a few sample points(or the support vectors),the MPM has the advantage of using information from the dataset and can provide an explicit lower bound on prediction accuracy for each class of data.
When constructing a classifier,the probability of correct classification of data should be maximized.Be inspired by the MPM,we present a novel minimax probabilistic approach(called the MPA)for binary classification problems where the mean vector and covariance matrix of each class are assumed to be known.The main contributions of this work are as follows:
·By applying the moments of samples,a new minimax probabilistic approach is presented and directly applied to distinguish ”NongDa108”hybrid seeds from ”mother178”seeds using near-infrared spectroscopic data[Yang and Sun(2012)].
·Applying a multivariate generalization of the Chebyshev-Cantelli inequality[Marshall and Olkin(1960)],the proposed MPA is posed as a second order cone program[Lobo,Vandenberghe,Boyd and Lebret(1998)]and solved ef ficiently.
·Compared with the SVM and MPM,experimental results show that the MPA maintains generalization and reduces computational time.
2 Minimax Probability Machine(MPM)
The MPM with maximal probability separates two classes of data using the first two moments.The following is a simplified explanation of MPM.A more detailed description can be found in[Lanckriet,Ghaoui,Bhattacharyya and Jordan(2002)].Speci fically,suppose X1and X2represent two random n-dimensional vectors,with mean vectors and covariance matrices given byandrespectively.Where µ1,µ2∈ Rnand Σ1,Σ2∈ Rn×n.The MPM attempts to determine the hyperplane,which places class X1in the half spaceand class X2in the other half space H2(w,b)={x|wTx<b},with maximal probability with respect to all distributions that have these mean and covariance matrices.This is expressed as

where θ represents the lower bounds of the accuracy for future data,namely,the worst-case accuracy.Applying the Chebychev Cantelli inequality[Marshall and Olkin(1960)],the MPM is reformulated as a second order cone program(SOCP)formulation[Lobo,Vandenberghe,Boyd and Lebret(1998)]

with global optimal solutions.This SOCP problem is solved using the efficient interior point algorithm[Lobo,Vandenberghe,Boyd and Lebret(1998)].
3 A new minimax probabilistic approach(MPA)
We here use the notation in Sec.2.We separate two-class samples X1and X2when they are summarized by their the first second-order moments.Let X=X1-X2de fine the difference between the class random vectors X1and X2.Then the vector X lies in the halfspace.Motivated by the formula of the MPM,we construct a new minimax probabilistic approach(called the MPA)such that the random variable X with maximum probability lies in the halfspace H.We formulate this objective as follows

where α denotes the lower bound of classification accuracy.In other words,1-α represents the the maximum misclassification probability and the MPA is to minimize this maximum probability.The higher the value α is,more stringent is the requirement that all samples belong to the correct half space.
Assume that two random vectors X1and X2are independent,and then the mean and covariance of X can be expressed as:µ = µ1-µ2and Σ = Σ1+Σ2respectively.The following multivariate generalization of the Chebychev-Cantelli inequality is used to derive a lower bound on the probability of a random vector taking values in a given half space.
Lemma 1.Let X be a n dimensional random vector.The mean and covariance of X are µ ∈ Rnand Σ ∈ Rn×nrespectively.Let H(w,b)={z|wTz< b,w ∈ Rn,w/=0,b∈R}be a given half space.Then the following inequality holds[Marshall and Olkin(1960)]:

where(x)+=max(x,0).
Applying Lemma 1,the constraint(7)in the MPA formulation can be handled by setting

which results in the following nonlinear constraints:


Note that the constraint(12)is positively homogenous.That is,if w satisfies the constraints,then cw also satisfies the constraints(12)-(13),where c is any positive number.To deal with this extra degree of freedom,we require that the proposed MPA can separate µ1and µ2even if α =0.One way to impose this requirement is via the constraint wT(µ1-µ2)=1,which leads to the following optimization problem

By eliminating the variable k,the problem(15)-(17)becomes

Let Σ = Σ1+ Σ2.Note that Σ is a positive semi-de finite matrix since both the matrices Σ1and Σ2are positive semi-de finite.For simplicity,we assume that Σ is positive de finite.Our results can be extended to general positive semi-de finite cases by adding a small positive amount to its diagonal elements and make it positive de finite.Then there exists matrixC ∈ Rn×nsuch that Σ =CCT,and the optimization(18)-(19)takes the form:

This is also a second order cone program that can be solved in polynomial time using the popular SeDuMi software[Sturm:1999].The optimal vector w∗for the MPA is estimated by solving problem(20)-(21),and the worst-case(maximum)misclassification probability 1-α∗is obtained by

Furthermore,let y∗be a weighted average of class means:

where m1and m2represent the number of samples for class X1and X2respectively.For a new sample point xnew,the decision rule for the MPA is described as follows:the sample xnewis classified as belonging to the positive class if;the xnewis said to belong to the negative class if
Comments on the proposed MPA
·Without making no specific assumption on data distribution,the MPA can provide an explicit upper bound on the misclassification error.
·Applying the Chebyshev-Cantelli inequality,the MPA is posed as a second order cone program and solved efficiently.
·Compared with the original MPM,the objective function of the MPA is simpler thanthat of the MPM.Thus it is convenient to apply the MPAin practical applications.
·To gain more insight into the nature of the MPA,we reformulate the MPA formulation(11)-(14)as

which is equivalent to the following optimization by eliminating k

This is similar to the traditional Fisher discriminant analysis(FDA)[Yu and Ren:1999;Wang,Li,Song,Wei and Li:2011],the main idea from which can be brie fly described as follows.Suppose that there are two-class samples.The FDA is to find an optimal hyperplane with direction vector w which gives good separation between the two projected sets wTX1and wTX2with small projected variances.Moreover,the formulation(27)shows that the bigger the square of the difference between the means of two classes projected samples is and at the same time the smaller the within-class scatter is,the better the expected hyperplane is.
Therefore,the MPA involves seeking an optimal direction that separates the two-class data and yields small projected variances,while the FDA can be understood as finding a discriminant hyperplane whose generalization error is less than 1-α∗.However the traditional FDA is not known whether this optimal hyperplane can be used to compute a bound on the generalization error.
4 Experimental Design and Results
Maize is the main agricultural crop in China,and its yield is significantly related to the seed purity[Williams,Geladi,Fox and Manley(2009)].The ”NongDa108”maize hybrid seeds and ”mother178”seeds used in the experiments were harvested in Beijing,China,in 2008.A total of 240 seeds samples were selected in this experiment.
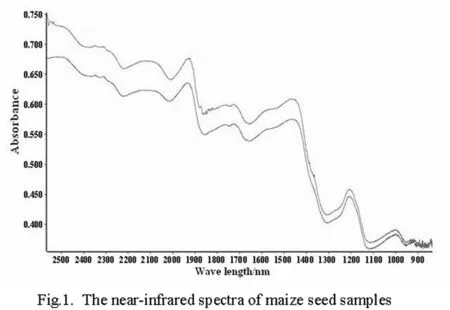
Figure 1:The near-infrared spectra of maize seed samples.
4.1 Experimental design
In this investigation,near-infrared(NIR)spectra for the maize seeds were acquired using a spectrometer fitted with a diffuse re flectance fiber probe[Han,Mao and Wang:2008].The NIR spectral range of 800-2500 nm was recorded with a resolution of 4cm-1.Each sample spectrum was the average of 32 scans.This procedure was repeated four times for each sample:twice from the front at different locations and twice from the rear at different locations.A final spectrum was taken as the mean spectrum of these four spectra.Moreover,we selected 240 spectra comprising spectral dataset,120 from hybrid seeds and 120 from mother seeds.Consequently,the spectral data set contains 240 samples measured at 2100 wavelength points.The NIR spectra of seed samples including the hybrid seeds and mother seeds are illustrated in Figure.1.
It can be observed from Fig.1 that the noise level is relatively high in the spectral range of 800-1000nm.Thus numerical experiments were done in spectral range of 1000-2500nm.The initial spectra were digitized by OPUS5.5software.To validate the performance of the proposed MPA,numerical experiments were carried out in nine different spectral ranges:1666-2500nm,1666-2000nm,1666-1250nm,1250-2500nm,1250-2000nm,1000-1250nm,1000-2500nm,1666-1428nm and 1250-1428nm.The corresponding sample regions are denoted regions A-I respectively.Information on them is summarized in Table 1.
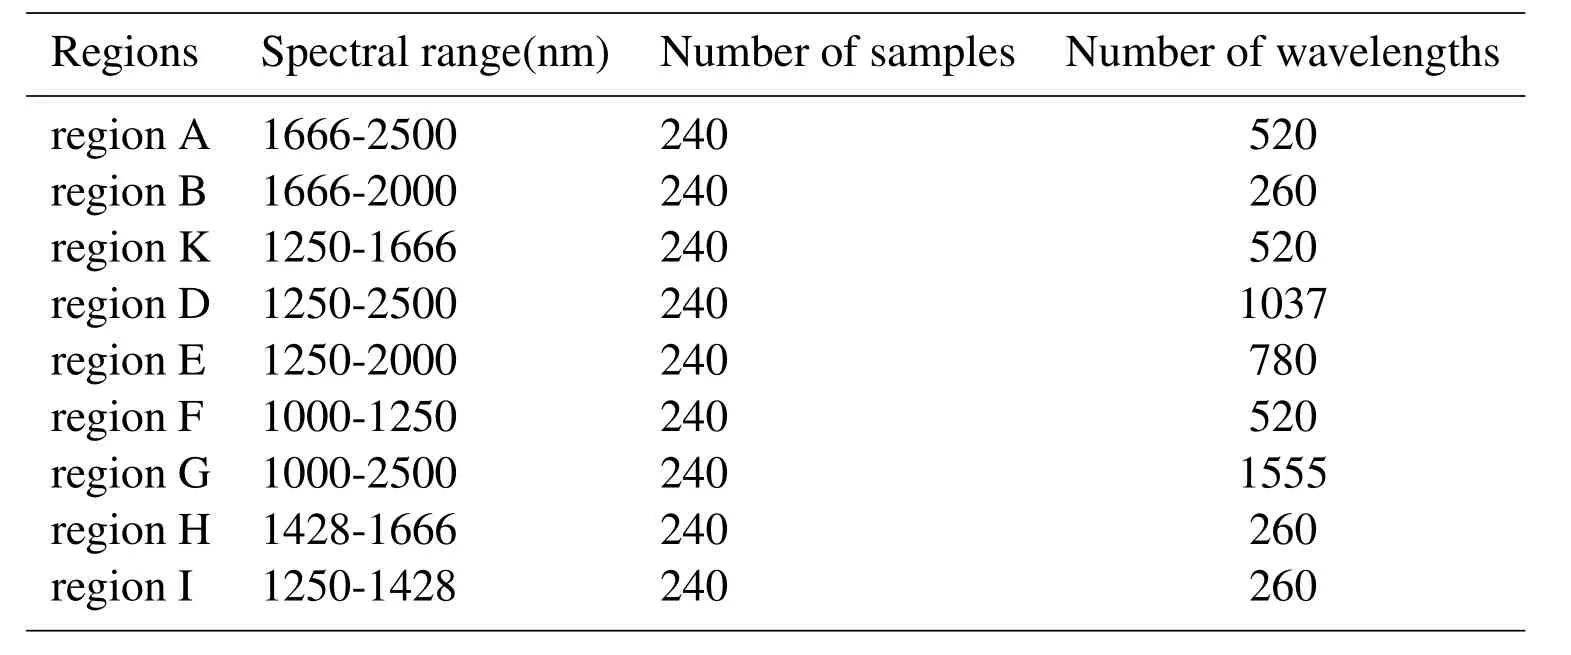
Table 1:The near-infrared spectral sample regions of maize seeds.
The evaluation criteria are specified before presenting the experimental results.Let TP and TN denote true positives and true negatives,respectively;FN and FP denote false negatives and false positives,respectively.We use the following criteria for algorithm evaluation.
·The classification accuracy of all samples from two classes(ACC),Matthews correlation coefficient(MCC)and F1measure.The above values can be obtained from the decision function and are de fined as[Fawcett:2006]

The MCC and F1measure are two comprehensive evaluation criteria of the quality of classification models.The higher the values above,the better the models are.
·Time:total training and testing time.
·The worst-case bound on the probability of misclassification error.
In addition,we chose the popular MPM and SVM as the baseline methods,and the performance of these two methods on the same spectral regions is also reported.Ten-fold cross-validation is used in this experiments.That is to say,each spectral sample set is split randomly into ten subsets,and one of those sets is reserved as a test set.This process is repeated ten times,and the average testing results is used as the performance measure.Experiments use Matlab 7.0 as a solver.The following toolboxes were used in this investigation:
MATLAB Statistics Toolbox.
MATLAB optimization Toolbox.
MATLAB SeDuMi Toolbox[Sturm(1999)].
The SeDuMi software is employed to solve the SOCP problems of the MPM and MPA.The”quadprog”function in Matlab is used to solve the related optimization problem of the SVM.
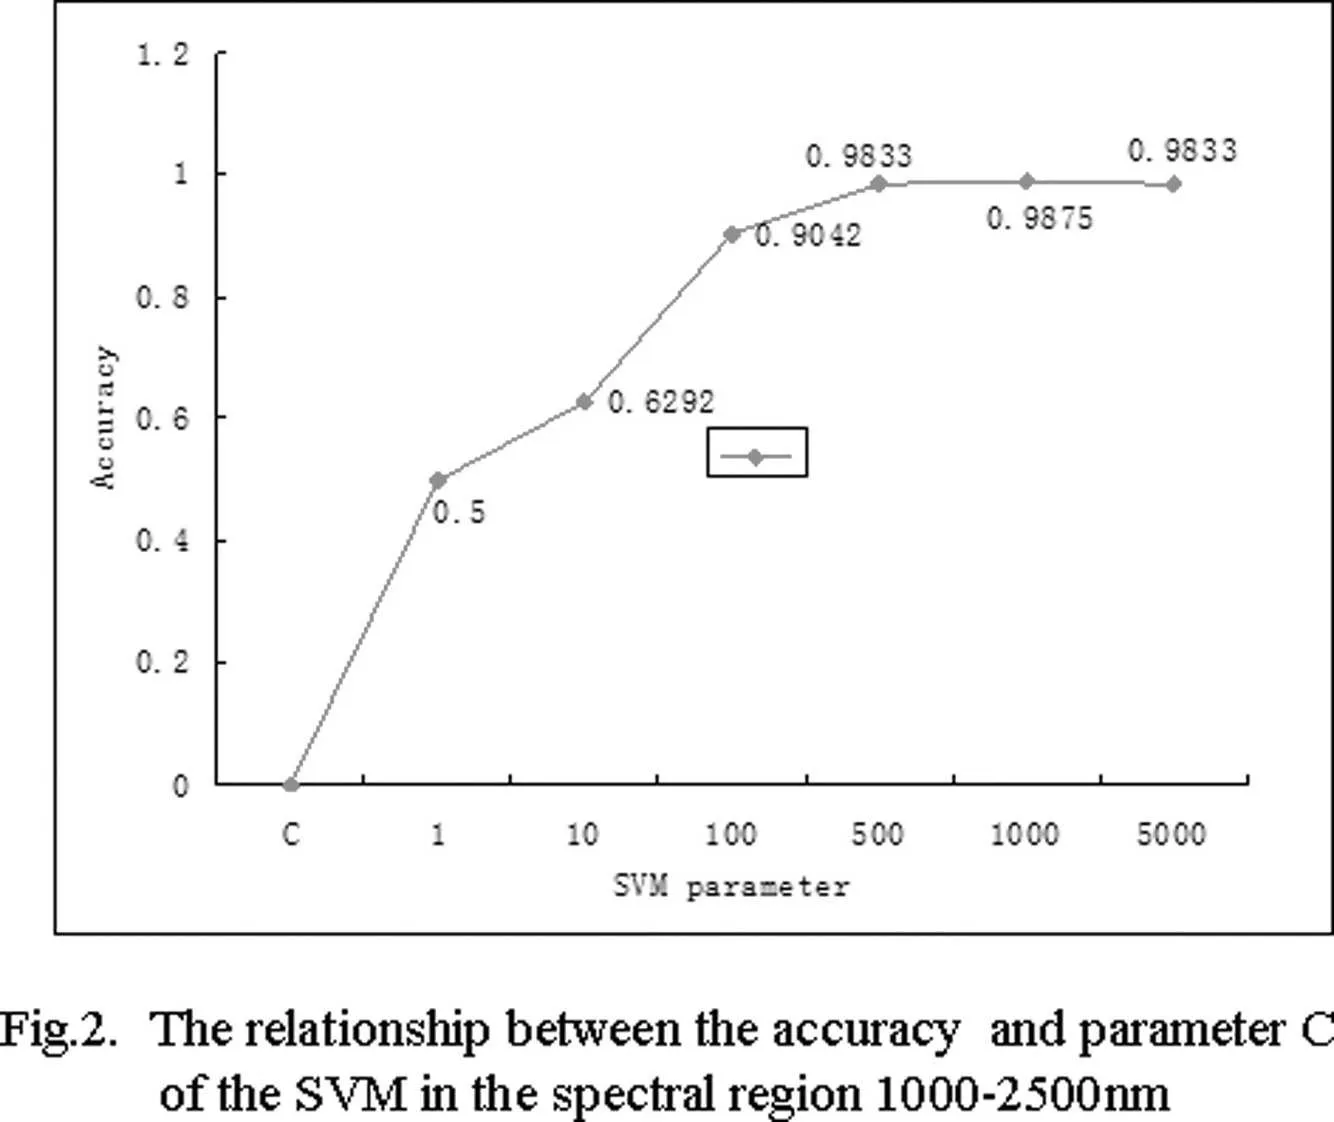
Figure 2:The relationship between the accuracy and parameter C of the SVM in the spectral region 1000-2500nm.
The accuracy of the SVM depends on its parameter C.In this work the parameter C was tuned from the set of values{10i|i=-1,···,4}to maximize the accuracy in the spectral region 1000-2500nm.We present a map(Fig.2)to illustrate the relationship between the parameter C and accuracy.We find from Fig.2 that the SVM increases whenC is between 1 and 1000,and that the SVM produces greater accuracy when parameter C is set to a larger value;while ACC decreases when parameter C ranges from 1000 to 5000.These findings were helpful in the choice of parameter in this experiments.Finally,the SVM parameter C=1000 was selected in this work.
4.2 Experimental results
We compare the MPA against the MPM and SVM in nine different spectral regions.The average experimental results by ten-fold cross-validation are summarized in Table 2.
4.2.1 Comparison of the MPA with MPM in terms of ACC,MCC and F1
We find that from Tables 2 the MPA has equivalent performance to the MPM with respect to ACC,MCC and F1comparisons in all nine spectral regions.The running speed of the MPA is faster than that of the MPM in all cases,and the computation time of the MPA is a half of that of the MPM at most.
4.2.2 Comparison of the MPA with MPM in terms of the the worst-case misclassification probability
The 1-θ and 1-α are the worst-case(maximum)misclassification probability of the MPM and MPA respectively.In this section,the optimal values of the 1-θ and 1-α are checked in five regions A,K,D,F and G,respectively.The results are illustrated in Fig.3,where the y-axis denotes the values of the maximum misclassification probability and the x-axis denotes the spectral regions.The values of the 1-θ and 1-α vary from 0.2 to 0.4.The performance of the MPM is slightly better than that of the MPA in three of five spectral regions;while in the other two spectral regions,the MPA is slightly superior to the MPM.These results suggest that there is no significant difference between the MPM and MPA with respect to the maximum misclassification probability.
4.2.3 Comparison of the MPA with SVM
Compared with the SVM,one important feature of the MPA is that the MPA can provide an explicit upper bound on the misclassification probability.In terms of ACC,MCC and F1,the SVM is slightly better than the MPA in regions E and H;the MPA is superior to the SVM in regions F and I.There is no significant difference between the MPA and MPM in other five regions.However,the MPA reduces significantly computation time with a training speed over ten times faster in all considered nine spectral regions.
According to the above analysis,we find that the MPA,without loss of generalization,always reduces computational time compared with the MPM and SVM.Thismeans that the training speed of the MPA is the fastest in these three methods,a possible reason for which is that,with equivalent time complexity to the MPM and SVM,the MPA formulation contains fewer variables than the MPM and SVM.
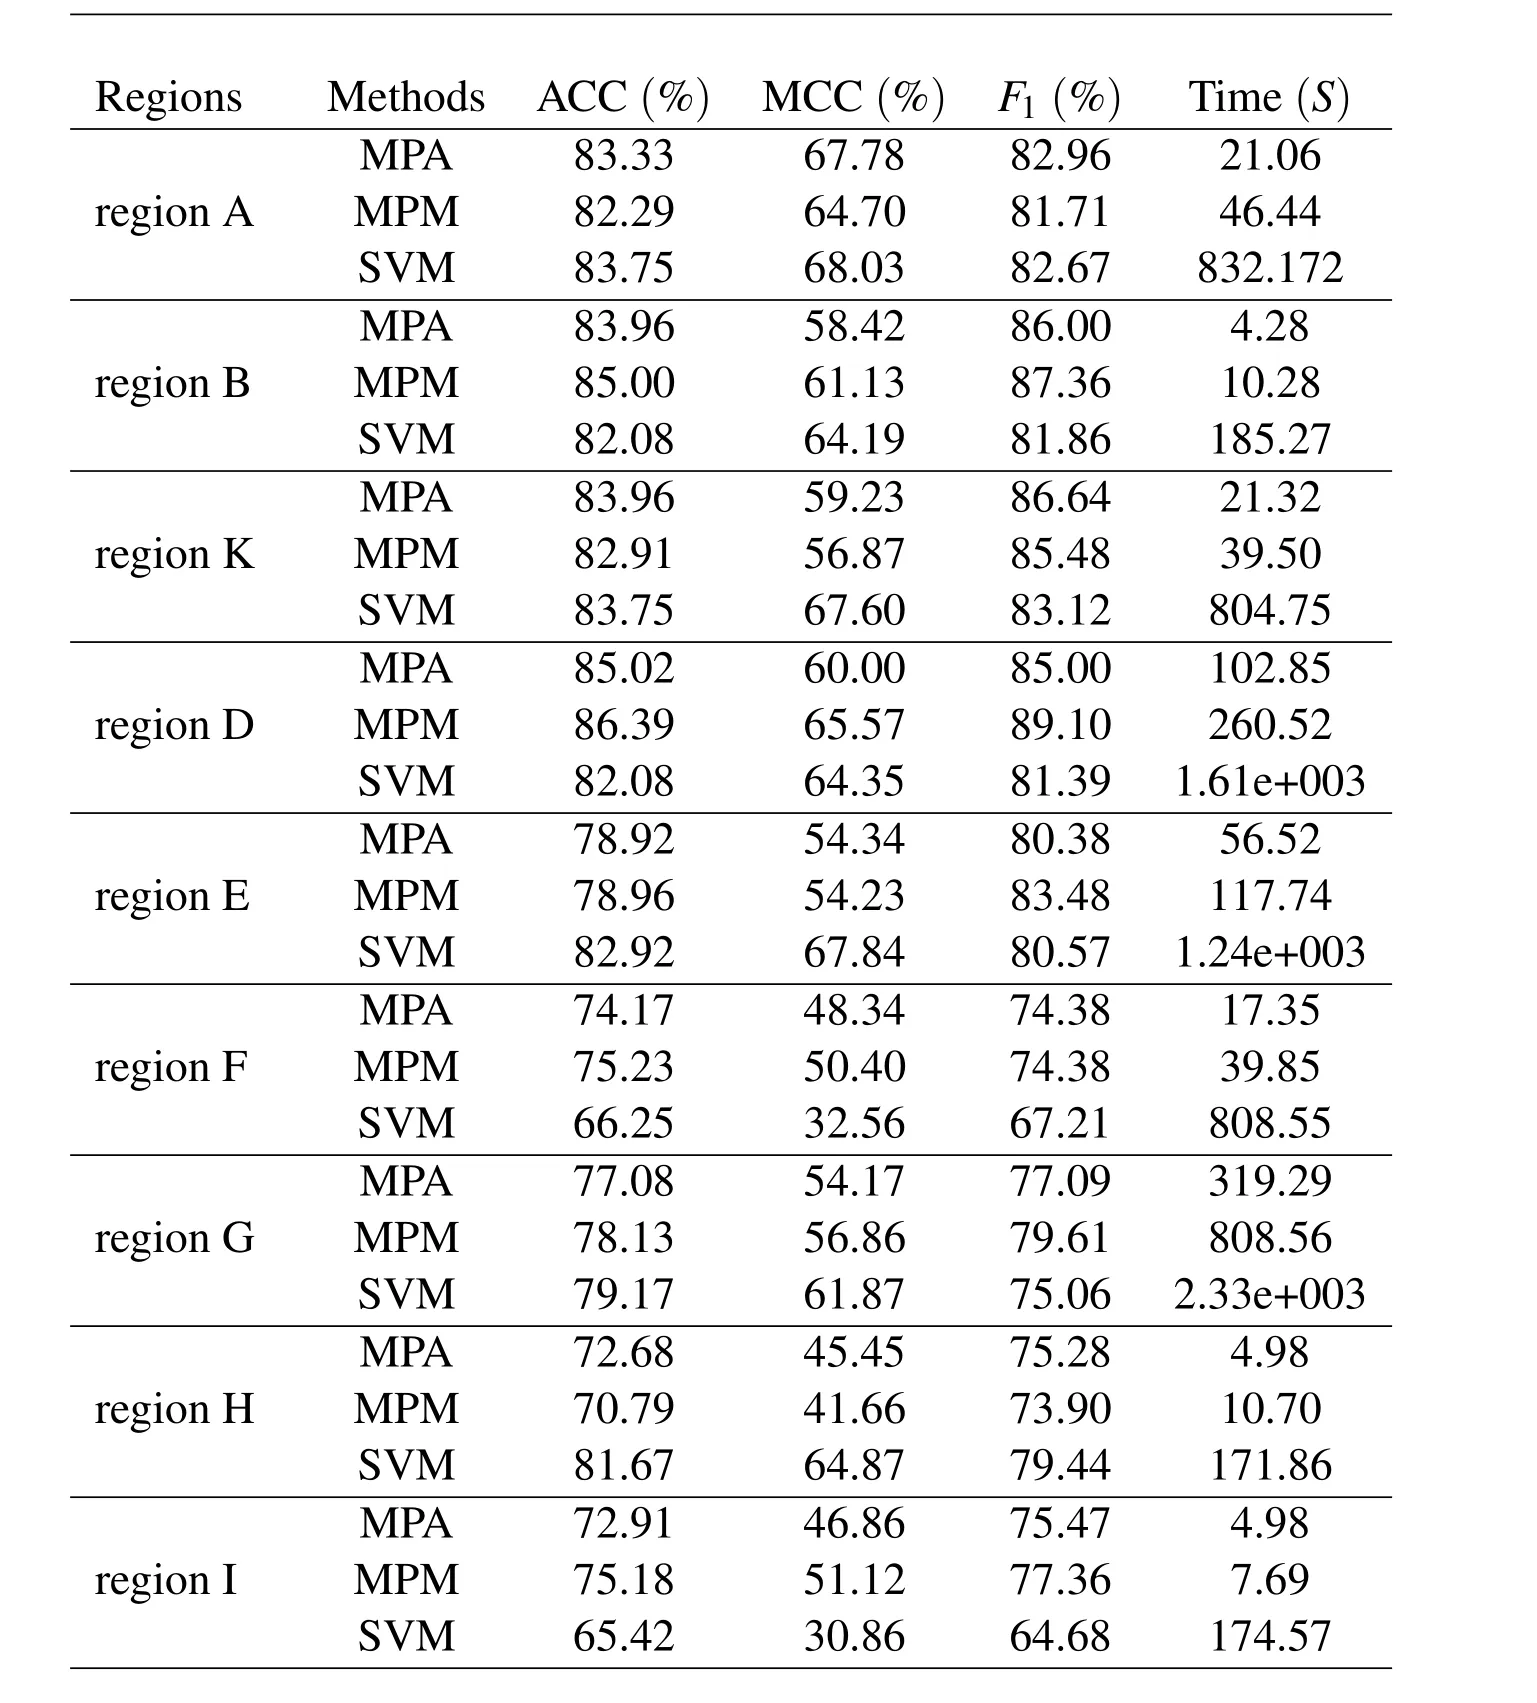
Table 2:Comparisons of the MPM,SVM and MPA according to generalization and runtime in different spectral regions.
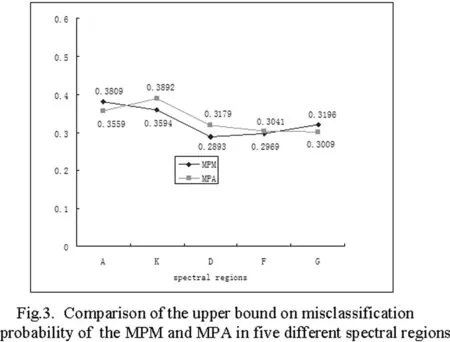
Figure 3:Comparison of the upper bound on misclassification probalility of the MPM and MPA in five different spectral regions.
5 Conclusions and future directions
We propose a new minimax probabilistic approach(MPA)for binary classification problem in which data are summarized by their moments of class-conditional densities.Moreover,the proposed MPA can be solved effectively,only needing to solve a second order cone program.Furthermore,the MPA is directly used to to recognize the purity of hybrid seeds using the proposed MPA and NIR spectroscopy data.We rigorously validate the MPA method in different spectral regions for maize seed samples in terms of different measures.The investigation is summarized as follows.
·Without making no assumption about the data distribution,the MPA can provide an explicit lower bound on prediction accuracy.
·Applying the Chebyshev-Cantelli inequality,the proposed MPA is posed as a second order cone program and solved efficiently.
·The MPA has the similar form to the traditional FDA formulation via a proper mathematical transformation,but it is superior to the FDA by providing an explicit upper-bound on generalization error.
·We illustrate how to distinguish"NongDa108"hybrid seeds from"mother178"seeds using near-infrared spectroscopic technology.
Compared to the MPM and SVM,experimental results show that the MPA does not lose generalization,and reduces the computation time in all considered nine spectral regions.
Recognizing the purity of hybrid seeds is an important part of seed testing.Experimental results show that it is possible to identify the purity of hybrid seeds using the proposed minimax probabilistic method and NIR spectroscopic data.
Acknowledgement:This work is supported by National Nature Science Foundation of China(11471010,11271367).
Bai,O.;Huang,R.D.(2007):Comparison of plant height,light distributing and yield in different purity populations of maize.Journal of Maize Sciences,vol.15,no.3,pp.59-61.
Fawcett,T.(2006):An introduction to ROC analysis.Pattern Recognition Letters,vol.27,pp.861-874.
Han,L.L.;Mao,P.S.;Wang,X.G.(2008):Study on vigor test oat seeds with near infrared reflectance spectroscopy.Journal of Infrared and Millimeter Waves,vol.2,pp.86-90.
Lanckriet,G.R.G.;Ghaoui,L.E.;Bhattacharyya,C.;Jordan,M.I.(2002):Minimax Probability Machine.Advances in neural information processing systems,vol.14.
Lanckriet,G.R.G.;Ghaoui,L.E.;Bhattacharyya,C.;Jordan,M.I.(2002):A robust minimax approach to classification.Journal of Machine Learning Research,vol.3,pp.555-582.
Lobo,M.;Vandenberghe,L.;Boyd,S.;Lebret,H.(1998):Applications of second order cone programming.Linear Algebra and Application,vol.284,pp.193-228.
Marshall,W.;Olkin,I.(1960):Multivariate Chebychev inequalities.Annals of Mathematical Statistics,vol.31,no.4,pp.1001-1014.
Sturm,J.F.(1999):Using SeDuMi 1.03,a MATLAB toolbox for optimization over symmetric cones.http://www.Unimaas.nl/sturm/software/sedumi.html.
Vapnik,V.N.(1998):Statistical Learning Theory,New York,Wiley.
Wang,S.;Li,D.;Song,X.L.;Wei,Y.J.;Li,H.X.(2011):A feature selection method based on improved fisher’s discriminant ratio for text sentiment classi fication.Expert Systems with Applications,vol.38,pp.8696-8702.
Williams,P.;Geladi,P.;Fox,G.;Manley,M.(2009):Maize kernel hardness classification by near infrared hyperspectral imaging and multivariate data analysis.Analytica Chimica Acta.vol.653,no.2,pp.121-130.
Yang,L.M;Sun,Q.(2012):Recognition of the hardness of licorice seeds using a semi-supervised learning method and near-infrared spectral data.Chemometrics and Intelligent Laboratory Systems,vol.114,pp.109-115.
Yoshiyama,K.;Sakurai,A.(2014):Laplacian minimax probability machine.Pattern Recognition Letters,vol.37,pp.192-200.
Yu,J.L.;Ren,X.S.(1999):Multivariate Statistical Analysis.China Statistics Press,Beijing,Chian.
1College of Science,China Agricultural University,Beijing,100083,China.
2Capital Normal University,Beijing,100048,China.
3College of Agriculture and Biotechnology,China Agricultural University,Beijing,100193,China.

