Fast Mold Filling Simulation Based on the Geodesic Distance Calculation Algorithm for Liquid Composite Molding Processes
J.WangP.SimacekS.G.Advani
Fast Mold Filling Simulation Based on the Geodesic Distance Calculation Algorithm for Liquid Composite Molding Processes
J.Wang1,2,P.Simacek1,2,S.G.Advani1,2,3
In Liquid Composite Molding(LCM)processes,resin is introduced into a stationary fiber reinforcement placed in the mold,until the reinforcement gets fully saturated with resin and all volatiles are vented out of the part.Finite element based software packages have been developed to simulate the mold filling process and eliminate expensive and tedious trial and error practices to arrive at a successful mold filling without any voids.However,the non-homogeneity of the fiber reinforcement material and its placement and layup in the mold creates a large degree of variability of flow patterns during the resin impregnation process.Executing simulations for every possible permutation of flow scenarios,which is required to devise a robust process design is computationally expensive.Therefore,it is necessary to find faster approximate mold filling simulation methods so that all simulations can be performed within a reasonable time frame.In this paper,a discretized one-dimensional flow model is developed to predict the fill time based on the distance resin travels.Combined with Dijkstra’s algorithm,this model is then implemented on spatial surface meshes to calculate fill time for each node and generate flow development pattern.The computational model developed can predict the mold filling pattern for complex parts even with variable permeability or thickness of the fiber preform,and can capture the disturbed flow behavior along any dif ficult geometric features at a fraction of the computational cost.Case studies are presented to demonstrate the ef ficiency and accuracy of the distance-based model.
Liquid Composite Molding,Geodesic Distance,Dijkstra’s Algorithm,Mold Filling Simulation,Composite Processing Optimization
1 Introduction
1.1 Liquid Composite Molding(LCM)processes
In Liquid Composite Molding(LCM)processes,dry reinforcement is placed inside a mold cavity.In some cases,vacuum is drawn through vents while resin is injected through inlets called as gates.When the resin arrives at the last vent location,the injection is discontinued and after the resin cures the part is de-molded.The two common LCM processes are Resin Transfer Molding(RTM)and Vacuum Assisted Resin Transfer Molding(VARTM).RTM uses a rigid mold and resin is injected under high pressure,while in VARTM one-sided mold is sealed with a vacuum bag and atmospheric pressure is used as the driving force(Fig.1).There are other techniques such as RTM-Light that uses a compliant mold.RTM can manufacture complex net-shaped parts with good structural properties and surface finish while VARTM is more attractive for large components such as wind blades[Advani and Sozer(2002)].
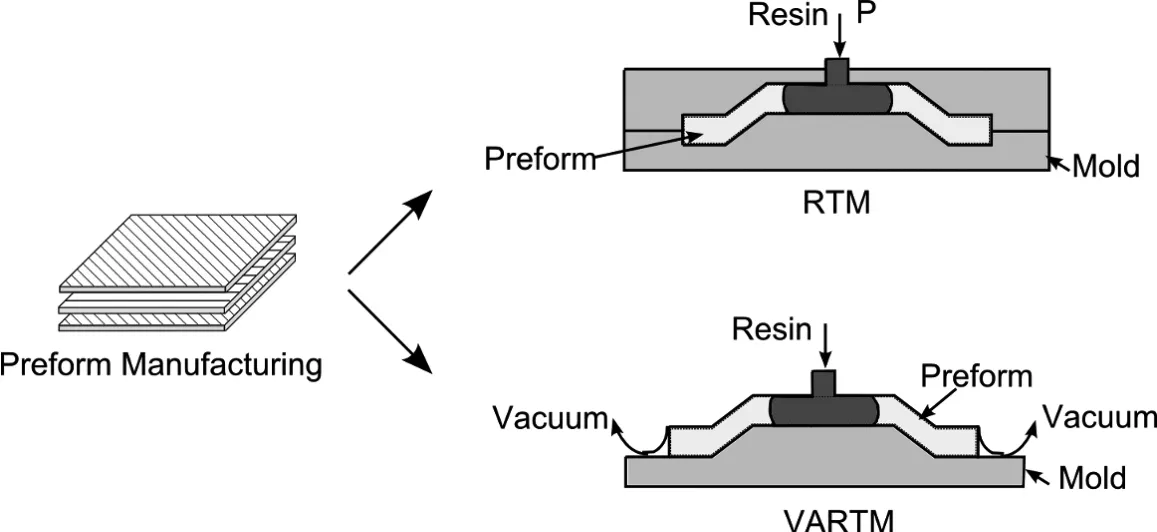
Figure 1:RTM and VARTM are widely used Liquid Composite Molding(LCM)processes[Advani and Sozer(2002)]
The resin injection step plays a key role in LCM processes.The injected resin has to fully saturate the empty regions in between the fibers to successfully make a composite part without dry spots or voids.Dry spots are formed when resin arrives at the last vent before saturating all the empty regions between the fibers,hence vents are placed at locations where resin arrives last and also where flow fronts tend to merge or approach a corner or an edge so the displaced air and volatiles can be expunged.Ideally,correct venting strategy based on the selected injection locations guarantees the manufactured composite part will be free of voids and dry spots.For correct vent placement,it is necessary to accurately predict the resin flow pattern during injection and the filling pattern is usually a strong function of the local permeability of the preform within the mold.
1.2 Mold filling simulations
Mold filling simulation describes flow of resin through fiber preforms which are modeled as porous continuum.Usually,the relations between fluid pressure and volume averaged fluid velocity is given by Darcy’s Law and this relation is substituted into mass conservation equation.Based on this model,many numerical simulations have been developed[Bruschke and Advani(1990);Bruschke and Advani(1994);Hourng and Chang(1993);Lin,Thomas Hahn,and Huh(1998);Maier,Rohaly,Advani,and Fickie(1996);Mohan,Ngo,and Tamma(1999);Trochu,Gauvin,and Gao(1993);Turner,Nakshatrala,and Hjelmstad(2006);Voller and Peng(1995);Young,Fong,and Lee(1991)]to forecast the mold filling patterns.We have also developed a three dimensional Finite Element/Control Volume(FE/CV)based simulation called “Liquid Injection Molding Simulation”(LIMS)[Bruschke and Advani(1990);Šimáˇcek and Advani(2004)]which can predict the flow patterns once the geometric and local permeability information is provided as input.For perfectly deterministic,repeatable process in which the permeability may vary from location to location but will not change from one part to the next,only one simulation is necessary to identify the vent locations for desired inlet location(s)to fill the mold without any dry regions or voids.In practice however,the inherent material variability and disturbances introduced during fabric placement in the mold along complex geometric features,such as sharp corners,edges or inserts in the geometry design,will introduce resin flow disturbances and dramatically change the flow pattern from one part to the next[Wang,Andres,Simacek,and Advani(2012)].The venting scheme designed by running simulation of the ideal case may result in voids in scenarios where flow disturbances were experienced.The robust venting scheme has to account for the process variability to manufacture a part without any voids in virtually all possible scenarios due to permutations of all likely disturbances.This generally requires one to execute thousands to millions of simulations and allocate additional vents in the design.Hence a fast approximate method could provide the robust design in a reasonable time frame.
1.3 Flow disturbances in LCM processes.
Flow disturbances are introduced by material variability and,more often,by the variations in preform cutting and placement in the mold.The latter is closely related to the designed part geometry.Depending on this variation,the actual flow patterns vary from the idealized mold filling pattern predicted using the simulations.One of the most important factors that changes the resin flow patterns are“race-tracking channels”[Advani and Sozer 2002;Bickerton and Advani(1999);Šimáˇcek and Advani(2004)].These are likely to occur along the outer edges,fabric folds,rib bases and tapered regions of the part(Fig.2)[Advani and Sozer 2002;Wang,Andres,Simacek,and Advani(2012)].At these locations,irregular cuts or placement of the fiber preform results in gaps or channels between the reinforcement and the mold wall.Resin races along these channels because these regions offer very low resistance to flow compared to the bulk fabric in the mold.In certain cases,this may change filling pattern signi ficantly,leaving large unsaturated regions as the resin may find an alternate path to the vents without saturating all the fibers within the mold cavity(Fig.3)[Lawrence,Barr,Karmakar,and Advani(2004);Comas-Cardona,Binetruy,and Krawczak(2007);Comas-Cardona,Bickerton,Deleglise,Walbran,Binetruy,and Krawczak(2008)].
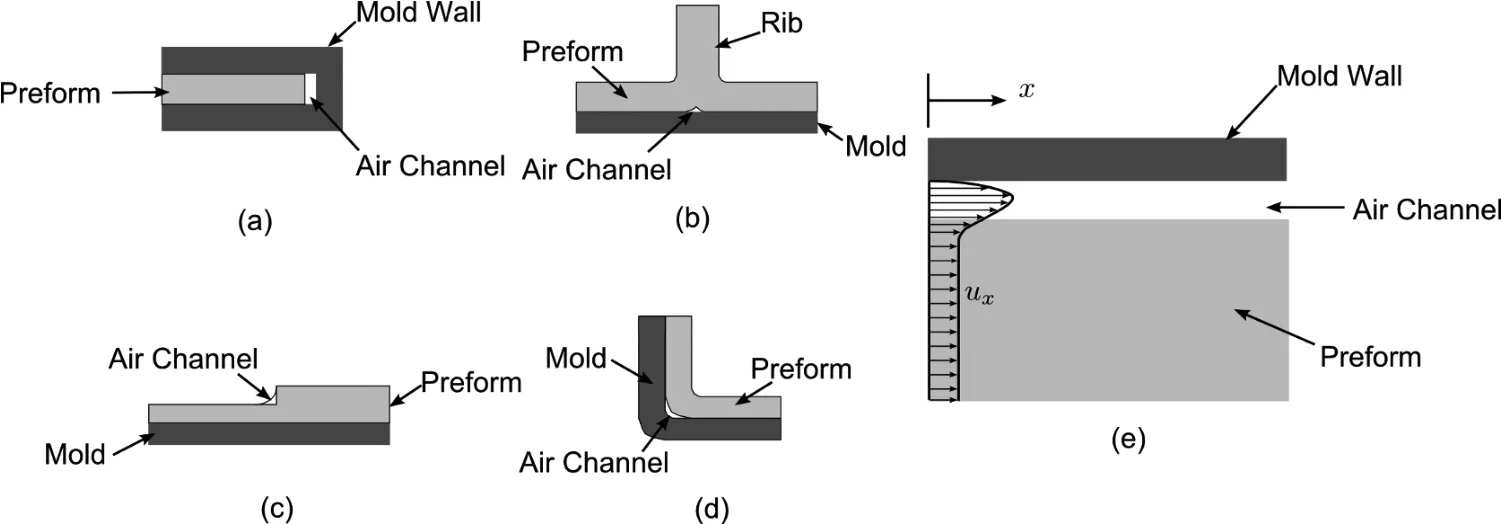
Figure 2:Geometrical features that cause air gaps and lead to race-tracking effect(a)outer edge;(b)rib base;(c)tapered regions;(d)sharp corner,and their effect on resin impregnation velocity shown in(e).
Race-tracking channels are not repeatable from one part to the next during the manufacturing process.Statistically significant flow pattern deviations are observable during a batch production of the same part.In the simulation input,permeability values along race-tracking channels are assigned in terms of the channel crosssection area.Thus,one can introduce a probability distribution function constructed from manufacturing data to define the variation of the race-tracking channels’size,and the permeability along these channels,from one part to the next.For the purpose of numerical handling,this distribution must be discretized.Gokce et al.[Gokce and Advani(2004a);Gokce and Advani(2004b)]used discrete Weibull density function distribution to represent the race-tracking channel permeability variations.Each channel is assigned with two sets of numbers:strength of racetracking and its probability.Edges,folds and rib bases are treated separately when specifying the likelihood of race-tracking effects,and different probability maps should be used for different manufacturing facilities[Wang,Andres,Simacek,and Advani(2012);Gokce and Advani(2004b);Gokce and Advani(2004a)].An example for describing outer edge race-tracking strength probability distribution and discretization is shown in Fig.4.
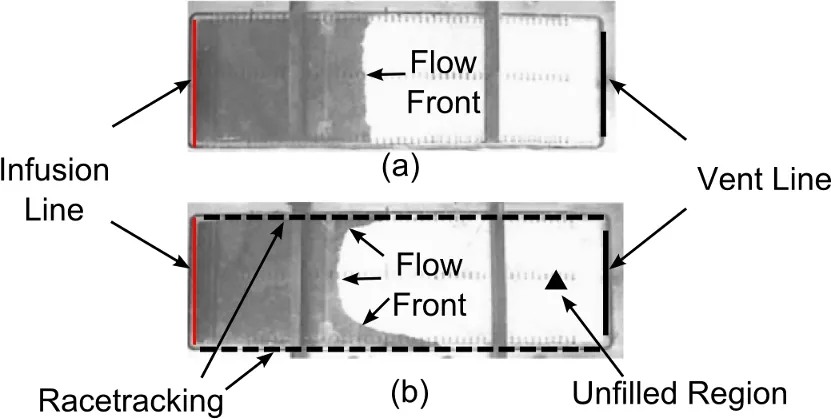
Figure 3:One-dimensional resin flow experiment(a)without race-tracking effect,and(b)with two race-tracking channels along the top and the bottom edge,which resulted in a part with a void(un filled region)[Lawrence,Barr,Karmakar,and Advani(2004)]4Reprint from Composites Part A:Applied Science and Manufacturing 35,no.12(2004):1393-1405,Lawrence,Jeffrey M.,John Barr,Rajat Karmakar,and Suresh G.Advani.“Characterization of preform permeability in the presence of race-tracking.”,with kindly permission from Elsevier.
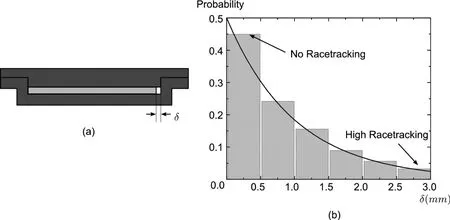
Figure 4:(a)An example race-tracking channel along the outer edge,and(b)racetracking strength probability distribution and discretization for this channel
2 Robust design of infusion/venting schemes for LCM processes
Robust design of venting schemes for LCM processes requires one to consider race-tracking effects in flow simulations.Race-tracking channels along with their discrete probability description of race-tracking strength in terms of channel crosssection area can generate a scenario space that represents the manufacturing practice.Mold filling simulations for all of the scenarios can be executed to design the vent location map that is sufficiently robust to fill the part without dry spots in the presence of race-tracking channels.[Gokce and Advani(2004b);Gokce and Advani(2004a);Wang,Andres,Simacek,and Advani(2012)]
2.1 Generation of scenario space
Assuming each race-tracking channel is independent from other channels,and using the discretized probability model to describe the race-tracking strength,one can generate a scenario space which includes all the scenarios that may occur during actual manufacturing and each scenario has a probability assigned based on the race-tracking channel pattern.Running mold filling simulations for all the scenarios will find all the necessary vent locations to guarantee filling of the part in all cases.An example of this methodology is shown in Fig.5 for a simple plate with a cutout,which contains 8 race-tracking channels.Each race-tracking channel is assumed to have 80%probability of no race-tracking,and 20%probability of low race-tracking.Thus,a scenario space containing 28=256 scenarios are generated.Each scenario is assigned with a probability of occurrence and the combination of all the scenarios will represent“everything”that“could happen”during the composite manufacturing process.
The mold filling simulation software LIMS can be executed to obtain the fill time and the flow pattern for each scenario.Vent locations are identified for each scenario,and the nodes selected as vents are associated with that scenario’s probability.The summation of each node’s probability of being set as vent will generate a vent fitness map.To guarantee success,each node that has a non-zero probability should be set as vent,so that the part can be filled even when that particular combination of race-tracking effects is encountered during manufacturing(Fig.5(c)).Because resin will arrive at most of the vents selected by this methodology before the filling is complete,it is necessary to close the vents right after the resin arrives at its location which in practice can be triggered by placing a resin detection sensor at the vent.
2.2 Fast mold filling simulation to integrate process optimization with composite part design
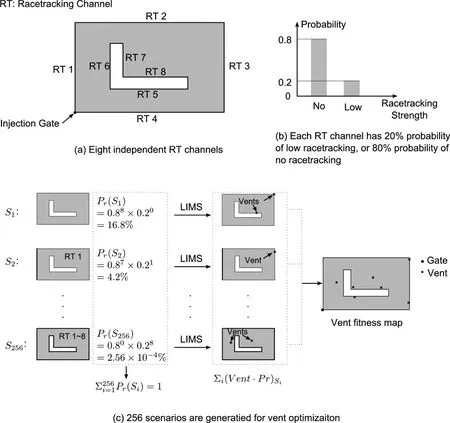
Figure 5:Scenario space generation with 256 scenarios for two potential racetracking strengths for eight possible race-tracking edges for a composite plate with cutout
Integration of composite part design and manufacturing simulation requires a set of robust processing parameters being established automatically and feedback being provided to the part designer[Wang,Andres,Simacek,and Advani(2012)].Accomplishing this may call for simulating all possible scenarios of race-tracking channels.However,the number of scenarios to be simulated is usually large and feedback should be provided reasonably fast.If using software package developed based on FE/CV simulations such as LIMS,the time cost to run a set of manufacturing analysis will take too long to be applicable for design-manufacturability integration as it cannot generate real-time feedback to the designer.For example,for a simple mesh containing 5000 nodes,it takes about 15 seconds to run one scenario in the mold filling simulation package LIMS,and running 1000 scenarios will take more than four hours which is too long for real time feedback to the designer.In most cases it is not necessary to provide all simulation outputs but only the estimated impact on flow patterns due to a disturbance on process design(such as inclusion of additional vent locations because of race-tracking effect).If there is an approximate method to estimate filling patterns instantly,even with lower accuracy,the feedback to the designer could be in real time to make changes in the design to reduce the impact of race-tracking.
Predicting fill time based on the largest distance on the surface to the gate were first attempted by Boccard et al.[Boccard,Lee,and Springer(1995)]by assuming a radial flow within the mold cavity and channel flow on the edges for flat surfaces.It uses pure distance method on flat surfaces without thickness and permeability changes[Jiang,Zhang,and Wang(2002)].This model was also used to predict the fill time and weld lines on a polygon surface[Jovanovic,Manoochehri,and Chassapis(2001)].However,this model is concentrated on predicting fill time for part manufacturing,and also it is not applicable if there is material variability in the fiber preform,such as preform thickness changes,higher permeable mat(distribution media)added to accelerate the resin flow in VARTM,and race-tracking channels.
In this paper,a one-dimensional model is developed to relate the fill time with the distance.Combining with Dijkstra’s algorithm[Dijkstra(1959)]in search of a path that resin will travel along to simulate the flow front development, fill times for each node on the mesh are predicted.We have modified the method so it can capture the fiber permeability and thickness changes and race-tracking effects for robust vent locations design.The contour plot of the fill time,or the flow pattern which is used for vent location generation,is then compared to the results returned from the mold filling simulation software LIMS.Comparing with LIMS which has(for 2D problems)a time complexity ofO?N2?,this distance-based model can be reduced to a time complexity ofO(|E|+Nlog(N))(Nis number of nodes in the mesh,and|E|is number of edges)[Fredman and Tarjan(1987)].
3 Distance based method for mold filling pattern prediction and its piecewise simplification on FE meshes
The following section details the equations necessary to evaluate the relations between the time resin flows across one element length on the mesh and its distance to the injection gate.First a continuous model is developed for a one-dimensional flow and then is discretized over the mesh(Fig.6).Then this model is used on spatial surfaces to predict each node’s fill time.
3.1 One-dimensional distance time model
Multiple segments of porous media are injected sequentially,each having a distinct permeability value,thickness and porosity.The relation between flow-front positions versus time is outlined below[Lugo,Simacek,and Advani(2014)].
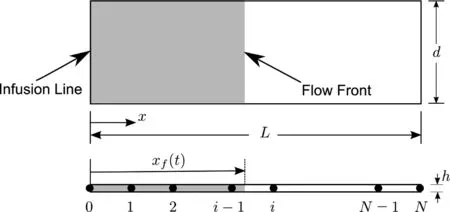
Figure 6:One-dimensional flow model(above)and its mesh(below)
For the one-dimensional flow shown in Fig.6,under the quasi-steady solution approach,and assuming no dual-scale effects prevalent during the infusion,the instantaneous governing equations for 1D flow volume averaged velocityuxthrough a thin plate with permeabilityKxxaccording Darcy’s Law is:

wherep,andηare the resin pressure and viscosity respectively.The conservation equation requires that at anyxlocation:

in whichh(x)is the local thickness.Combining Eq.1 and Eq.2,we obtain the differential equation describing resin pressure field:

Integrating both sides of Eq.3,the resin pressure from the inlet to pressure at the flow-front,xfrom 0 to flow-front positionxf(t):

This provides the relation between the flow rateQand the flow-front positionLas follows:

Based on one-dimensional linear flow assumption,the progress of the flow-front can be written as:

in which φ is the porosity of the fiber preform,and is equal to 1−vf,where vfis the fiber volume fraction.Substituting Eq.5 into Eq.6,the differential equation for the progress of the flow-front can be expressed as:

Eq.7 can be integrated from node i−1 to its neighboring node i,and thus one obtains the flow-front moving time between these two locations(nodes):

in which ti−1,tiare the fill time for node i−1 and node i respectively,and xi−1,xiare their coordinates.ψ is the flow front position between node i−1 and node i.Within each element,permeability Kxxand preform thickness h are assumed to be constant,which corresponds to element in usual FE discretization.The discretized equation for flow-front development between node i−1 and node i can then be written as:

in which ∆xi=xi−xi−1,∆ti=ti−ti−1.The fill time of the part can therefore be obtained by summing flow development time∆t for each element.Fig.7 shows one example of using Eq.9 to calculate the fill time for each node on a homogeneous plate(Fig.7(a)),and the same plate with distribution media(Fig.7(b),in which through thickness resin impregnation is neglected).
3.2 Implementation of the one-dimensional flow model on spatial surfaces
The developed model is then used on the spatial surfaces.To implement the distance prediction of the mold filling time on any curved surface,the FE mesh of the part is treated as a graph.The edges connecting two neighboring nodes are weighted by their length that can be calculate directly from the node coordinates contained in the mesh.Next,Dijkstra’s algorithm is used to calculate the path for the resin to travel along.When using the discretized Eq.9 for 2D elements,the preform thickness is substituted with the channel cross-section area as shown in Fig.8.Resin travel path consists of connected edges across the elements.Flow progression time across each element is represented by:
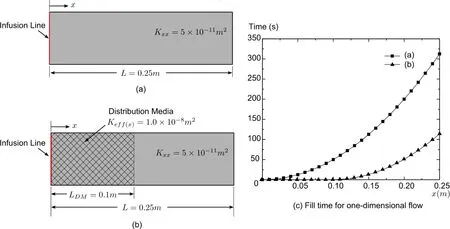
Figure 7:Fill time calculation for one-dimensional flow:(a)no distribution media;and(b)with distribution media.

The channel simplification enables one to model race-tracking channels by assigning the path through race-tracking channels the cross-section area and permeability accordingly.From Eq.10,one can see that because race-tracking channels always have higher permeability,resin travels faster when crossing these channels.Pseudocode for Dijkstra’s algorithm in moving flow front forward is shown below:
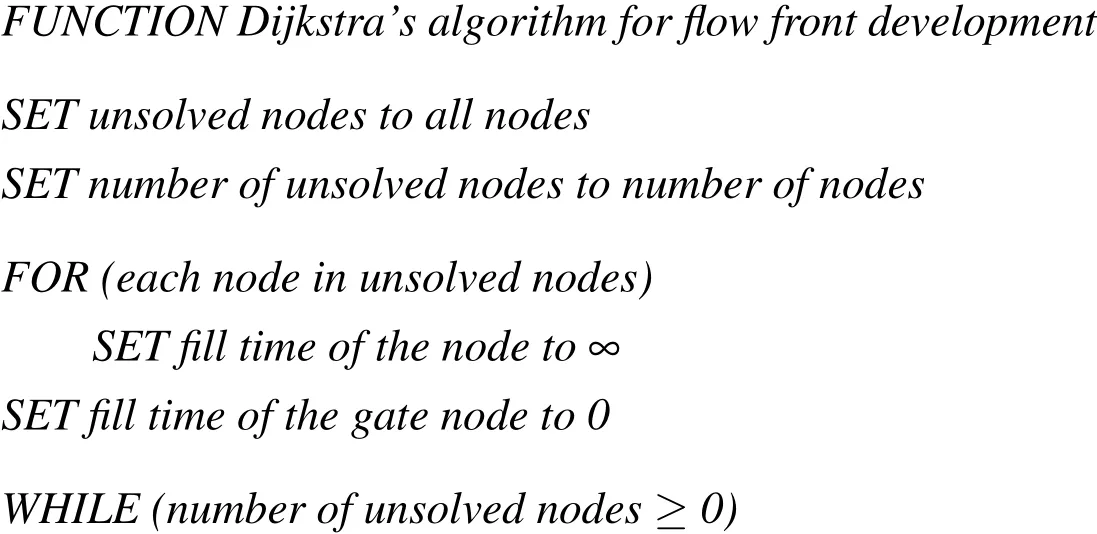
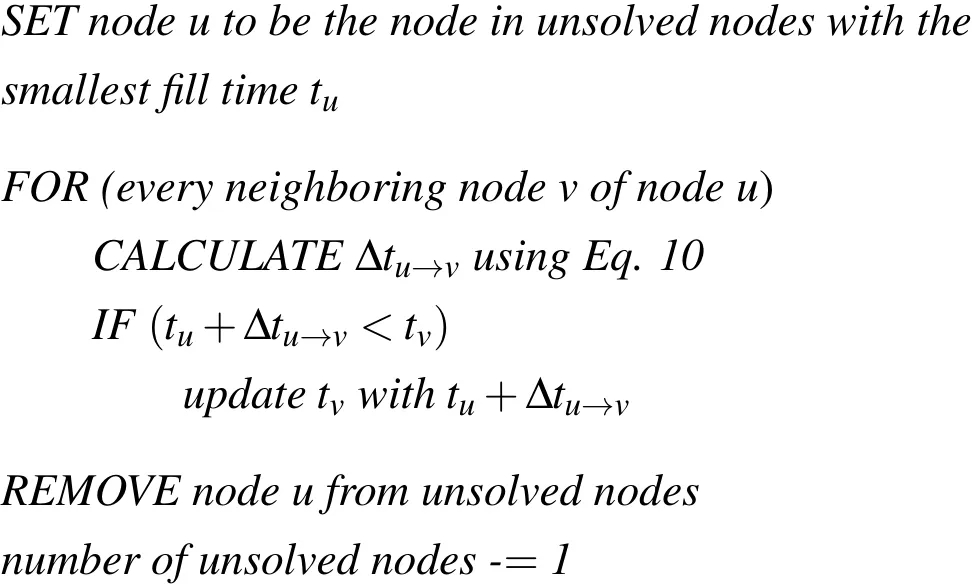

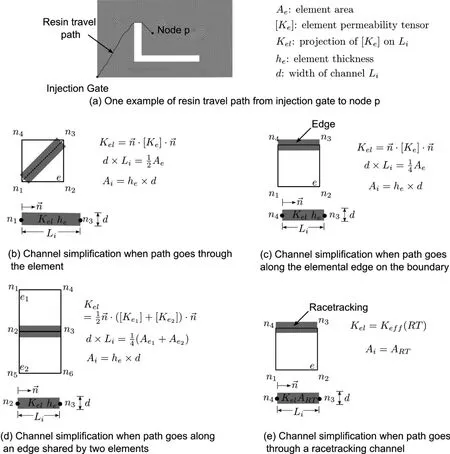
Figure 8:Channel simplification for 2D quadrilateral elements
An example of flow pattern calculation using Dijkstra’s algorithm combined with channel simplification is shown in Fig.9 for the flat plate with an “L”shape cutout,and the fill pattern is then compared with LIMS result.For both sets of results,each node’s fill time is non-dimensionalized by:

in whichtiis fill time calculated for nodei,andtfillis the fill time of the part returned by distance-based method and LIMS respectively.The CPU time cost comparison between these two methods is shown in Fig.10.From the results,one can see that the distance-based model can adequately capture the flow pattern returned by LIMS,however,the savings on CPU time increase significantly as the number of nodes increase.
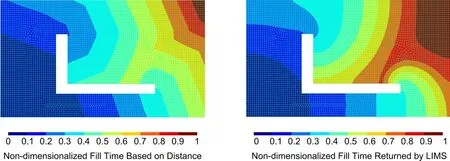
Figure 9:Comparison between distance based fill pattern estimation and LIMS result
3.3 Treatment of permeability variations and the race-tracking channels
Race-tracking channels are simulated as one-dimensional elements,each of which is assigned a permeability in terms of cross-section area.From Eq.(10),because race-tracking channels have a higher permeability,resin travel time is much lower on these edges.Fig.11 shows the simulation results for the plate and 4 disturbances occurring at the cutout channels.Flow pattern returned by distance-based model is compared with LIMS result,and it can be seen that the distance-based model can capture very well the flow disturbances introduced by the race-tracking channels.
3.4 Substitution of distance based flow pattern prediction for robust processing parameters’design
Race-tracking channels can be automatically recognized and a probability model is used to describe the race-tracking strength for each channel.Then distance based
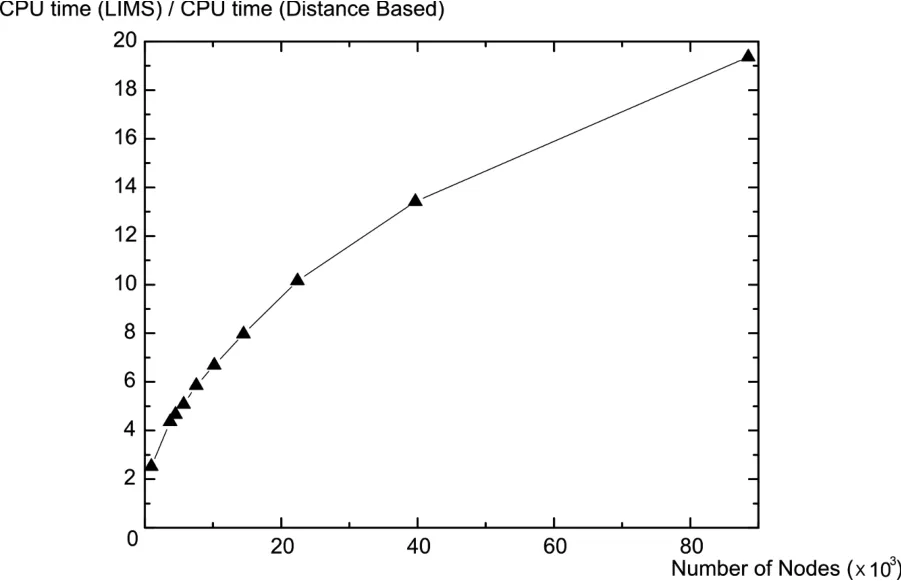
Figure 10:Calculation time cost comparison between distance-based simulation and LIMS simulation as number of nodes increase
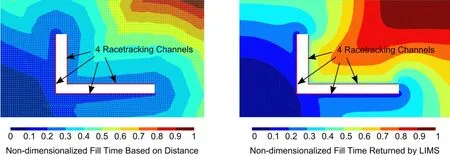
Figure 11:Flow pattern comparison between distance-based method and LIMS when 4 race-tracking channels are present at the plate cutout
method is used to generate mold flow pattern for each scenario in the scenario space.For the example of the plate with “L”shape cutout,seven vent locations are returned by distance-based method and the locations of these vents are the same as the ones obtained from the flow simulation LIMS.
4 Case studies
Some examples that have complicated geometric features and material variability over the surface are explored in this section to demonstrate the versatility,efficiency and accuracy of the distance-based mold filling simulation by comparing the results with FE based LIMS results.
4.1 Box
The box shown in Fig.12 has four edges on the bottom that use higher permeability material.Both distance-based results(Fig.13(a))and LIMS results(Fig.13(b))show that the venting line should be placed on top of the box if the injection gate is set at the center of the bottom.Moreover,possible flow trapping at four corners of the bottom are captured by both sets of simulation results(Fig.13).
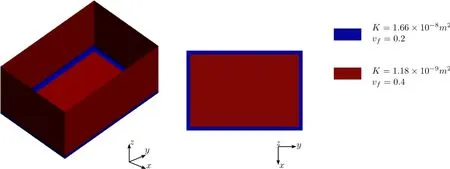
Figure 12:Box with preform permeability variations along the edges
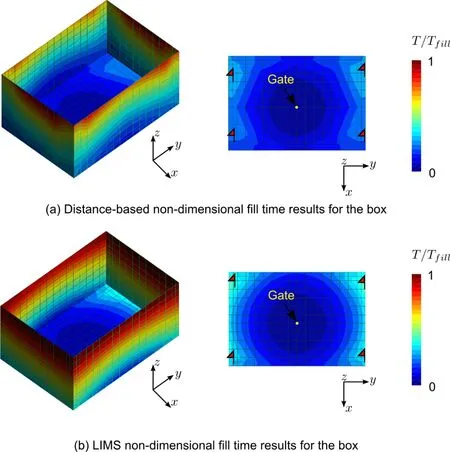
Figure 13:Simulation results comparison between distance-based simulation results and LIMS results,and possible locations of flow entrapment are flagged where vents should be placed
4.2 Drop fairing
The drop fairing shown in Fig.14 is a doubly curved surface and is injected from the center.Distance-method is able to capture the radial-shape flow development along this curved surface.
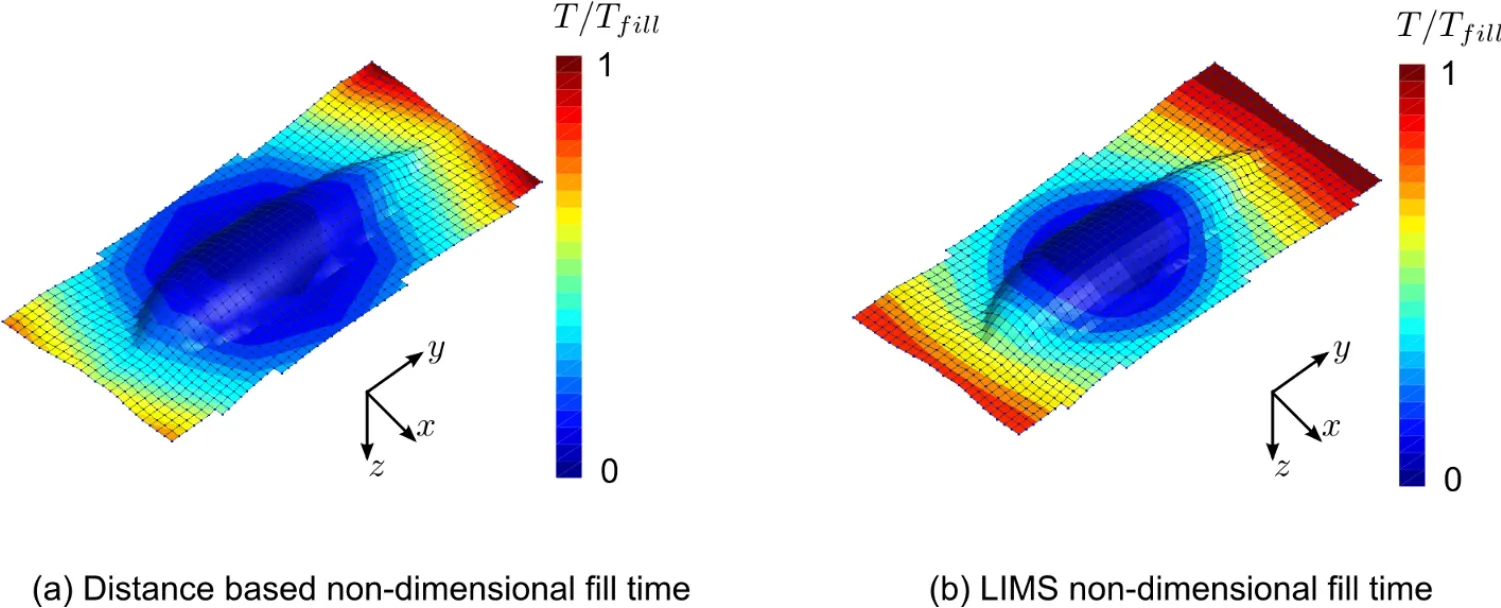
Figure 14:Flow pattern simualtion results for a double-curved drop fairing using distance-based methdo and LIMS
4.3 Humvee hood
A Humvee hood part shown in Fig.15 is con figured with preform whose permeability varies in several locations on the surface.RTM filling simulation results using both distance based method and LIMS are shown in Fig.16 for this Humvee hood with one race-tracking channel located on one side of the surface curvature.It can be shown that the flow pattern are same with these two methods,however,the distance based method reduce the simulation time of 3.46s required by LIMS to 0.104s.These are substantial savings if a scenario space of 256 simulations is analyzed.
4.4 Vent location optimization for trailer with many race-tracking possibilities along the edges
Distance-based method is then used in the creation of the vent fitness map for a trailer shown in Fig.17,in which ten race-tracking channels are detected and 1024 scenarios are generated with the race-tracking strength discretization shown in Fig.18(a).Eight possible vents are located by running the distance-based simulation for all the scenarios(Fig.18(c)),but the simulation time required is reduced from 4.2 hours(with LIMS to run 1024 scenarios)to 8 minutes.
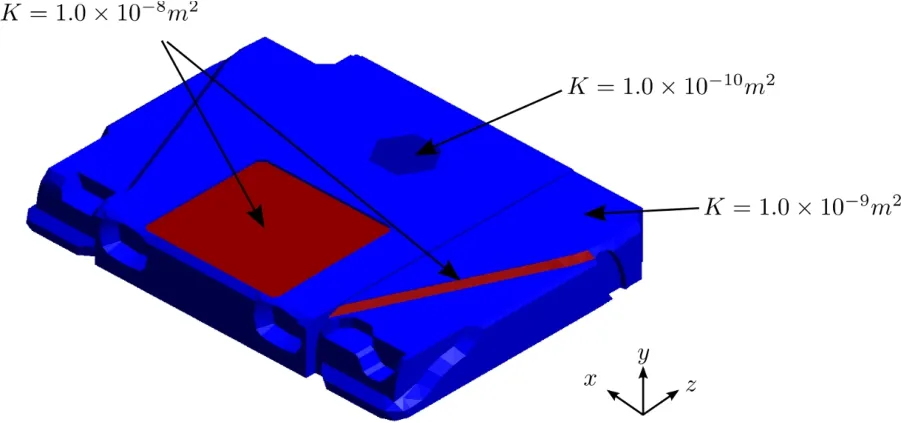
Figure 15:Surface geometry and peform permeability distribution for a humvee hood
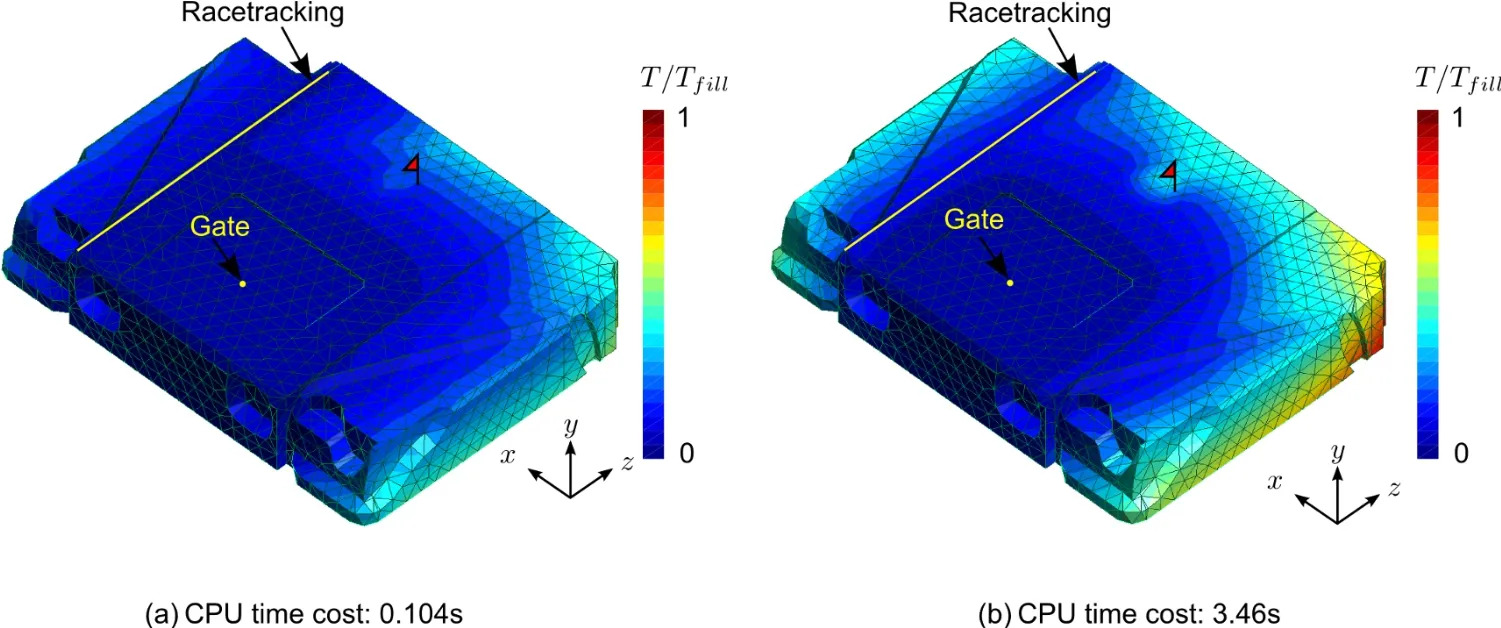
Figure 16:RTM simulation results comparison for the humvee hood:(a)nondimensional fill time results using distance-based method;(b)non-dimensional fill time results returned by LIMS,and possible location of flow entrapment is flagged
5 Summary and Conclusions
A one-dimensional resin impregnation model in the fiber preform is developed to calculate fill time approximation based on the distance from the injection gate.Combined with shortest path searching algorithm,Dijkstra’s algorithm,this model is then implemented on spatial surface meshes to calculate fill time for each node and generate flow development pattern.It has been shown that this distance based model can reduce the filling simulation time approximately by the order ofN/log(N)while preserving the flow pattern accuracy necessary to determine vent locations.Our implementation of this method can include variable material properties within the domain,and also accommodate material variability on the surface and can capture very well the flow disturbances from race-tracking channels.
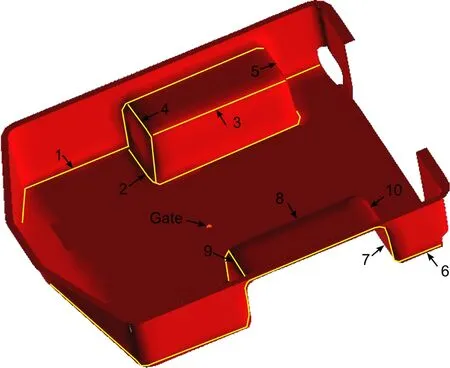
Figure 17:Ten race-tracking channels are detected for the trailer
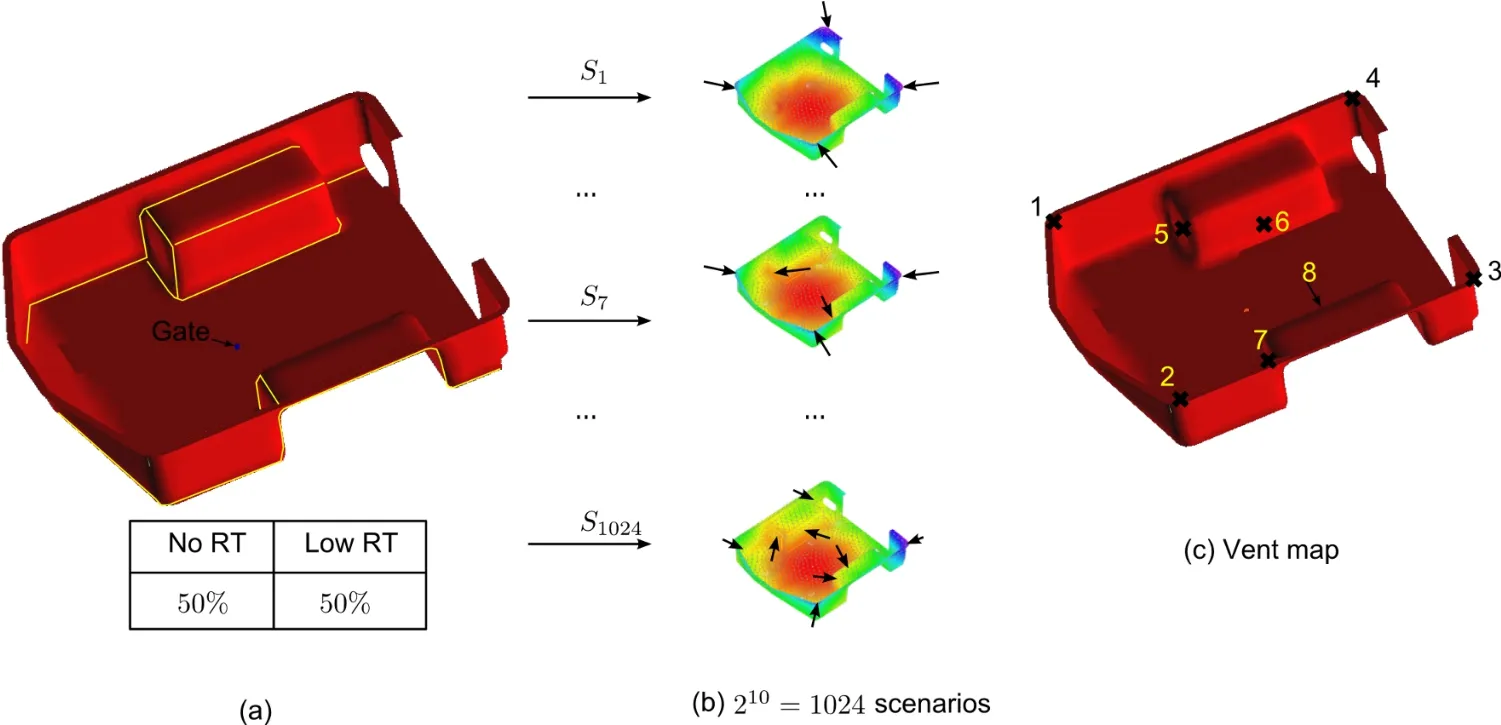
Figure 18:Scenario expansion for the trailer and vent map generation using distance based results.The flow front patern is similar to the one predicted by LIMS,and the difference(distance between the vent locations returned by two methods respectively)is smaller than the size of the vents.
Therefore,this distance-based flow prediction algorithm can save significant CPU time when running a large batch of simulations and provide useful vent fitness map information to the designer in real time.
Acknowledgement:The financial support of this work is provided by the Defense Advanced Research Projects Agency(DARPA)under Orthotic projects for the Center for Composite Materials at the University of Delaware.
Advani,Suresh G.and E.Murat Sozer.2002.Process Modeling in Composites Manufacturing.Vol.59 CRC Press.
Bickerton,Simon and Suresh G.Advani.1999.“Characterization and Modeling of Race-Tracking in Liquidcomposite Molding Processes.”Composites Science and Technology59(15):2215-2229.
Boccard,Alexis,Woo Il Lee,and George S.Springer.1995.“Model for Determining the Vent Locations and the Fill Time of Resin Transfer Molds.”Journal of Composite Materials29(3):306-333.
Bruschke,MV and SG Advani.1994.“A Numerical Approach to Model Nonisothermal Viscous Flow through Fibrous Media with Free Surfaces.”International Journal for Numerical Methods in Fluids19(7):575-603.
Bruschke,MV and Suresh G.Advani.1990.“A Finite Element/Control Volume Approach to Mold Filling in Anisotropic Porous Media.”Polymer Composites11(6):398-405.
Comas-Cardona,S.,S.Bickerton,M.Deleglise,WA Walbran,C.Binetruy,and P.Krawczak.2008.“In fluence of Textile Architectures on the Compaction and Saturated Permeability Spatial Variations.”Recent Adv Text Compos(TexComp-9):3-10.
Comas-Cardona,S.,C.Binetruy,and P.Krawczak.2007.“Unidirectional Compression of Fibre Reinforcements.Part 2:A Continuous Permeability Tensor Measurement.”Composites Science and Technology67(3):638-645.
Dijkstra,Edsger W.1959.“A Note on Two Problems in Connexion with Graphs.”Numerische Mathematik1(1):269-271.
Fredman,Michael L.and Robert Endre Tarjan.1987.“Fibonacci Heaps and their Uses in Improved Network Optimization Algorithms.”Journal of the ACM(JACM)34(3):596-615.
Gokce,Ali and Suresh G.Advani.2004a.“Simultaneous Gate and Vent Location Optimization in Liquid Composite Molding Processes.”Composites Part A:Applied Science and Manufacturing35(12):1419-1432.
——.2004b.“Vent Location Optimization using Map-Based Exhaustive Search in Liquid Composite Molding Processes.”Materials and Manufacturing Processes19(3):523-548.
Hourng,Lih-Wu and Chih-Yuan Chang.1993.“Numerical Simulation of Resin Injection Molding in Molds with Preplaced Fiber Mats.”Journal of Reinforced Plastics and Composites12(10):1081-1095.
Jiang,Shunliang,Chuck Zhang,and Ben Wang.2002.“Optimum Arrangement of Gate and Vent Locations for RTM Process Design using a Mesh Distance-Based Approach.”Composites Part A:Applied Science and Manufacturing33(4):471-481.
Jovanovic,Vojin,Souran Manoochehri,and Constantin Chassapis.2001.“Parameter Estimation for Resin Transfer Molding.”Engineering Computations18(8):1091-1107.
Lawrence,Jeffrey M.,John Barr,Rajat Karmakar,and Suresh G.Advani.2004.““Characterization of Preform Permeability in the Presence of Race Tracking”Composites Part A:Applied Science and Manufacturing35(12):1393-1405.
Lin,Mark,H.Thomas Hahn,and Hoon Huh.1998.“A Finite Element Simulation of Resin Transfer Molding Based on Partial Nodal Saturation and Implicit Time Integration.”Composites Part A:Applied Science and Manufacturing29(5):541-550.
Lugo,J.,P.Simacek,and SG Advani.2014.“Analytic Method to Estimate Multiple Equivalent Permeability Components from a Single Rectilinear Experiment in Liquid Composite Molding Processes.”Composites Part A:Applied Science and Manufacturing67:157-170.
Maier,RS,TF Rohaly,SG Advani,and KD Fickie.1996.“A Fast Numerical Method for Isothermal Resin Transfer Mold Filling.”International Journal for Numerical Methods in Engineering39(8):1405-1417.
Mohan,RV,ND Ngo,and KK Tamma.1999.“On a Pure Finite-element-based Methodology for Resin Transfer Molds Filling Simulations.”Polymer Engineering&Science39(1):26-43.
Šimáˇcek,Pavel and Suresh G.Advani.2004.“Desirable Features in Mold Filling Simulations for Liquid Composite Molding Processes.”Polymer Composites25(4):355-367.
Trochu,F.,R.Gauvin,and D-M Gao.1993.“Numerical Analysis of the Resin Transfer Molding Process by the Finite Element Method.”Advances in Polymer Technology12(4):329-342.
Turner,DZ,KB Nakshatrala,and KD Hjelmstad.2006.“Finite Element Approach to Composite Mold Design Based on Darcy Flow with Velocity Clipping.”Polymer Composites27(1):65-70.
Voller,VR and S.Peng.1995.“An Algorithm for Analysis of Polymer Filling of Molds.”Polymer Engineering&Science35(22):1758-1765.
Wang,J.,E.Andres,P.Simacek,and SG Advani.2012.“Use of Flow Simulation to Develop Robust Injection and Vent Schemes that Account for Process and Material Variability in Liquid Composite Molding Process.”Computer Modeling in Engineering&Sciences(CMES)88(3):155-181.
Young,WB,K.Han Fong,and L.James Lee.1991.“Flow Simulation in Molds with Preplaced Fiber Mats.”Polymer Composites12(6):391-403.
1Department of Mechanical Engineering,University of Delaware,Newark,DE,USA.
2Center for Composite Materials,University of Delaware,Newark,DE,USA.
3Corresponding author E-mail:advani@udel.edu

