Region-based structure line detection for cartoons
Xiangyu Mao,Xueting Liu,Tien-Tsin Wong(),and Xuemiao Xu
©The Author(s)2015.This article is published with open access at Springerlink.com
Region-based structure line detection for cartoons
Xiangyu Mao1,2,Xueting Liu1,2,Tien-Tsin Wong1,2(),and Xuemiao Xu3
©The Author(s)2015.This article is published with open access at Springerlink.com
Cartoons are a worldwide popular visual entertainment medium with a long history.Nowadays, with the boom of electronic devices,there is an increasing need to digitize old classic cartoons as a basis for further editing,including deformation, colorization,etc.To perform such editing,it is essential to extract the structure lines within cartoon images. Traditional edge detection methods are mainly based on gradients.These methods perform poorly in the face of compression artifacts and spatially-varying line colors, which cause gradient values to become unreliable.This paper presents the first approach to extract structure lines in cartoons based on regions.Our method starts by segmenting an image into regions,and then classifies them as edge regions and non-edge regions.Our second main contribution comprises three measures to estimate the likelihood of a region being a non-edge region. These measure darkness,local contrast,and shape. Since the likelihoods become unreliable as regions become smaller,we further classify regions using both likelihoods and the relationships to neighboring regions via a graph-cut formulation.Our method has been evaluated on a wide variety of cartoon images,and convincing results are obtained in all cases.
computational cartoon;edge detection; image processing;image segmentation; line extraction;region analysis
1 Introduction
Cartoonanimation hasalonghistoryand isenjoyed by children and adults.It inspires each new generation of children regardless of era or nationality.Many cartoon companies like Disney and DreamWorks have long been established and have produced many famous cartoons.However,technical restrictions meant that cartoons produced in old times are of low quality.Nowadays,resolutions of household televisions and monitors have become higher and higher;with the rapid development of 3D technologies,cartoons can even be presented in stereo.This has resulted in a trend for highquality,and even stereoscopic,digitizing of classical cartoons.To do so,understanding the cartoon content plays an essential role.Due to the unique characteristics of cartoons where strong lines are used to depict objects,detecting structure lines is a key element in understanding the semantics of cartoons.If the structure lines can be readily and accurately detected,successive segmentation, vectorization,and other editing steps become much easier.
Though edge detection has long been studied, it is still extremely challenging to detect edges which conform to human perception.The Canny edge detector[1]proposed in 1986 is still regarded as the state-of-the-art generaledge detection method.However,in cartoons,structure lines used to depict the objects typically have a certain width.General edge detectors,such as the Canny edge detector,result in a double-edge problem when applied to cartoons(e.g.,see Fig.1(b)).To overcome this problem,several outline detection methods tailor-made for cartoons have been proposed [2-4].However,all these methods extract structure lines based on image gradients.There is a latent assumption in these methods that the input cartoon has relatively high quality so that the gradient is reliable.However,for classic cartoons of low quality,discretewavelettransform (DWT)compression artifacts can make image gradients unreliable(e.g., see Fig.2(a)).Furthermore,gradient-based methods usually involve a thresholding process to determine whether a pixel is an edge pixel.This can lead to both artifacts and missing edge pixels when the edge gradient is not consistent across the image.
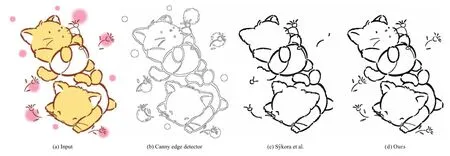
Fig.1 Comparative results on a cartoon image where structure lines are not black.
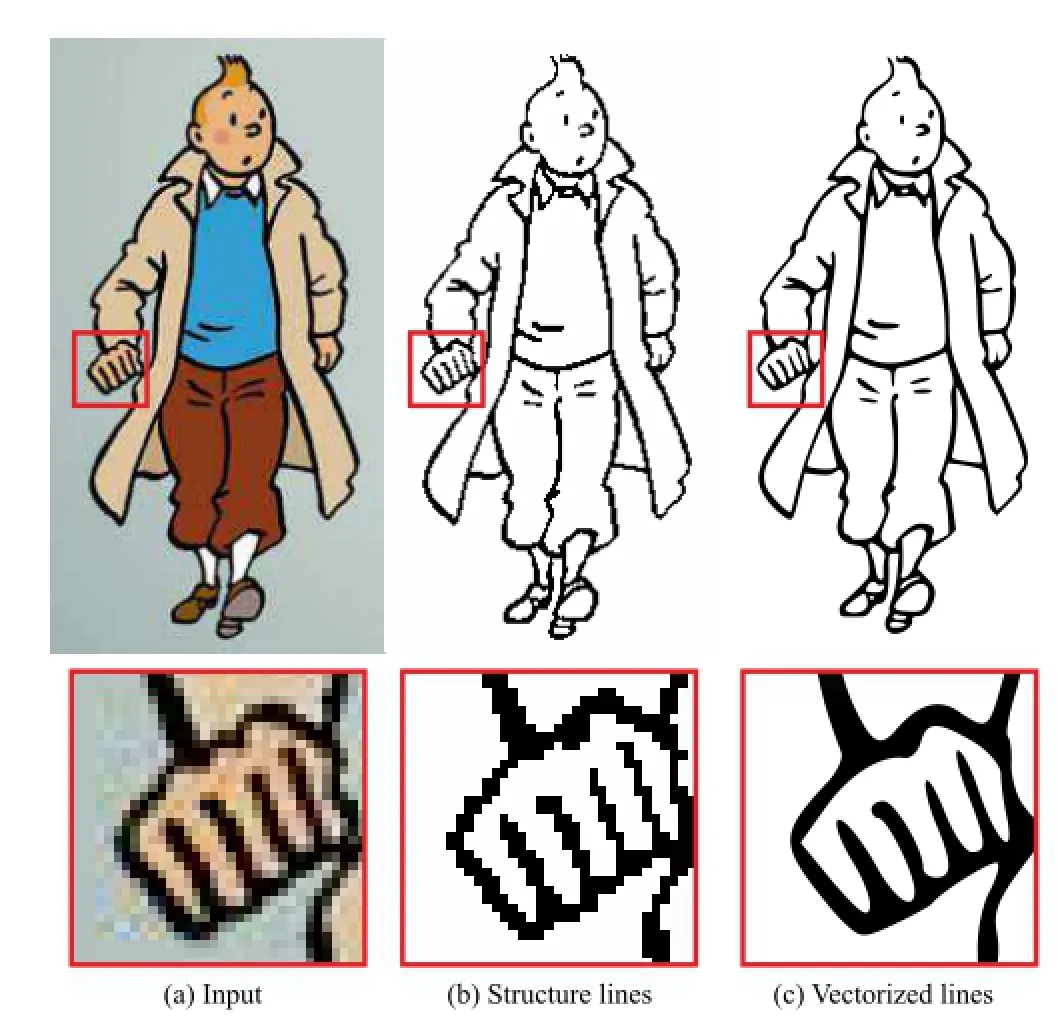
Fig.2 Result,vectorized result,and close-ups for a cartoon image with severe compression artifacts.
In this paper,we propose a novel method to detect structure lines in low-quality cartoons.Instead of relying on image gradients,we extract structure lines based on regions.Thus,we first segment the cartoon image into regions based on color similarity,and then classify regions as edge regions or non-edge regions based on region properties.This approach changes the problem domain from pixel space to region space.Region space provides much more information than pixel space.For example,we may study the shape of the region,the size of the region,and relationships to neighboring regions.This approach does not rely on image gradients and can overcome the problematic color artifacts in low-quality cartoon images.This approach is further supported by the psychological finding that humans perceive edges and regions at the same time when understanding an image.Awareness of edges and awareness of regions mutually influence each other in human perception.
While our approach to extracting structure lines based on regions avoids relying on low-quality image gradients,it is still difficult to classify the regions.This is mainly because pixels depicting structure lines are often over-segmented into a set of small regions due to color artifacts near boundaries.Such small regions cannot be simply classified based on size and shape.We must further consider the neighborhoods of the regions in order to correctly classify regions.Furthermore,structure lines are not necessarily black,and the line widths may spatially vary across the image.However, we observe that even though there may be color artifacts,structure lines in cartoons are generally darker than the surrounding pixels. Furthermore, for sufficiently large regions,the shapes of edge regions are quite different from the shapes of nonedge regions.Using these observations,we first compute the likelihood of a region to be a nonedge region based on its color,local contrast,and shape.We then classify regions into edge regions andnon-edge regions via a graph-cut formulation.The pixels inside edge regions form structure lines which can be vectorized for further editing.This regionbased approach handles both color artifacts and spatial-varying structure lines well.To validate the effectiveness of our method,we have extracted the structure lines from a wide variety of cartoon images, and convincing results were obtained in all cases.
The contributions of this paper are thus as follows:
·We give the first method for extracting cartoon structure lines based on regions instead of image gradients.
·We give three quantitative measures to estimate the likelihood of a region being an edge region or a non-edge region.
·Weprovideanovelgraph-cutformulation for region classification based on both region likelihoods and inter-region relationships.
2 Related work
Edge detection has long been a fundamental research topic in computer vision.Among the vast number of existing works,the mainstream is based on gradient computations(e.g.,[1,5-7])while a small number utilize soft computing approaches[8].
Gradient-based approaches like the Sobel operator, Prewitt operator, and Roberts operator aim to identify edge pixels at which the image brightness changes sharply.When measuring brightness change, thresholding is simply performed.Then the identified pixels are organized into a set of curved line segments to form edges.Edge enhancement techniques can be used to emphasize the intensity changes.The Canny edge detector has long been known but is still recognized as the state-of-the-art edge detection method[1].It suppresses any non-maximum pixels near the maximum value and then uses a hysteresis algorithm with two thresholds to control elimination of false edges.However,this approach is errorprone due to its reliance on thresholding.A low threshold leads to noisy edges while a high threshold fails to identify unclear edges.Moreover,when applied to images with thick edges,which are quite common in cartoons,such methods often result in double-edge problems(see Fig.1(b)).Arbelaez et al.[5]suggested to detect edges in the image by taking gradients of brightness,color,and texture as contour cues,combining local cues in a multiscale way and using spectral clustering to globalize the cues.This method is intended for natural images; it also suffers from thresholding and double-edge problems.Senthilkumaran and Rajesh[8]proposed three soft computing approaches including a fuzzy based approach,a genetic algorithm approach and a neural network approach.However,these soft computing approaches often introduce false edges, and also suffer from thresholding and double-edge problems.
Recently,several edge detection methods have been proposed specifically for finding edges in cartoons.S´ykora et al.[4,9,10]extracted potential edge pixels by applying the Laplacian of Gaussian (LoG)filter followed by a negative mask.They also used adaptive sigma-fitting and flood-filling to overcome the problem of parameter tuning.However, this method imposes a very strong assumption on the input cartoon image,that the darkest point must be an edge point.Furthermore,it also assumesthatedgepixelsarevery likely to be connected into large components.However, in real cases,these strong assumptions may be invalid(see Fig.1(c)).Zhang et al.[3]proposed combining the Canny edge detector and Steger’s linking algorithm[11]to detect decorative lines in cartoon animations.As it is based on the Canny edge detector,it suffers from the same thresholding problems as the latter.Liu et al.[2]proposed an animation stereoscopization system which includes an edge detection step.Edges are extracted by applying adaptive histogram equalization followed by median filtering.Again,this method relies on thresholding due to its gradient-based nature.Unlike existing edge detection methods which are all based on pixel-wise intensity discontinuity,our method avoids thresholding issues by converting the problem from pixel space to region space.
Methods have also been proposed to first segment the image into regions and then extract the boundary pixels of all regions as edge pixels[12].However, these methods cannot tell boundary edges from shading edges and are error-prone in the presence of artifacts.When applied to low-quality images,oversegmentation generally happens and a vast number of noisy edge pixels is detected.In contrast,our method can readily handle over-segmentation bymeans of a graph-cut formulation.
3 Our approach
An overview ofour system is presented in Fig.3.Given an input cartoon image(Fig.3(a)), we first segment it into a set of regions whose pixels are similar in color(Fig.3(b)).Next,we assess how likely it is that each region is a nonedge region based on its shape,intensity,and local contrast(Fig.3(c)).Finally,based on the computed likelihoods,we classify the regions as edge regions and non-edge regions via a graph-cut formulation (Fig.3(d)).Pixels inside the edge regions form the structure lines of the input image(Fig.3(e)).Since our method is based on regions instead of pixels, it is more robust than the existing methods in the presence of severe artifacts.We give details of image segmentation,likelihood computation,and graphcut formulation in the rest of this section.
3.1 Image segmentation
As the first step of our method,we segment the input image into regions based on color similarity.Since noise commonly exists in digital images due to DWT compression,a Gaussian filter(with kernel size 3)is first applied to smooth the image and reduce visible noise.One might hope that,starting from the smoothed image,traditional edge detectors could avoid the double-edge problem by finding local maximums.However,structure lines in a cartoon image may vary in width(e.g.,see Fig.4(a)).In order to extract a single edge for each structure line,the kernel size of the Gaussian filter would need to be larger than the maximum line width anywhere in the whole image.However,such a filter would over-smooth structure lines of small widths, causing them to fail to be detected.In contrast, our method successfully extracts structure lines with varying width(see Fig.4(b)).
After Gaussian smoothing,we segment the cartoon image into regions by grouping pixels with similar colors.While this strategy may result in oversegmentation when applied to natural images,it is quite suitable for cartoon images.Color changes at almost every pixel in natural images due to the rich content in the natural world.However, cartoon images usually contain large textureless regions inside which colors seldom change.Our image segmentation is similar to the well-known mean-shift method[13]which also performs image segmentation based on color similarity.To avoid over-segmentation,the mean-shift method merges too-small regions according to region color.In contrast,we resolve over-segmentation via a graphcut formulation based on both region color and region shape.
We first segment the image into color clusters and then extract regions according to connectivity.Given an image I,we first randomly select a pixel q and use its color I(q)as the starting color(Fig.5(a)).Pixels that have similar colors to this starting color form the initial color cluster(see Fig.5(b)).We formally define the function Ψ which determines whether a pixel p belongs to a color cluster with average color c as

where β is the bandwidth parameter which controls the color range that a color cluster can cover.If β is too large,edge regions and non-edge regions may be merged together.If it is too small,the regions become too fragmented,making subsequent likelihood measures less reliable.Empirically,β is set to a value within[0.02,0.1].As each color clusteris updated,its average color c is also updated accordingly:

Fig.3 System overview.

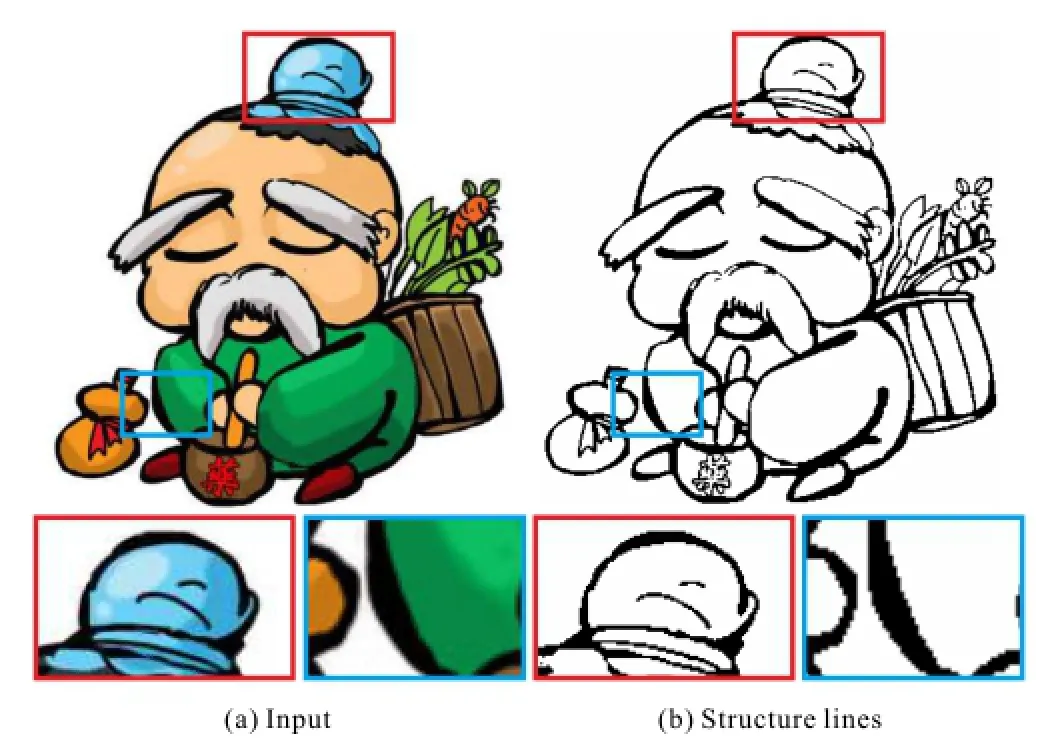
Fig.4 Result and close-ups of a cartoon image with spatiallyvarying line widths.Image courtesy of kukupang.
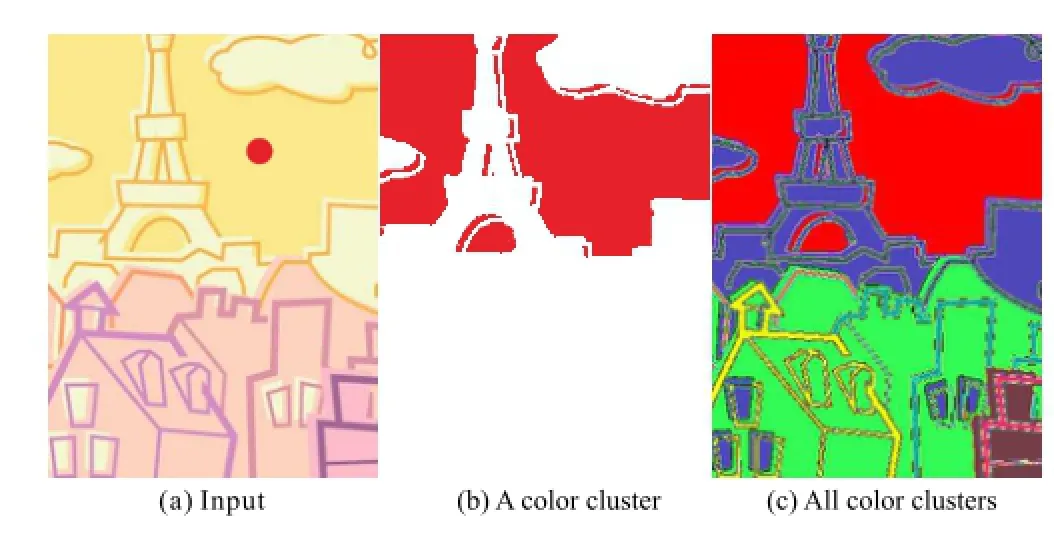
Fig.5 Image segmentation process.
Using the newly updated average color,pixels inside the color cluster are updated again accordingly.This cyclic process stops when the color cluster changes no further.The pixels inside this color cluster are marked as visited.We then repeat the process using the unmarked pixels to find the second color cluster,and so on,until every pixel lies inside some color cluster(see Fig.5(c)).Finally,we extract the regions from the color clusters based on connectivity (Fig.3(b)).Note that a large number of small regions can arise due to compression artifacts.We explain how to handle these small regions later,using our graph-cut formulation.Our region-based approach that makes our method robust to compression artifacts.
3.2 Edge regions and non-edge regions
Aftersegmenting theimageinto regions,our next objective is to classify each region as an edge region or a non-edge region.We use several observations.Firstly,structure lines in cartoons are not necessarily black but only locally darker than the neighboring regions,in order to clearly depict objects(see e.g.,Figs.1(a)and 3(a)).Therefore, naive thresholding will not work(see Fig.6(c)).Our second key observation is that edge regions usually have“slender”shapes(see Fig.7(b)),while non-edge regions are generally“fatter”(see Fig.7(c)).Our last observation is that many small regions exist between edge regions and non-edge regions due to anti-aliasing and compression artifacts.Using the above observations,we assess the likelihood of that a given region is a non-edge region based on its color, local contrast,and shape.Formally,for a region r,the likelihood that it is a non-edge region is defined as
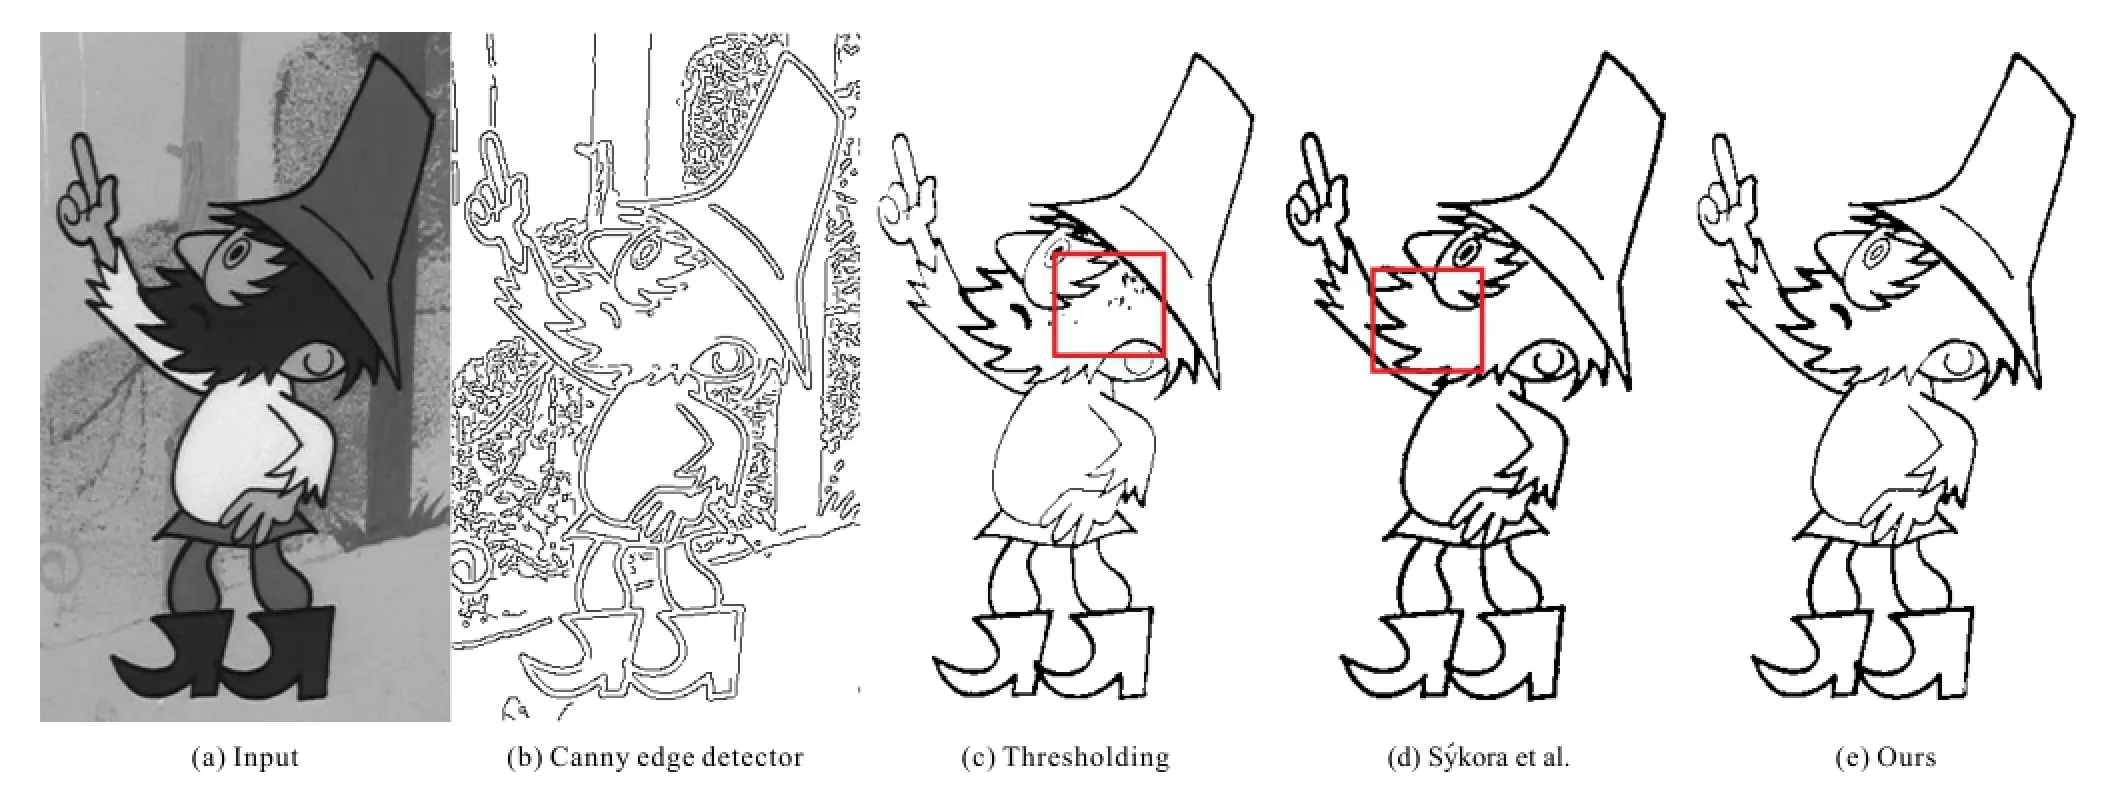
Fig.6 Results and comparison for an old black-and-white cartoon image.Note the artifacts and missing edges in(c).Structure lines that depict details such as the mouth are missing in(d).
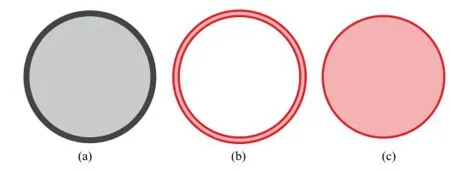
Fig.7 (a)An edge region and a non-edge region.(b)The edge region has a“slender”shape. (c)The non-edge region has a“fat”shape.

where Kr,Tr,and Srare respectively a darkness measure,a local contrast measure,and a shape measure of region r.These three measures quantitatively define how likely a region is a nonedge region as we now explain.
Darkness measure.Structure lines are usually dark.In classical black-and-white cartoons,the structure lines are typically black.This custom was largely inherited when cartoons changed from blackand-white to color.Today,even though the artists are no longer restricted to black color only,the colors they choose for drawing structure lines are still dark colors in most cases.Therefore,the first measure we adopt for classifying edge regions and non-edge regions is a darkness measure,and it is defined as

where cris the average color of region r,and G is a function which converts a 3-channel RGB color to a single grayness value.Smaller values of darkness imply that the region is more likely to be an edge region(see Fig.8(a)).
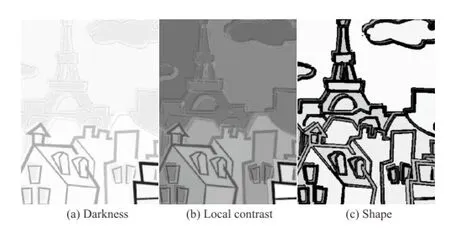
Fig.8 Visualization of region classification measures for the regions in Fig.3(b).
Local contrast measure.Since edge regions are always darker than the neighboring regions while non-edge regions are not,we adopt local contrast as our second measure.This measure calculates how much darker the region is compared to neighboring regions,and is defined as

where Nris the set of pixels that are within the neighborhood of r.The neighborhood of r looks like a boundary band expanded from r.The expanded bandwidth should be larger than the maximal structure line width(less than 10 in general cases) in case that structure lines is segmented into a set of small regions.Intuitively,this measure calculates the ratio between the region’s grayness and the average grayness of surrounding pixels.k is a preset value and works as a weighting factor(k=2 in all our experiments).The smaller Tris,the more likely this region is an edge region(see Fig.8(b)).
Shape measure.Using color and local contrast alone, dark non-edge regions can easily be misclassified as edge regions.Therefore,we also use a shape measure,defined as

where arand prare respectively the area size and perimeter of r;we count the number of pixels touching neighboring regions to determine the perimeter.This rough shape descriptor assesses the“slenderness”of a region.“Slender”regions (see Fig.7(b)),have relatively low area and long perimeter;there is a high probability that such regions are edge regions.“Fat”regions(see Fig.7) have relatively high areas and short perimeters;there is a high probability that such regions are non-edge regions(see Fig.8(c)).Note that this only works well for regions of sufficiently large area;for regions containing only a few pixels,this measure is less meaningful.
The final likelihood that a region is a non-edge region is computed as the product of the three measures(see Fig.3(c)),a larger value indicating that this region is more likely to be a non-edge region.However,in images with DWT compression artifacts(see Fig.9(a)),a single perceptual non-edge region may be segmented into a set of small regionswhich may exhibit similar features to edge regions (see Fig.9(b)).Furthermore,many small regions arise due to anti-aliasing and their likelihoods are unreliable.In order to resolve this problem, we further classify regions based on both region likelihoods and inter-region color similarities via a graph-cut formulation.
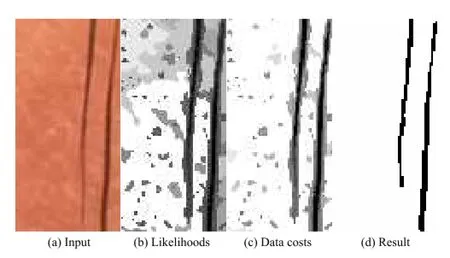
Fig.9 The graph-cut process.?
3.3 Region classification via graph-cut
In our graph-cut formulation,each region r is formulated as a non-terminal node nr.Each nonterminal node is connected to two terminal nodes, a source and a sink.If graph-cut labels a nonterminal node nrwith the source label,it means that region r is an edge region.Otherwise,region r is a non-edge region.The costs associated with the edges connecting non-terminal nodes are called data costs.The data cost measures how likely a region is to be an edge region(source)or a non-edge region (sink).We model the data costs from the computed region likelihoods as

where

normalizes region likelihood Lrto the range[0,1] (see Fig.9(c)).α0and α1are two empirical thresholds setto 0.2 and 0.8 respectively in allour experiments.aris the area size of region r and it measures the reliability of the computed region likelihood.As mentioned above, likelihoods of regions with larger area sizes are more reliable.Therefore,larger costs are associated with the corresponding edges to reinforce reliable classifications suggested by the region likelihoods.
When region likelihoods are not reliable,we identify whether a region is an edge region or a non-edge region based on its color similarities to the neighboring regions.To do so,for every pair of neighboring regions r and r',we create an edge to link the corresponding nodes nrand nr'.The costs associated with edges linking non-terminal nodes are called smoothness costs.The smoothness cost measures how likely the two regions fall into the same category(edge region or non-edge region).We model the smoothness cost between two regions r and r'according to the their color difference as

where

normalizes the average color crof region r so that the color difference between two colors lies in the range[0,1].
The overall energy function is

where s ∈ {source,sink}is the label,sris the label of nr,ω is a weight set to 0.1 in all our experiments,and Ψ(s,s')returns 1 if s is different from s'and 0 otherwise.Finding the minimum cut of the graph that minimizes the above energy function labels each node as either source or sink,which determines whether the corresponding region is an edge region or a non-edge region.The pixels inside all the edge regions together form the structure lines of the input image(see Figs.3(e)and 9(d)).We can see that structure lines are successfully extracted while artifacts are avoided.
4 Results and discussion
To validate the effectiveness of our method,we have extracted the structure lines from a wide variety of cartoon images from classical blackand-white cartoons to color cartoons with and without compression artifacts.Convincing results were obtained in all cases.
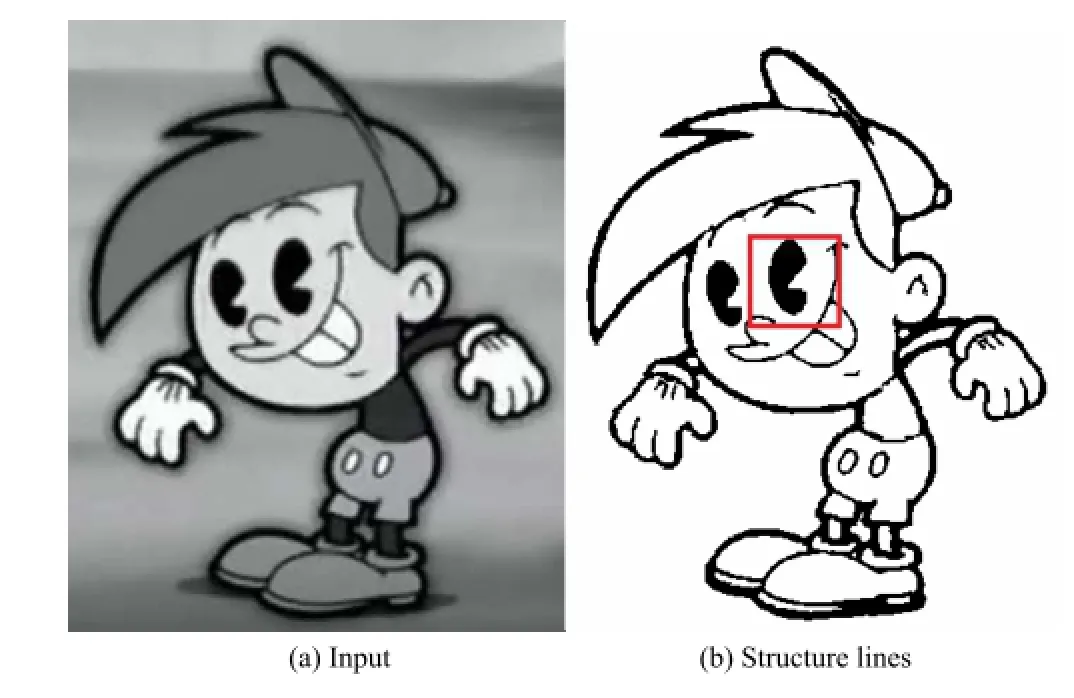
Fig.10 Result for a cartoon image with low quality and shadows.Image courtesy of Nicktoons.
In Figs.6 and 10,we extract the structure lines from two classical black-and-white cartoon images.Figure 6 compares our resuls with those produced by a Canny edge detector,intensity thresholding, and the method in S´ykora et al.[4].While the Canny edge detector leads to a double-edge problem,thresholding on intensity also performs poorly since dark pixels inside nonedge regions are easily confused with structure line pixels.While S´ykora et al.extracted structure lines without double-edge and artifact problems,they fail to extract the structure lines depicting certain details such as the mouth,due to their strong assumption that structure line pixels usually form a large black connected component.In contrast,our method successfully extracts the structure lines for such details too.
In Fig.4,we show a color cartoon with varywidth structure lines.As shown in the two closeups,the minimal line width over the image is only a single pixel,while the maximal line width is more than 10 pixels.Our method successfully extracts all structure lines,including those belonging to small details,such as the beard,the leaves,and the Chinese character.In Figs.1 and 3,we show two further cartoon images where line widths not only vary in space,but line colors also change.As the results show,our proposed measures can correctly identify the structure lines even if they are not black.The structure lines in Fig.3 are even drawn with light colors.We also compare our result with use of the Canny edge detector and the method of S´ykora et al.in Fig.1.The latter performs poorly on this kind of cartoon image.Structure lines depicting details are largely missing since they are disconnected and do form large enough connected components.In comparison,our method does not make any assumption about the length of structure lines,and therefore handles this image well.
Figure 11 shows a modern cartoon style where the structure lines are quite complex,particularly when depicting the hair and the eyes.As shown in the close-up, the extracted structure lines successfully preserve the details.While there are sharp intensity changes in the girl’s ribbons,these texture edges are not preserved as there are no strong structure lines.Figure 12 shows a cartoon in sketching style.Such a sketching style with texture patterns typically makes gradient domain processing unreliable,with gradient-based methods extracting many false edges in such areas.Figure 2 shows an old cartoon with low resolution and compression artifacts.The close-up of the right hand side showsthat the image is heavily influenced by compression artifacts and gradients are quite unreliable.The result validates the effectiveness of our method (see Fig.2(b)).We can for example vectorize the extracted structure lines via Potrace[14]for further editing(see Fig.2(c)).
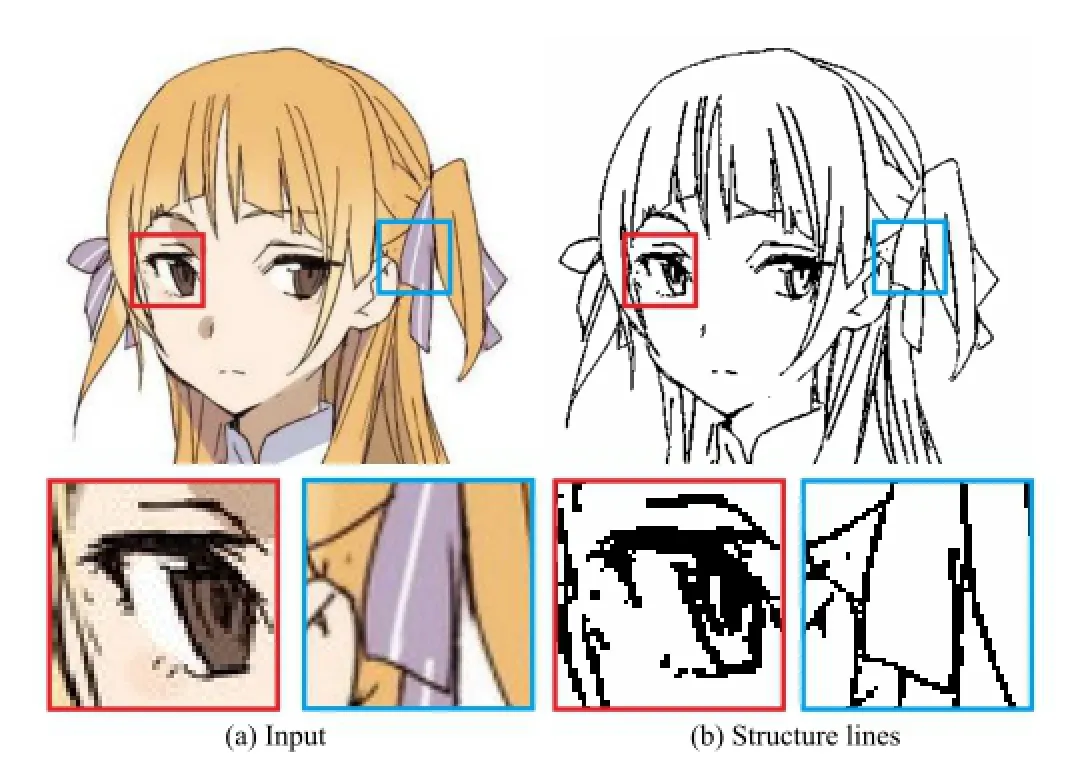
Fig.11 Result and close-ups for a cartoon image with complex structure lines.Image courtesy of BUNBUN.
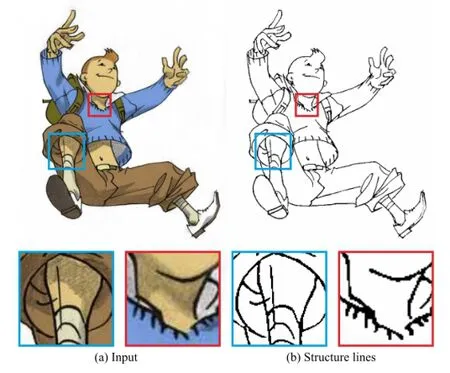
Fig.12 Result and close-ups for a cartoon image in sketch style.Image courtesy of Shaun O’Neil.
Limitations. One limitation lies in the assumption that structure lines and neighboring regions are separable in nature.Although strong structure lines exist in most cases,it can happen that structure lines are inseparable from their enclosing regions(see the eye in Fig.10(b)).In such cases, the whole region is recognized as a single edge region or a single non-edge region as the pixels are continuous in intensity.Another limitation is that currently our method is not deterministic due to the way image segmentation works-our current segmentation method extracts color clusters randomly and greedily.We hope to further explore global methods which may help to segment the image in an optimal way.
5 Conclusions
This paper gives the first approach to extracting structure lines in cartoons based on regions.Unlike traditional edge extraction methods that are mainly based on gradients,our region-based approach is more robust in the presence of compression artifacts, spatially-varying line widths,and spatially-varying line colors.Our method starts by segmenting an image into regions,and then classifies them as edge regions and non-edge regions.We have given three measures-a darkness measure,a local contrast measure,and a shape measure-to estimate the likelihood of a region being a non-edge region.Since the likelihoods become unreliable for very small regions,we finally classify regions based on both the likelihoods and the relationship between neighboring regions,using a graph-cut formulation.We have applied our method to a wide variety of cartoon images,and the extracted structure lines conform to human expectations in all our experiments.Our method can benefit all kinds of cartoon applications from vectorization to colorization.
Acknowledgements
This project was supported by National Natural Science Foundation of China(Nos.61272293 and 61103120), Shenzhen Basic Research Project (No.JCYJ20120619152326448),Shenzhen Nanshan Innovative Institution EstablishmentFund (No. KC2013ZDZJ0007A),the Research Grants Council of the Hong Kong Special Administrative Region under RGC General Research Fund(No.CUHK 417913),and Guangzhou Novo Program of Science &Technology(No.0501-330).
Open Access This article is distributed under the terms of the Creative Commons Attribution License which permits any use,distribution,and reproduction in any medium,provided the original author(s)and the source are credited.
[1]Canny, J.A computationalapproach to edge detection.IEEE Transactions on Pattern Analysis and Machine Intelligence Vol.PAMI-8,No.6,679-698, 1986.
[2]Liu,X.;Mao,X.;Yang,X.;Zhang,L.;Wong,T.-T.Stereoscopizing cel animations.ACM Transactions on Graphics Vol.32,No.6,Article No.223,2013.
[3]Zhang,S.-H.;Chen,T.;Zhang,Y.-F.;Hu,S.-M.; Martin,R.R.Vectorizing cartoon animations.IEEE Transactions on Visualization and Computer Graphics Vol.15,No.4,618-629,2009.
[4]S´ykora,D.;Buri´anek,J.;ˇZ´ara,J.Unsupervised colorization of black-and-white cartoons. In: Proceedingsofthe3rd internationalsymposium on Non-photorealistic animation and rendering, 121-127,2004.
[5]Arbelaez,P.; Maire,M.; Fowlkes,C.; Malik, J. Contour detection and hierarchical image segmentation. IEEE Transactions on Pattern Analysis and Machine Intelligence Vol.33,No.5, 898-916,2010.
[6]Prewitt, J. M. S. Object enhancement and extraction. In: Picture Processing and Psychopictorics.Lipkin,B.;Rosenfeld,A.Eds.New York,NY,USA:Academic Press,15-19,1970.
[7]Roberts, L.G.Machine Perception ofThree-Dimensional Solids.Garland Publishing,1963.
[8]Senthilkumaran,N.; Rajesh,R.Edgedetection techniquesforimagesegmentation—a survey of soft computing approaches.International Journal of Recent Trends in Engineering Vol.1,No.2,250-254, 2009.
[9]S´ykora,D.;Buri´anek,J.;ˇZ´ara,J.Sketching cartoons by example.In:Proceedings of the 2nd Eurographics Workshop on Sketch-Based Interfaces and Modeling, 27-34,2005.
[10]S´ykora, D.; Buri´anek, J.; ˇZ´ara, J. Video codec for classical cartoon animations with hardwareaccelerated playback.In: Advances in VisualComputing.Lecture Notes in Computer Science Volume 3804.Bebis,G.;Boyle,R.;Koracin, D.;Parvin,B.Eds.Berlin Heidelberg,Germany: Springer,43-50,2005.
[11]Steger, C.An unbiased detectorofcurvilinear structures.IEEE Transactions on Pattern Analysis and Machine Intelligence Vol.20,No.2,113-125, 1998.
[12]Comaniciu,D.;Meer,P.Mean shift analysis and applications.In:The Proceedings of the Seventh IEEE International Conference on Computer Vision,Vol.2, 1197-1203,1999.
[13]Fukunaga,K.;Hostetler,L.The estimation of the gradient of a density function,with applications in pattern recognition. IEEE Transactions on Information Theory Vol.21,No.1,32-40,1975.
[14]Selinger, P.Potrace: A polygon-based tracing algorithm. 2003. Available at http://potrace. sourceforge.net/potrace.pdf.

Xiangyu Mao received his B.S.degree in computer science from The Chinese University of Hong Kong in 2012.He is currently a Ph.D.candidate in the Department of Computer Science and Engineering,The Chinese University of Hong Kong.His research interests include computer graphics,computer vision,computationalmanga and anime,and nonphotorealistic rendering.

Xueting Liu received her B.S.degree from Tsinghua University and Ph.D. degree from The Chinese University of Hong Kong in 2009 and 2014, respectively.She is currently a postdoctoral research fellow in the Department of Computer Science and Engineering,The Chinese University of Hong Kong.Her research interests include computer graphics,computervision,computationalmangaand anime,and non-photorealistic rendering.

Tien-Tsin Wong received his B.S., M.Phil.,and Ph.D.degrees in computer science from The Chinese University of Hong Kong in 1992,1994,and 1998, respectively.He is currently a professor in the Department of Computer Science and Engineering,The Chinese University of Hong Kong.His main research interests include computer graphics,computational manga,precomputed lighting,image-based rendering,GPU techniques,medical visualization,multimedia compression, and computer vision.He received the IEEE Transactions on Multimedia Prize Paper Award in 2005 and the Young Researcher Award in 2004.

Xuemiao Xu received her B.S.and M.S. degrees in computer science and engineering from South China University of Technology in 2002 and 2005,respectively,and Ph.D.degree in computer science and engineering from The Chinese University of Hong Kong in 2009.Sheiscurrently an associate professor in the School of Computer Science and Engineering,South China University of Technology. Her research interests include image similarity measurement, digital manga and cartoons,intelligent transportation based on image analysis,and biometric recognition.
1The Chinese University of Hong Kong,Hong Kong, China.E-mail:xymao@cse.cuhk.edu.hk,xtliu@cse.cuhk. edu.hk,ttwong@cse.cuhk.edu.hk().
2Shenzhen Research Institute,The Chinese University of Hong Kong,Shenzhen,China.
3South China University of Technology,Guangzhou, China.E-mail:xuemx@scut.edu.cn.
Manuscript received:2014-10-24;accepted:2015-02-09
 Computational Visual Media2015年1期
- Computational Visual Media的其它文章
- SymmSketch:Creating symmetric 3D free-form shapes from 2D sketches
- Poisson disk sampling through disk packing
- Least-squares images for edge-preserving smoothing
- Edge-preserving image decomposition via joint weighted least squares
- Panorama completion for street views
- Salt and pepper noise removal in surveillance video based on low-rank matrix recovery
