Huludao Hongyue Group Signed Huludao Northern Copper Cooperation Agreement With Jiangxi Copper Industry Group
Huludao Hongyue Group Signed Huludao Northern Copper Cooperation Agreement With Jiangxi Copper Industry Group
On November 29, the Huludao Northern Copper cooperation project jointly created by Huludao Hongyue Group and Jiangxi Copper Corporation held ceremonious contract-signing ceremony at Huludao Hotel. Mayor Du Benwei and Vice Mayor Yang Wei of Huludao City, Yu Hong, Chairman of Hongyue Group, officials of Huludao Nonferrous Company, Chen Yonghua, Secretary of the Party Committee of Jiangxi Province State-owned Assets Supervision and Administration Commission, Cai Zhengsun, Jiangxi Province Director of State-owned Assets Supervision and Administration Commission Office, Chairman Li Baomin and Secretary of Party Committee Wang Bo of Jiangxi Copper Corporation, as well as chief persons of related departments attended the contract-signing ceremony.
Yu Hong, Chairman of Hongyue Group, Li Baomin, Chairman of Jiangxi Copper Corporation, delivered enthusiastic speeches at the ceremony.
Chen Yonghua, Secretary of Party Committee of Jiangxi Province State-owned Assets Supervision and Administration Commission, delivered speech, in which he warmly congratulated the successful holding of the signing ceremony. He hoped both sides to use the Huludao copper smelting project as the starting point, be frank with each other in cooperation, develop consensus, leverage advantage to develop strength, seek common development, and accomplish the desired target. He hoped that through common efforts from all sides, the cooperation between Jiangxi Copper Corporation and Hongyue Group would bear fruits, and serve as the starting point for continuing to acquire still greater new accomplishments along the road of cooperation.
Yang Wei, Vice Mayor of Huludao City, emphasized in his speech that, this time Huludao Hongyue Group joined hands with Jiangxi Copper Corporation, by relying on Jiangxi Copper Corporation’s rich mineral resources, developed sales network and powerful capital support, along with complete process equipment and substantial technological strength of China Metallurgical Huludao Nonferrous Metal Group, by taking advantage of the world’s leading Ausmelt oxygen-enriched top-blown bath smelting technology , to jointly build Huludao Hongyue Northern Copper Co., Ltd, to blaze a new trail of mixed ownership development, it would surely exert positive promoting influence on Huludao’s adjustment of industrial structure, and smooth and healthy economic development. Huludao CPC Municipal Committee and the municipal government would continue to support project construction and enterprise development, provide the most preferential policies, the mot lenient environment and the most efficient services to jointly create a better future for Huludao.
At the ceremony, Yu Hong, Chairman and legal representative of Huludao Hongyue Group, and Li Baomin, Chairman and Legal Representative of Jiangxi Copper Corporation, together signed Huludao Northern Copper project cooperation agreement.
Since last year, Huludao Nonferrous Metal Group and Huludao Zinc Industry Co., Ltd successfully accomplished re-integration and restructuring, Huludao Hongyue Group successfully purchased stocks, the old enterprise radiated brimming vigor. After a hard battle lasting over 150 days, Huludao Northern Copper successfully repaired Ausmelt furnace, electric furnace, converter furnace and supporting power generation system, and acid-making system, on November 1, 2014 it successfully produced the first furnace of crude copper, with copper grade above 99%, This signaled that Ausmelt copper smelting system which had stayed idle for 5 years recorded complete success in its first production. After the project reaches designed capacity, each year it will produce 100,000 tonnes of crude copper, 420,000 tonnes of sulfuric acid, 1 tonne of gold, 100 tonnes of silver, its operating income will top 5.5 billion yuan.
Unit: metric ton

Name of province or cityProduction inNovember. 2014Total outputJan.-Nov. 2014% Change2013-2014 Hebei9261125328-11.98 Shanxi1675912790765.1 Inner-Mongolia2032325114415.99 Liaoning113016876-69.68 Shanghai105918891613.16 Jiangsu25205274817-0.87 Zhejiang2387526692213.85 Anhui11540911847507.75 Fujian194452065653.2 Jiangxi11153812236804.78 Shandong111378105002517.81 Henan2737920545631.31 Hubei459384564740.52 Hunan171321032-23.11 Guangdong10677111562-2.45 Sichuan79519497154.09 Yunnan483614619646.19 Tibet Shaanxi8696937.45 Gansu10056980258011.46 Xinjiang972372214114.81 Total output China755492716726411.49
Unit: metric ton

Name of province or cityProduction inNovember. 2014Total outputJan.-Nov. 2014% Change2013-2014 Zhejiang2171802266.07 Jiangxi23001964230.39 Hunan55544253744.15 Guangxi6181319215.04 Yunnan8539891068.95 Total output China1735116779520.89
Unit: metric ton

Name of province or cityProduction inNovember. 2014Total outputJan.-Nov. 2014% Change2013-2014 Shanxi62145766555-19.41 Inner-Mongolia21420921414525.63 Liaoning18657224701-16.24 Jiangsu3612501-76.31 Zhejiang6133436-95.5 Fujian11715130483-4.17 Shandong22599123808336.58 Henan28446530975102.31 Hubei17023180922-15.48 Hunan25803304181-0.88 Guangxi49260468243-21.89 Chongqing5343957236486.79 Sichuan38513400423-22.72 Guizhou61207574593-44.37 Yunnan872579279285.81 Shaanxi5182261675450.05 Gansu18756519415116.76 Qinghai19941521443244.98 Ningxia1117611266155-7.8 Xinjiang426166381076971.4 Total output China2128096219802257.13
Unit: metric ton
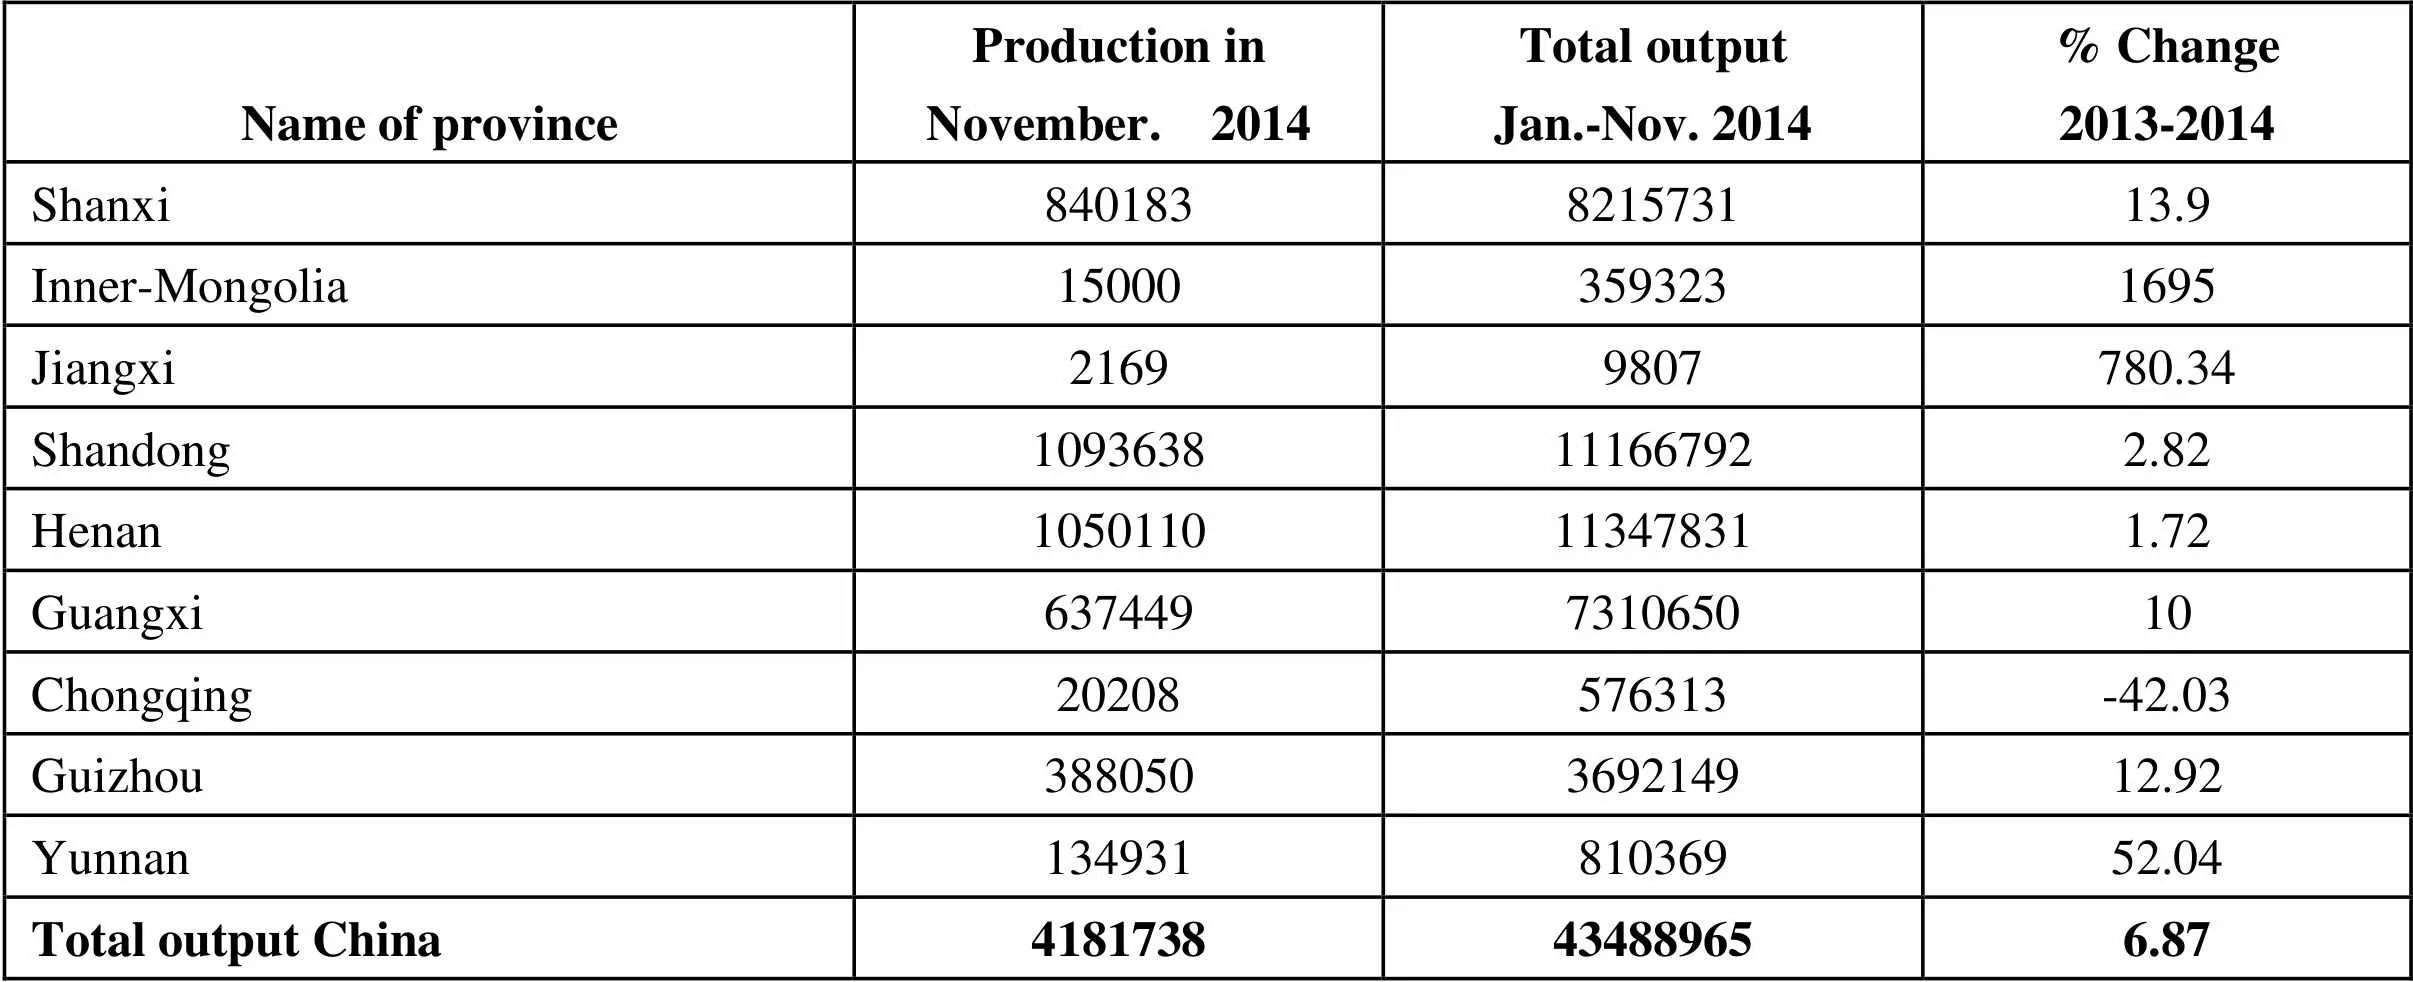
Name of province Production inNovember. 2014Total outputJan.-Nov. 2014% Change2013-2014 Shanxi840183821573113.9 Inner-Mongolia150003593231695 Jiangxi21699807780.34 Shandong1093638111667922.82 Henan1050110113478311.72 Guangxi637449731065010 Chongqing20208576313-42.03 Guizhou388050369214912.92 Yunnan13493181036952.04 Total output China4181738434889656.87
Unit: metric ton

Name of province or cityProduction inNovember. 2014Total outputJan.-Nov. 2014% Change2013-2014 Hebei Inner-Mongolia 771102631-8.16 Liaoning544470408-8.97 Jiangsu967188220-29.76 Zhejiang Anhui6172614602.18 Fujian Jiangxi19192151067-3.73 Henan1079491250241-14.15 Hubei321933044040.54 Hunan12212211156185.98 Guangdong278948047-3.25 Guangxi110881169674.67 Guizhou15721821319.72 Yunnan428294160791.43 Shaanxi471930696-29.05 Gansu211021323-23.67 Qinghai424735027-8.67 Ningxia277524634-16.76 Xinjiang432736147-2.95 Total output China3719413904316-5.84
Unit: metric ton

Name of provinceProduction inNovember. 2014Total outputJan.-Nov. 2014% Change2013-2014 Shanxi209562291413.5 Liaoning1100909938.16 Henan2060395306.2 Shaanxi3773636791416.38 Ningxia730285769-15.06 Xingjiang22253724673.69 Total output China7418879515710.7
Unit: metric ton
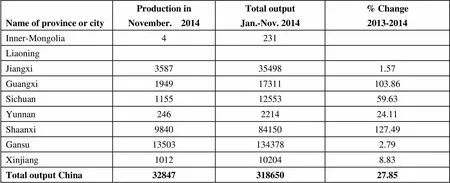
Name of province or cityProduction inNovember. 2014Total outputJan.-Nov. 2014% Change2013-2014 Inner-Mongolia4231 Liaoning Jiangxi3587354981.57 Guangxi194917311103.86 Sichuan11551255359.63 Yunnan246221424.11 Shaanxi984084150127.49 Gansu135031343782.79 Xinjiang1012102048.83 Total output China3284731865027.85
Unit: metric ton

Name of metalProduction inNovember. 2014Total outputJan.-Nov. 2014% Change2013-2014 Copper755492716726411.49 Aluminium2128096219802257.13 Lead3819413904316-5.84 Zinc54995452599694.45 Nickel3284731865027.85 Tin1735116779520.89 Antimony27501239764-11.13 Mercury221207220.54 Magnesium7418879515710.7 Titanium769397658-9.38 Total China3975285399328706.17
Unit: metric ton
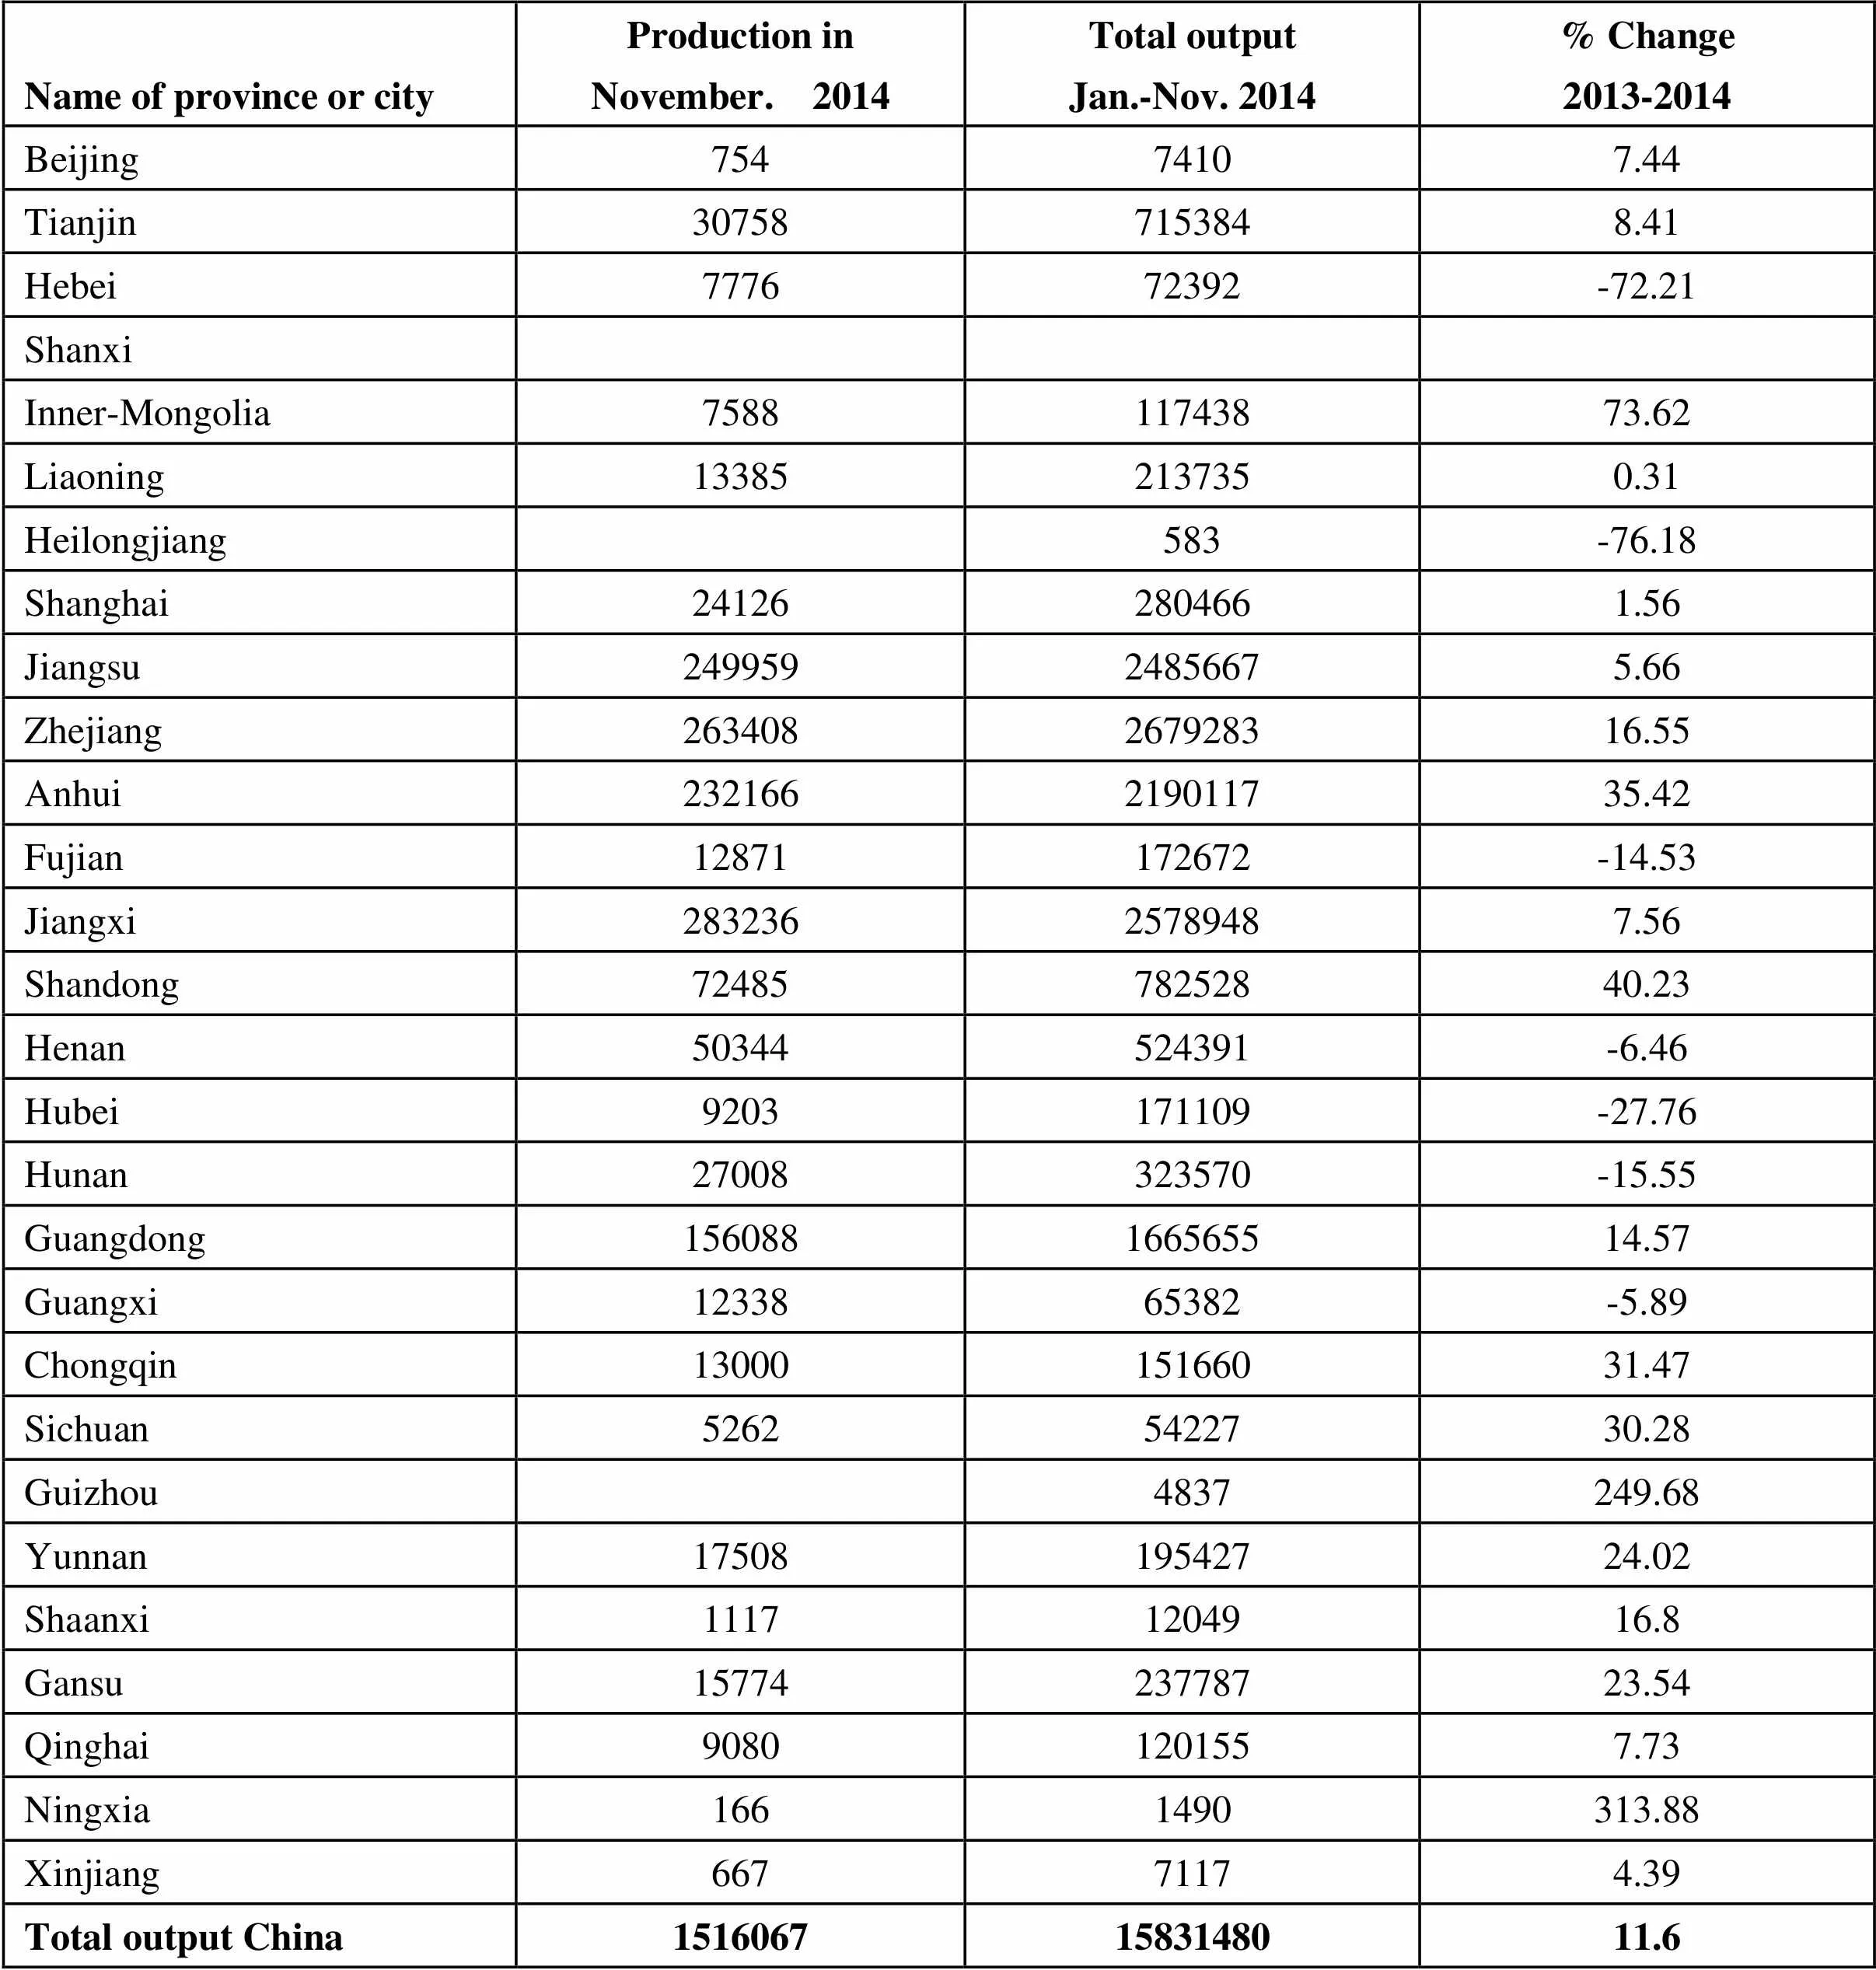
Name of province or cityProduction inNovember. 2014Total outputJan.-Nov. 2014% Change2013-2014 Beijing75474107.44 Tianjin307587153848.41 Hebei777672392-72.21 Shanxi Inner-Mongolia758811743873.62 Liaoning133852137350.31 Heilongjiang583-76.18 Shanghai241262804661.56 Jiangsu24995924856675.66 Zhejiang263408267928316.55 Anhui232166219011735.42 Fujian12871172672-14.53 Jiangxi28323625789487.56 Shandong7248578252840.23 Henan50344524391-6.46 Hubei9203171109-27.76 Hunan27008323570-15.55 Guangdong156088166565514.57 Guangxi1233865382-5.89 Chongqin1300015166031.47 Sichuan52625422730.28 Guizhou4837249.68 Yunnan1750819542724.02 Shaanxi11171204916.8 Gansu1577423778723.54 Qinghai90801201557.73 Ningxia1661490313.88 Xinjiang66771174.39 Total output China15160671583148011.6
(End of November. 2014)

Name of commoditiesPeriodImportsExportsQuantity (metric ton)Value (thousand US dollars)% Change (2013-2014)Quantity (metric ton)Value (thousand US dollars)% Change (2013-2014)Copper:Copper concentrate (actual weight)Jan-Nov.95034081746157917.119.3665341132.1156.9Copper Scrap (actual weight)Jan-Nov.31868009139495-10.19-18.416122658-47.65-53.55Blister copperJan-Nov.4905193455394-4.25-8.2312228669657.9703.6Refined copper Jan-Nov.29543962097626015.28.512195301555962-10.55-18.58Copper alloysJan-Nov.38628217631-18.04-19.4640331-32.35-44.76Fabricated copper productsJan-Nov.5032185058883-6.8-5.8342676635669404.732.44Aluminium:AluminaJan-Nov.4195151318542.8239.91111647101331-27.929.71Aluminium ScrapJan-Nov.18774412812928-7.01-11.498191308-28.21-34.84Primary AluminiumJan-Nov.2608845209581.46-2.44927871915567.611.59Aluminium alloysJan-Nov.74460178125-18.43-13.46465853100461224.2218.45Fabricated Aluminium productsJan-Nov.41295424863292.76-1.892841861927218510.936.46Lead:Lead concentrateJan-Nov.1483294176465017.93-4.4420691679-68.12-93.59Unwrought refined leadJan-Nov.187603-72.18-60.85263355593354.448.61Unwrought refined lead alloys Jan-Nov.2478756031-1.59-1.478582332-33.06-32.34Fabricated LeadJan-Nov.951558-78.8-75.872352056165-30.84-34.16Zinc:Zinc concentrate (actual weight)Jan-Nov.169074511532863.052.28175801451732.551.68Unwrought refined ZincJan-Nov.53356711370359.0617.428702119129426272467Unwrought refined Zinc alloysJan-Nov.88558207814-14.31-9.7411612666-37.52-35.11Fabricated ZincJan-Nov.1221744414-8.43-4.42109545894453.03110.48Tin:Unwrought refined tin Jan-Nov.6365146482-45.52-43.7593621357-60.33-61.13Unwrought refined tin alloysJan-Nov.81318337-18.33-15.19363Nickel:Unwrought nickel Jan-Nov.1158771983404-18.84-13.35897351627622178.9188.3Unwrought nickel alloysJan-Nov.57710908-5.45-5.351049316488752.6258.02Fabricated nickelJan-Nov.125634064024.58-12.337691016792.1-22.54

Name of commoditiesPeriodImportsExportsQuantity (metric ton)Value (thousand US dollars)% Change (2013-2014)Quantity (metric ton)Value (thousand US dollars)% Change (2013-2014)Antimony:Unwrought antimony Jan-Nov.49492-40.4-50.087767166-57.87-60.47Antimony oxideJan-Nov.9098780-4.26-12.44283632307148.53-6.84Molybdenum:Molybdenum concentrate (actual weight)Jan-Nov.1205212373211.33-8.251011414029477.5381.71Ferro-molybdenumJan-Nov.5218033474.19450.7915582969137295619Molybdenum OxideJan-Nov.595117382490214815933084385.71108.9Magnesium:Unwrought magnesiumJan-Nov.5492569233414172733827326466.3-1.06Magnesium turnings, particles and powderJan-Nov.10287-26.634.74726361947391.74-5.19Tungsten:Tungsten ore concentrateJan-Nov.531278229-37.74-29.32192301619.5281.85Tungsten oxideJan-Nov.21754-0.3118.14796628464130.0828.98Ammonium Paratungstate Jan-Nov.26708483315.9614.47Tungsten powderJan-Nov.55337727.785.657843873962.0654.63 Tungsten carbide powderJan-Nov.302524-41.37-25.0619139533722.818.92 Ferro-tungstenJan-Nov.6578816.84.5839216274468.21418.9 Silver: (unit in kg) Unwrought silverJan-Nov.265412111952-10.33-17.429704926563270.08-24.99 Silver powderJan-Nov.133800816886427.01-2.22330816608-2.6568.51 Semi-finished silverJan-Nov.57406888755-26.07-18.3561041924-79.47-86.46 Silver ornamentsJan-Nov.223284412219.7634.4825053674521018.914.89 Silverware Jan-Nov.1331180967.5880.311563726028408.869.48 Gold: (unit in kg) Gold ornamentsJan-Nov.10041512434122.46105.024426443746575812.4670.42 Titanium: Fabricated titaniumJan-Nov.411033912918.474.45976125996020.761.69 Titanium concentratesJan-Nov.1660836351242-11.9-36.75146531409616.99-22.47 Titanium dioxideJan-Nov.17532748158510.8612.1146765395797042.9523.58 Cobalt: Cobalt and Fabricated cobaltJan-Nov.94944569806-5.881.3258382690-4.631.17 Cobalt concentratesJan-Nov.1607573245254.5813.71 Cobalt oxideJan-Nov.340720727.3852.6580691878924.548.19 Cobalt nitrateJan-Nov.529574337.53-6.24 Cobalt carbonateJan-Nov.0.177-84-85107315384-5.95-3.69
Unit: metric ton
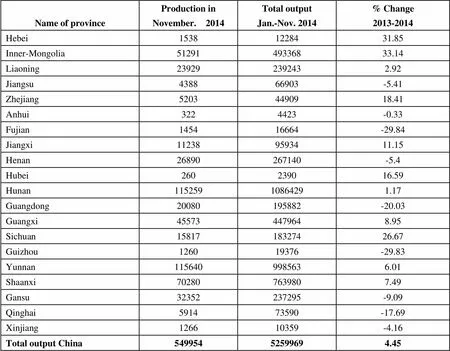
Name of provinceProduction inNovember. 2014Total outputJan.-Nov. 2014% Change2013-2014 Hebei15381228431.85 Inner-Mongolia5129149336833.14 Liaoning239292392432.92 Jiangsu438866903-5.41 Zhejiang52034490918.41 Anhui3224423-0.33 Fujian145416664-29.84 Jiangxi112389593411.15 Henan26890267140-5.4 Hubei260239016.59 Hunan11525910864291.17 Guangdong20080195882-20.03 Guangxi455734479648.95 Sichuan1581718327426.67 Guizhou126019376-29.83 Yunnan1156409985636.01 Shaanxi702807639807.49 Gansu32352237295-9.09 Qinghai591473590-17.69 Xinjiang126610359-4.16 Total output China54995452599694.45

