
ISSR analysis of Caragana microphylla (Leguminosae) in different temperature gradients
2015-10-09 08:11:40WenDaHuangXueYongZhaoYuLinLiYuQiangLiYaYongLuoJingFengNaSu
WenDa Huang , XueYong Zhao, YuLin Li, YuQiang Li, YaYong Luo, Jing Feng, Na Su
Naiman Desertification Research Station, Cold and Arid Regions Environmental and Engineering Research Institute,Chinese Academy of Sciences, Lanzhou, Gansu 730000, China
1 Introduction
Caragana microphylla, a widely used shrub for vegetation rehabilitation in Horqin Sandy Land,northeastern China, has a very important ecological function, and is a constructive and dominant species in this area (Caoet al., 2000; Chenet al., 2009).C. microphyllaalso plays a key role in rehabilitation projects due to its high drought tolerance, "anti-wind erosion-rephrase" and N2-fixation capacity (Zhao,2005; Zhanget al., 2009; Hanet al., 2011). Previous studies onC. microphyllafocused on aspects of population distribution patterns and ecological adaptations(Zhao, 2005), morphological characteristics and variations (Liet al., 2008), physiological adaptations (Maet al., 2003; Liet al., 2008), nutrient absorption (Liet al., 2013), and genetic diversity (Guoet al., 2008;Huanget al., 2013). However, systematic comparison of genetic diversity ofC. microphyllafrom different temperature gradients in Horqin Sandy Land has not been investigated.
This investigation assessed the level of population genetic variation inC. microphyllafrom two different temperature gradients in Horqin Sandy Land using an ISSR marker. The aims are to: (1) characterize the population genetic diversity ofC. microphyllain different temperature gradients; (2) investigate the correlation between genetic diversity and temperature gradients; (3) provide suggestions for future conservation and breeding programs for this species.
2 Materials and methods
2.1 Population sampling
We sampled 66 individuals from sixC. microphyllapopulations. Populations 1 and 2 were from the high temperature region (mean annual temperature of 6.6±0.5 °C); populations 3 and 4 were from the middle temperature region (mean annual temperature of 5.9±0.8 °C); populations 5 and 6 were from the low temperature region (mean annual temperature of 5.6±0.7 °C). For each population, 10–12 individuals(spaced 30 m apart) were sampled (Table 1).Young-healthy leaves were randomly sampled from individual plants and immediately stored with silica gel until DNA extractions were carried out.
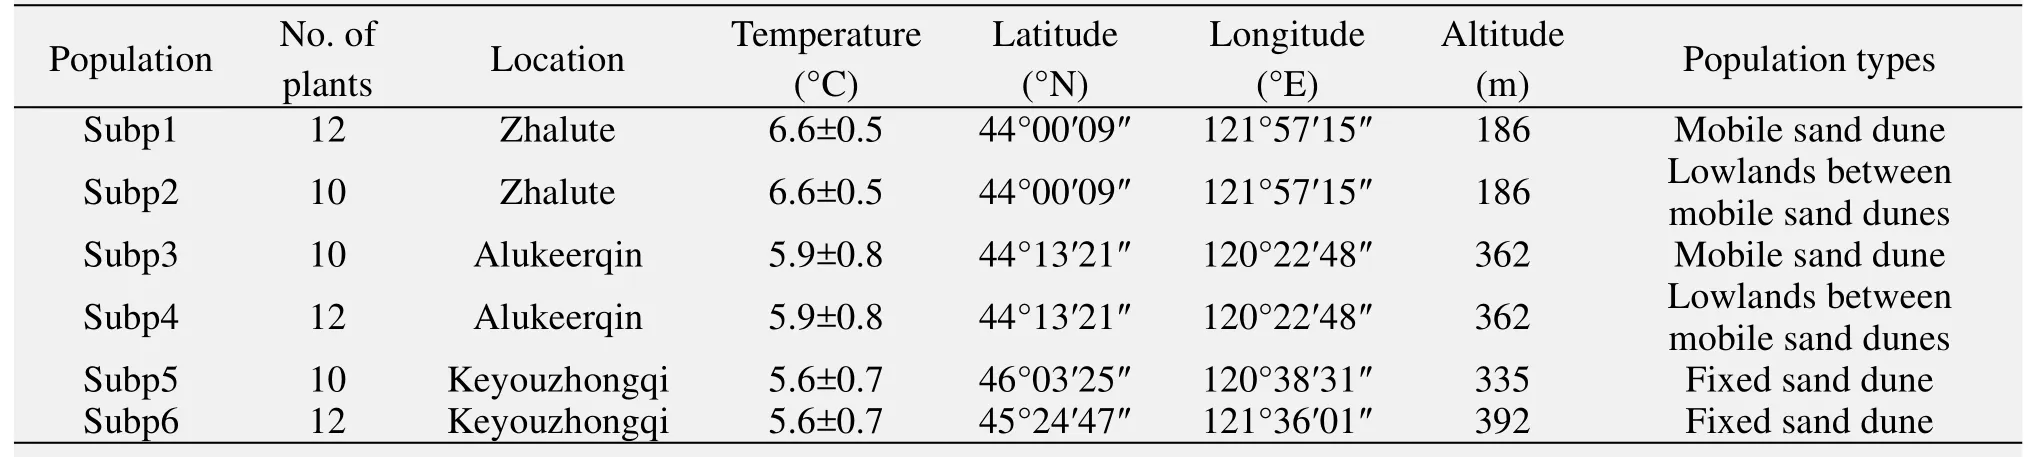
Table 1 Origin location abbreviation, the number of plants, population types of the six populations of Caragana microphylla
2.2 DNA extraction procedure
Total DNA was extracted using AxyPrep Genomic DNA Mini Kits following the manufacturer's instructions. DNA was quantified spectrophotometrically and samples yielding good high quantity DNA were used for subsequent procedures.
2.3 ISSR amplification strategies
One hundred primers from the University of British Columbia (UBC primer set No. 9) were initially screened for well-amplified and polymorphic bands among plant populations. Eight ISSR primers were finally selected for full screening of all individuals.ISSR PCRs were performed in a 25 µL reaction volume containing 40 ng of genomic DNA, 1.0 U of Taq polymerase (Axygen Inc., Beijing, China), 3 mM MgCl2,500 µM each dNTP, 20 mM Tris-HCl (pH 8.3), 100 mM KCl, and 0.3 µM primer. The amplification conditions were: an initial denaturation temperature of 3 min at 94 °C, followed by 35 cycles of 45 s at 94 °C, 45 s at an appropriate annealing temperature (see Table 2 for details), 2 min at 72 °C, and a final 7 min extension step at 72 °C. ISSR reactions were performed at least twice to determine the reproducibility of banding patterns. The amplification products were electrophoretically resolved in 1.8% agarose gels containing ethidium bromide (final concentration of 0.5 µg/mL) at 100 V for 2 h,along with 100 bp DNA ladder (Axygen Inc., Beijing,China) and photographed under ultraviolet light.
2.4 Statistical analysis
On the gel analysis, we only considered distinct and reproducible bands. The amplified fragments were scored for presence (1) or absence (0) of bands and transformed into a 0/1 binary character matrix. The resulting binary data matrix was analyzed using POPGENE Version 1.32 (Yeh and Yang, 1999). The genetic diversity for each population was measured by the percentage of polymorphic loci (P), the observed number of alleles (Na), the effective number of alleles (Ne), Nei's gene diversity (h), and Shannon's information index (I). Pairwise genetic distance between populations (Nei, 1972) was calculated to construct a UPGMA dendrogram using the software NTSYS pc2.02 (Rohlf, 1998).
3 Results
3.1 ISSR profile
The profile of ISSR bands shows high polymorphism inC. microphyllapopulations. The eight selected ISSR primers generated a total of 127 clear and distinguishable band fragments, 123 bands (96.85%)were polymorphic. The size of the amplified fragments ranged from 150 to 2,500 bp, with an average of 15.875 fragments generated per primer. The highest number of bands were generated with primers UBC857 and the lowest polymorphism was obtained with primer UBC826 (Table 2).
3.2 Genetic diversity and differentiation
The genetic diversity among the six populations ofC. microphyllaare given in Table 3. The number of polymorphic loci (n) ranged from 37 to 54 and the percentage of polymorphic bands (P) ranged from 29.13% to 42.52%. The observed number of alleles (Na)ranged from 1.2913 to 1.4252. The effective number of alleles (Ne) was from 1.2084 to 1.2727. The range of gene diversity (h) and Shannon's information index (I)was 0.1184–0.1605 and 0.1730–0.2386, respectively.The Subp6 population (from low temperature region)indicated the highest diversity, whereas the Subp2 population (from high temperature region) exhibited the lowest diversity. At the species level, Nei's genetic diversity (h) was 0.3143 and the Shannon's information index (I) was 0.4790, respectively (Table 3).
Distances of natural population pairs ranged from 0.6411 to 0.9202, with a mean of 0.7807. Plantation population distances ranged from 0.0832 to 0.4445,with a mean of 0.2639 (Table 4). On the basis of Nei's(1972) genetic distances, a dendrogram of the six populations was generated using UPGMA cluster analysis.The six populations were divided into two main groups:one consisting of Subp1, Subp2, Subp3 and Subp4, the other consisting of Subp5 and Subp6 (Figure 1).

Table 2 Primers sequence, melting temperature and percentage of polymorphism in ISSR analyses of Caragana microphylla

Table 3 Genetic diversity indices of Caragana microphylla populations

Table 4 Nei's genetic identity (above diagonal) and genetic distance (below diagonal) between Caragana microphylla populations

Figure 1 UPGMA dendrogram of Caragana microphylla populations based on Nei's (1972) genetic distance from ISSR data
4 Discussion and conclusions
Genetic variation is non-randomly distributed among populations and species (Nevo, 1998). This distribution of alleles and genotypes in space or time is often referred to as the genetic structure of a population (Chenet al., 2009). In Horqin Sandy Land,C.microphyllais one of the most important shrub species in northeastern China, and the systematic comparison ofC. microphyllaat the level of genetic diversity within and among populations in different temperatures gradient has not been investigated.
Desert plants tend to present high levels of genetic diversity (Xuet al., 2003; Wanget al., 2004; Wanet al.,2008; Huanget al., 2011). Assessing genetic variation is thus an important component of plant conservation and ecological restoration (Huanget al., 2014). In our study,C. microphyllagenerally exhibited high levels of genetic diversity. At the species level, the genetic diversity indices inC. microphyllawas considerably large (P= 96.85%,h= 0.3143;I= 0.4790) when compared toC. microphyllain different population types (P= 82.08%,h= 0.2831;I= 0.4233) andArtemisia halodendronin a different hydrothermal level region (P= 65.61%,h= 0.2204;I= 0.3236) based on ISSR analysis (Huanget al., 2013, 2014). On the basis ofC. microphyllalife history traits, this species is a long-lived, perennial shrub and the combination of these life history traits should enable the species to maintain a high level of genetic diversity. An organism's ecological characteristics are shaped by the interaction between genetic traits and external organic or inorganic factors. With regard to the whole ecosystem,relationships between genomes and environmental factors should therefore be considered as an important component of ecological research (Li and Peng, 2001).In our study, we found that an increase in AMT was accompanied by an increase in genetic diversity indices of the sixC. microphyllapopulations in the Horqin Sandy Land. This result is similar to the relationship previously seen between RAPD diversity and some soil ecological factors inReaumuria soongoricafrom the Fukang Desert of China (Xuet al., 2003; Qianet al., 2008).
In our study, the genetic distances among the six studied populations ranged from 0.0832 to 0.4445. The shortest distance existed between populations 1 and 2.This would suggest that both populations have similar genetic backgrounds or underwent similar genetic adaptations because these populations are from the same temperature region. The largest genetic distance was observed between populations 2 and 5 which is due to temperature differences. Population 2 was from the high temperature region while population 5 was from the low temperature region. Our data shows that the relationship between populations inC. microphyllaagrees with temperature gradients. These results are consistent with the previously-reported relationship between RAPD diversity and mean annual temperatures gradient inStipa grandisfrom Inner Mongolia(Zhaoet al., 2006).
In conclusion, the results of this study revealed that different temperature gradients affect the genetic diversity indices ofC. microphyllain Horqin Sandy Land.The process of temperature changes allowed for some genetic variation inC. microphylla. Thus, genetic references are necessary when restoring and managing a degraded ecosystem in arid and semi-arid areas.
The authors would like to thank all the members of Naiman Desertification Research Station, and Extreme Stress Resistance and Biotechnology Laboratory, Cold and Arid Regions Environmental and Engineering Research Institute, China Academy of Sciences (CAS),for their help in field work and laboratory studies. This study was financially supported by One Hundred Person Project of the Chinese Academy of Sciences and research projects––41201561, 2011BAC07B02,Y351151001 and 145RJYA269.
Cao CY, Jiang DM, Alamsa,et al., 2000. Ecological process of vegetation restoration inCaragana mirophyllasand fixing area.Chinese Journal of Applied Ecology, 11: 349–354.
Chen XH, Gao YB, Zhu MJ,et al., 2009. Genomic DNA extraction and AFLP analysis system establishment ofCaragana mirophylla. Bulletin of Botanical Research, 29: 529–533.
Guo Q, Shi YJ, Wei ZW,et al., 2008. Genetic diversity analysis by SSR marker of fourteen species ofCaraganaFabr in Hexi Corridor area of Gansu. Acta Agrestia Sinica, 16: 227–233.
Han YZ, Wang Z, Gao HW, 2011. Optimization of SSR-PCR system onCaragana mirophyllaand its application. Pratacultural Science, 28: 399–413.
Huang WD, Zhao XY, Zhao X,et al., 2011. A combined approach using ISSR and ITS analysis for the characterization ofArtemisia halodendronfrom Horqin sandy land northern China.Biochemical Systematics and Ecology, 39: 346–351. DOI:10.1016/j.bse.2011.04.011.
Huang WD, Zhao XY, Zhao X,et al., 2013. Genetic variation within the sand-fixation speciesCaragana microphylla(Leguminosae) in Horqin sandy land detected by inter-simple sequence repeats analysis. Biochemical Systematics and Ecology,51: 343–348. DOI: 10.1016/j.bse.2013.10.006.
Huang WD, Zhao XY, Zhao X,et al., 2014. Relationship between the genetic diversity ofArtemisia halodendronand climatic factors. Acta Oecologica, 55: 97–103. DOI:10.1016/j.actao.2013.12.005.
Li D, Peng SL, 2001. Genetic diversity in threePinnus massonianapopulations in different elevations and its relationship with ecological factors. Acta Ecologica Sinica, 21: 415–421.
Li YF, Jiang S, Gu S,et al., 2008. Micro-morphology of leaf epidermis ofCaraganain Inner Mongolia. Bulletin of Botanical Research, 28: 668–678.
Li YL, Chen J, Cui JY,et al., 2013. Nutrient resorption inCaragana microphyllaalong a chronosequence of plantations: Implications for desertified land restoration in North China. Ecological Engineering, 53: 299–305.
Ma CC, Gao YB, Liu HF,et al., 2003. Interspecific transition amongCaragana mirophylla,C. davazamciiandC. korshinskiialong geographic gradient, I ecological and RAPD evidence.Acta Ecologica Sinica, 45: 1218–1227.
Nei M, 1972. Genetic distance between populations. American Naturalist, 106: 282–283. DOI: 10.1086/282771.
Nevo E, 1998. Genetic diversity in wild cereals: regional and local studies and their bearing on conservation exsitu and insitu.Genetic Resources and Crop Evolution, 45: 355–370.
Qian ZQ, Xu L, Wang YL,et al., 2008. Ecological genetics ofReaumuria soongorica(Pall.) Maxim. population in the oasise-desert ecotone in Fukang, Xinjiang, and its implications for molecular evolution. Biochemical Systematics and Ecology, 36:593–601. DOI: 10.1016/j.bse.2008.01.008.
Rohlf FJ, 1998. NTSYSpc: Numerical Taxonomy and Multivariate Analysis System, Version 2.02. Exeter Software, Setauket, New York.
Wan T, Cai P, Zhang CB,et al., 2008. Analysis of genetic diversity ofArtemisia frigidapopulations by RAPD in different synusiologic area of Inner Mongolia. Journal of Northwest A&F University (Natural Science Edition), 36: 166–169.
Wang J, Yang R, Yin J,et al., 2004. Change of the genetic diversity ofArtemisia frigidapopulation under the disturbance of grazing.Acta Ecologica Sinica, 24: 2465–2471.
Xu L, Wang YL, Wang XW,et al., 2003. Genetic structure ofReaumuria soongoricapopulation in Fukang desert Xinjiang and its relationship with ecological factors. Acta Botanica Sinica, 45: 787–794. DOI: 10.1117/12.466683.
Yeh FC, Yang R, 1999. POPGENE Version 1.31. Department of Renewable Resources. Available from University of Alberta,Edmonton. http://www.ualberta/ca/-fyeh.
Zhang CJ, Wu DX, Zhang L,et al., 2009. Nodule characteristics of three-year-oldCaragana microphyllaand their responses to environmental changes in an Inner Mongolia grassland. Chinese Journal of Plant Ecology, 33: 1165–1176.
Zhao NX, Cao YB, Wang JL,et al., 2006. RAPD diversity ofStipa grandispopulations and its relationship with some ecological factors. Acta Ecologica Sinica, 26: 1312–1319.
Zhao YZ, 2005. The distribution pattern and ecological adaptation ofCaragana mirophylla,Caragana davazamciiandCaragana korshinskii.Acta Ecologica Sinica, 25: 3411–3414.
 Sciences in Cold and Arid Regions2015年1期
- Sciences in Cold and Arid Regions的其它文章
- Seasonal change mediates the shift between resource and pollen limitation in Hedysarum scoparium(Fabaceae)
- Characteristics of high arsenic groundwater in Hetao Basin,Inner Mongolia,northern China
- The response of Caragana microphylla seedlings to water table changes in Horqin Sandy Land,China
- Effects of sand burial on growth and antioxidant enzyme activities of wheat(Triticum aestivum L.)in northern China
- Photosynthesis of Digitaria ciliarisduring repeated soil drought and rewatering
- Screening of cellulose decomposing fungi in sandy dune soil of Horqin Sandy Land