2015年1-7月全国商用车市场销售统计图表
2015-08-19 09:49:41习仲文整理
商用汽车 2015年9期
习仲文 整理
习仲文 整理
2015年1-7月全国商用车市场销售统计图表
习仲文整理
Statistical Chart of Sales of Commercial Vehicles across China
This is a statistical chart of sales of commercial vehicles across China from Jan. to Jul. in 2015. All numbers and figures are collected from “News of Sales and Production of China Auto Industry”, and all kinds of commercial vehicles, including trucks, coaches and other segments are included in this chart.

表1 1-7月大客主要生产企业累计销量及市场份额单位:辆,%
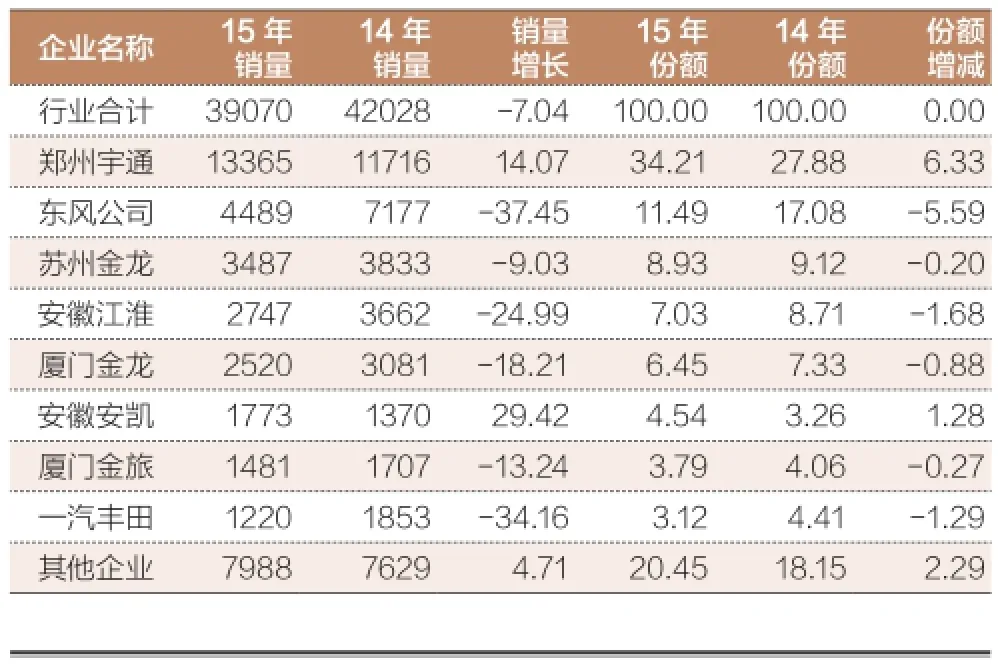
表2 1-7月中客主要生产企业累计销量及市场份额单位:辆,%

表3 1-7月轻客主要生产企业累计销量及市场份额单位:辆,%

表4 1-7月重卡主要生产企业累计销量及市场份额单位:辆,%
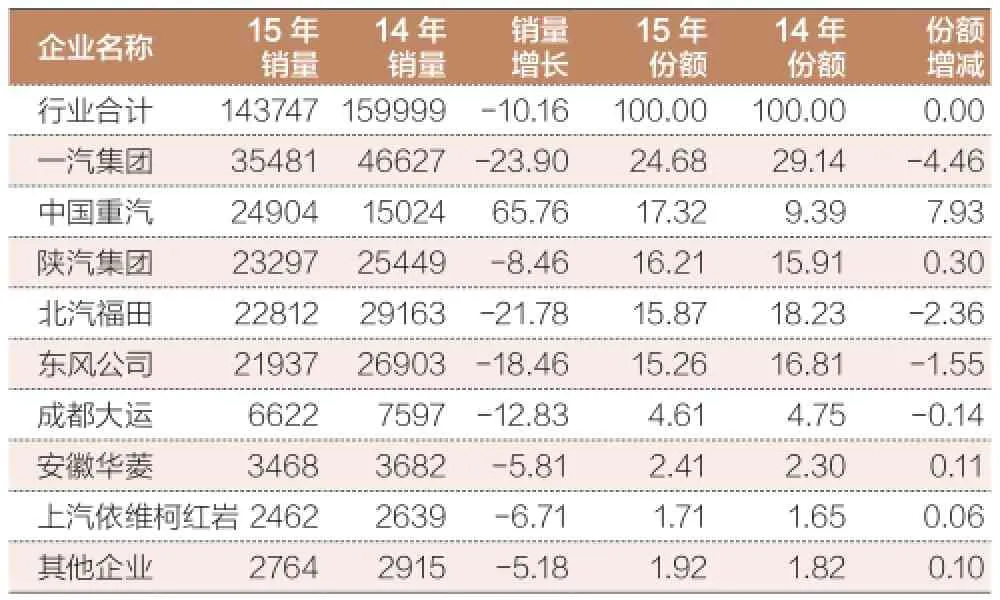
表5 1-7月半挂牵引车主要生产企业累计销量及市场份额单位:辆,%
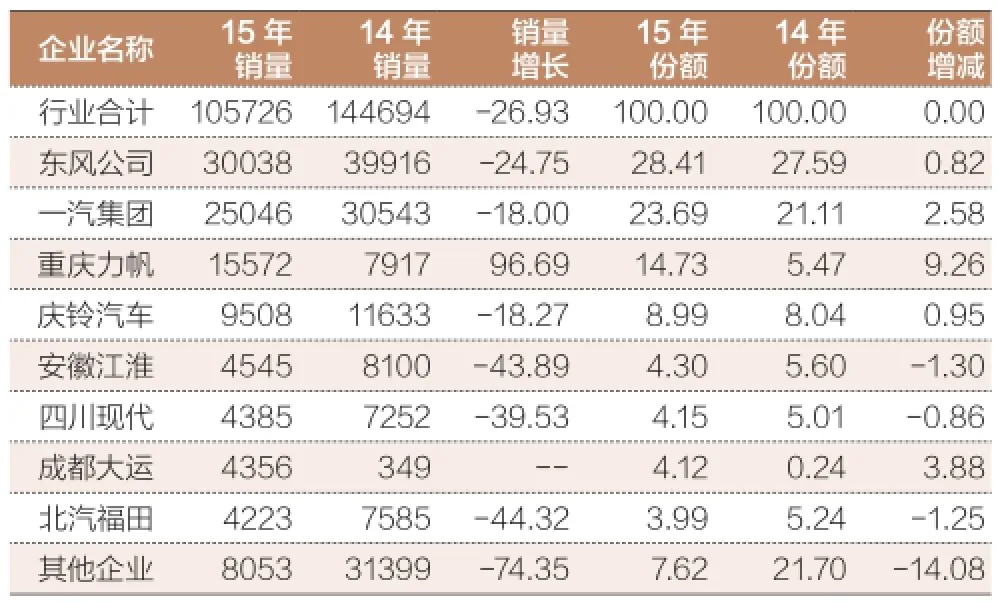
表6 1-7月中卡主要生产企业累计销量及市场份额单位:辆,%
2015年1-7月全国汽车分车型销售及构成情况
习仲文整理
The National Data of Auto Sales Volumes from Jan. to Jul. in 2015
This is a record of auto sales all over China market from Jan. to Jul. in 2015, categorized by models of whole vehicles and engine models.
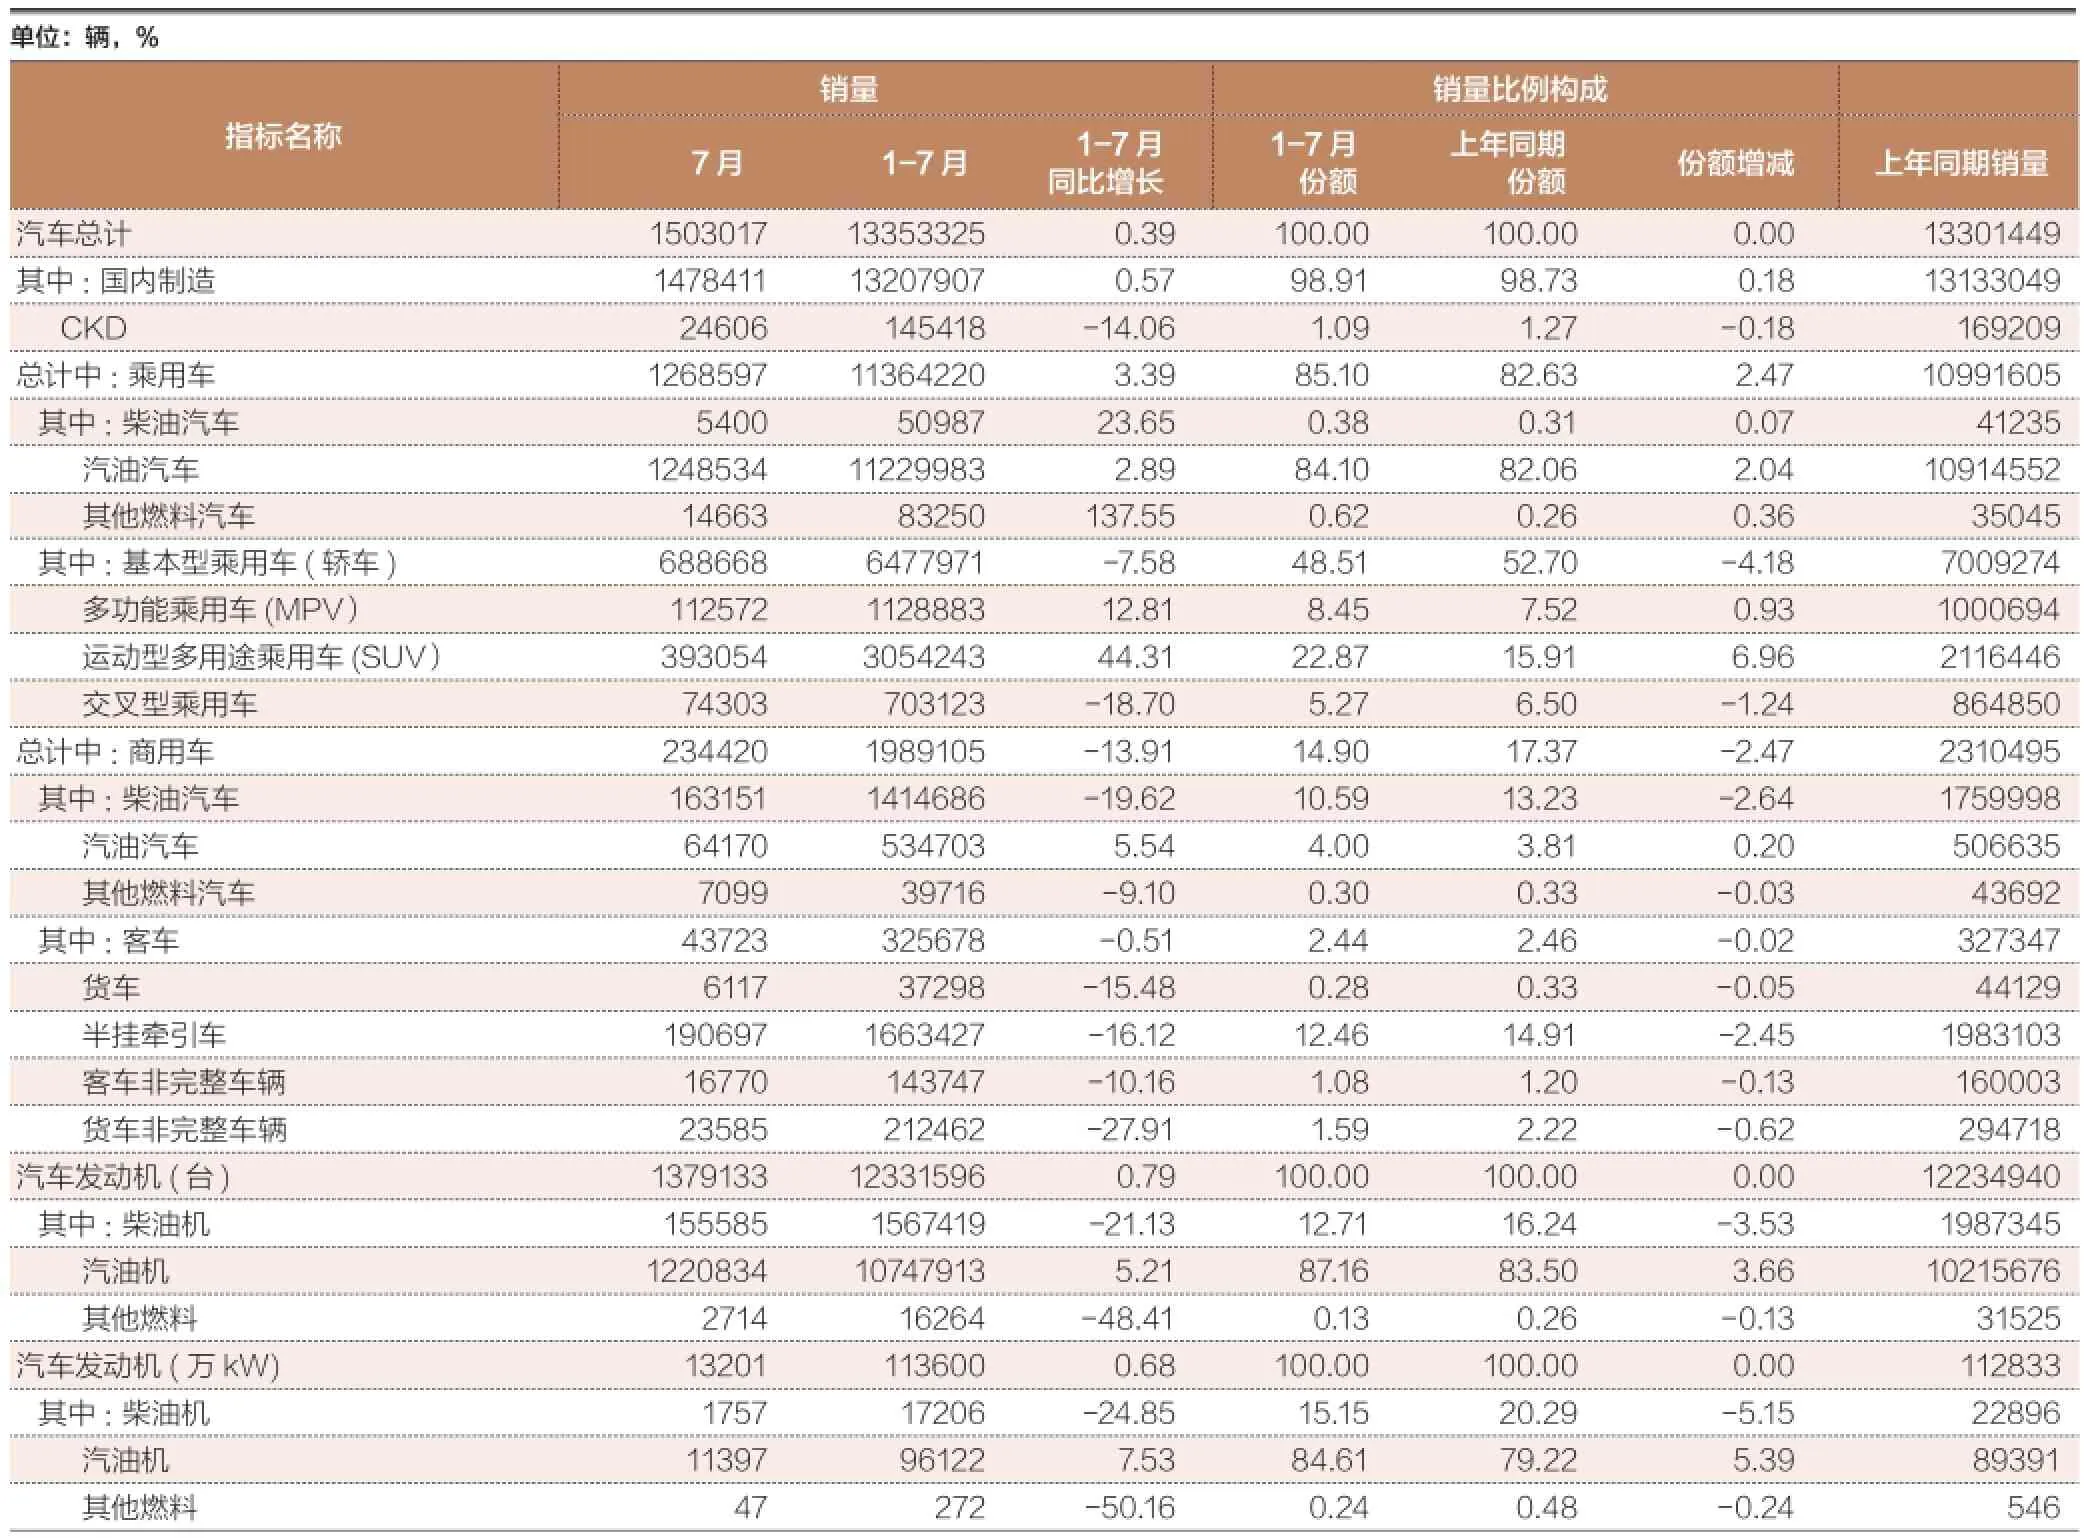
单位:辆,%指标名称销量 销量比例构成7月 1-7月 1-7月同比增长1-7月份额上年同期份额 份额增减 上年同期销量汽车总计 1503017 13353325 0.39 100.00 100.00 0.00 13301449其中:国内制造 1478411 13207907 0.57 98.91 98.73 0.18 13133049 CKD 24606 145418 -14.06 1.09 1.27 -0.18 169209总计中:乘用车 1268597 11364220 3.39 85.10 82.63 2.47 10991605其中:柴油汽车 5400 50987 23.65 0.38 0.31 0.07 41235汽油汽车 1248534 11229983 2.89 84.10 82.06 2.04 10914552其他燃料汽车 14663 83250 137.55 0.62 0.26 0.36 35045其中:基本型乘用车(轿车) 688668 6477971 -7.58 48.51 52.70 -4.18 7009274多功能乘用车(MPV) 112572 1128883 12.81 8.45 7.52 0.93 1000694运动型多用途乘用车(SUV) 393054 3054243 44.31 22.87 15.91 6.96 2116446交叉型乘用车 74303 703123 -18.70 5.27 6.50 -1.24 864850总计中:商用车 234420 1989105 -13.91 14.90 17.37 -2.47 2310495其中:柴油汽车 163151 1414686 -19.62 10.59 13.23 -2.64 1759998汽油汽车 64170 534703 5.54 4.00 3.81 0.20 506635其他燃料汽车 7099 39716 -9.10 0.30 0.33 -0.03 43692其中:客车 43723 325678 -0.51 2.44 2.46 -0.02 327347货车 6117 37298 -15.48 0.28 0.33 -0.05 44129半挂牵引车 190697 1663427 -16.12 12.46 14.91 -2.45 1983103客车非完整车辆 16770 143747 -10.16 1.08 1.20 -0.13 160003货车非完整车辆 23585 212462 -27.91 1.59 2.22 -0.62 294718汽车发动机(台) 1379133 12331596 0.79 100.00 100.00 0.00 12234940其中:柴油机 155585 1567419 -21.13 12.71 16.24 -3.53 1987345汽油机 1220834 10747913 5.21 87.16 83.50 3.66 10215676其他燃料 2714 16264 -48.41 0.13 0.26 -0.13 31525汽车发动机(万kW) 13201 113600 0.68 100.00 100.00 0.00 112833其中:柴油机 1757 17206 -24.85 15.15 20.29 -5.15 22896汽油机 11397 96122 7.53 84.61 79.22 5.39 89391其他燃料 47 272 -50.16 0.24 0.48 -0.24 546
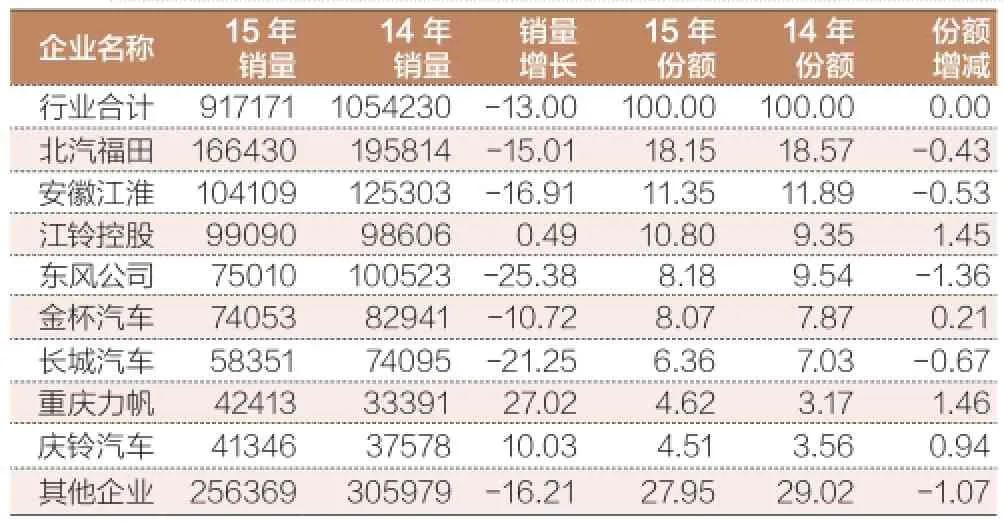
表7 1-6月轻卡主要生产企业累计销量及市场份额 单位:辆,%
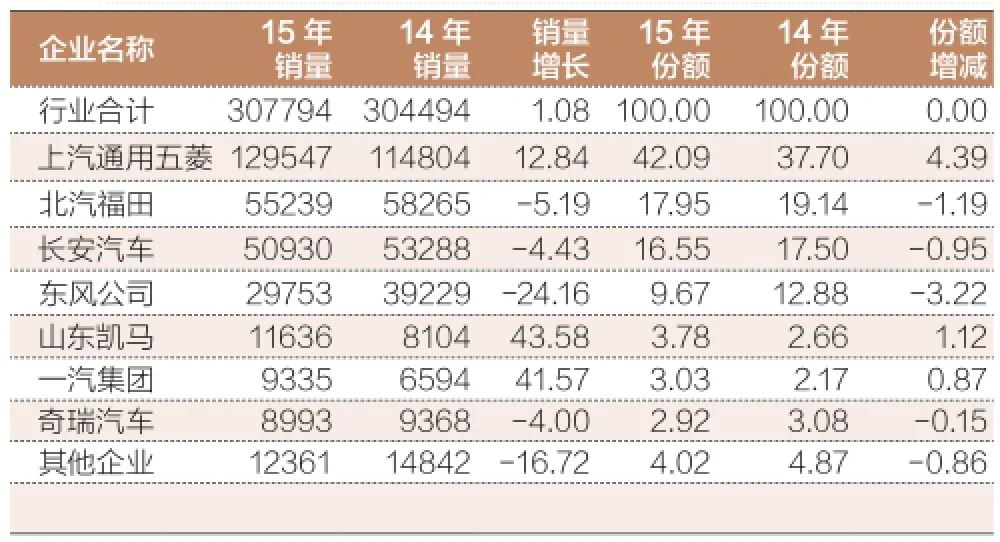
表8 1-6月微卡主要生产企业累计销量及市场份额 单位:辆,%
猜你喜欢
中国计算机报(2019年22期)2019-07-31 02:11:10
商用汽车(2018年6期)2018-08-15 06:49:32
商用汽车(2017年10期)2017-11-17 02:01:43
商用汽车(2017年1期)2017-07-26 04:05:47
商用汽车(2017年1期)2017-07-26 04:05:47
IT时代周刊(2015年8期)2015-11-11 05:50:48
IT时代周刊(2015年7期)2015-11-11 05:49:34
汽车电器(2014年5期)2014-02-28 12:14:19
汽车与新动力(2013年6期)2013-03-11 16:08:19
中国汽车市场(2009年10期)2009-12-02 03:45:30