中国平均降水和极端降水对气候变暖的响应:CMIP5模式模拟评估和预估
吴佳, 周波涛,2*, 徐影
1 国家气候中心, 北京 100081 2 南京信息工程大学气象灾害预报预警与评估协同创新中心, 南京 210044
中国平均降水和极端降水对气候变暖的响应:CMIP5模式模拟评估和预估
吴佳1, 周波涛1,2*, 徐影1
1 国家气候中心, 北京 100081 2 南京信息工程大学气象灾害预报预警与评估协同创新中心, 南京 210044
基于24个CMIP5全球耦合模式模拟结果,分析了中国区域年平均降水和ETCCDI强降水量(R95p)、极端强降水量(R99p)对增暖的响应.定量分析结果显示,CMIP5集合模拟的当代中国区域平均降水对增温的响应较观测偏弱,而极端降水的响应则偏强.对各子区域气温与平均降水、极端降水的关系均有一定的模拟能力,并且极端降水的模拟好于平均降水.RCP4.5和RCP8.5情景下,随着气温的升高,中国区域平均降水和极端降水均呈现一致增加的趋势,中国区域平均气温每升高1 ℃,平均降水增加的百分率分别为3.5%和2.4%,R95p增加百分率为11.9%和11.0%,R99p更加敏感,分别增加21.6%和22.4%.就各分区来看,当代的区域性差异较大,未来则普遍增强,并且区域性差异减小,在持续增暖背景下,中国及各分区极端降水对增暖的响应比平均降水更强,并且越强的极端降水敏感性越大.未来北方地区平均降水对增暖的响应比南方地区的要大,青藏高原和西南地区的R95p和R99p增加最显著,表明未来这些区域发生暴雨和洪涝的风险将增大.
全球变暖; CMIP5; 降水; 极端降水; 区域响应
1 引言
全球气候正经历以变暖为主要特征的变化(IPCC,2013).在全球气候变化背景下,气候变暖与降水变化的关系是当前气候变化研究关注的重点之一.根据克劳修斯-克拉贝龙方程,温度的增加导致水汽含量和降水的增加.温度每升高1 ℃,全球水汽含量可能增加7%(Trenberth et al.,2005;Wentz et al.,2007).由于气候变化特别是降水的变化具有明显的区域特征,因此,有必要从区域尺度的角度探寻降水变化对温度的响应,这对于认识区域气候变化和区域适应更为重要.
中国是气候变化的敏感区域之一(Xu et al.,2009a).不少研究(Zhai et al.,2005;Xu et al.,2009b; Sun et al.,2010;Li et al.,2011;Wang et al.,2012;Xu and Xu,2012;陈活泼,2013;Lang and Sui, 2013;Chen and Sun,2014)揭示,中国区域的降水和极端降水对增暖具有很强的敏感性.随着全球变暖,中国区域平均降水显著增加,极端降水事件增多、强度增强.例如,Qian等(2007)的研究发现,中国区域毛毛雨的显著减少可能与大尺度的增暖有关系.Zhao等(2010)的研究表明中国区域降水对增暖有所响应,在相对偏暖期,中国北方持续性降水发生时间偏晚而结束偏早,南方地区则发生时间偏早结束偏晚.孙建奇和敖娟(2013)分析了中国冬季降水和极端降水对增暖的响应,发现中国区域冬季气温每增加1 ℃,降水和极端降水的增加百分率分别为9.7%和22.6%.该增加幅度明显高于全球平均水平,表明中国区域冬季降水和极端降水对变暖的响应更加敏感,也凸现了开展降水对增暖的区域响应研究的重要性.
IPCC第五次评估报告指出,未来温室气体的排放将造成全球气候进一步变暖.与1986—2005年相比,预计到21世纪末,全球地表平均温度将升高0.3~4.8 ℃.在这种背景下,未来全球极端降水将加强.我国极端降水的未来变化趋势与全球相一致.Zhou等(2014)分析了未来变暖背景下中国及子区域尺度上极端气候事件的变化,指出与1986—2005年相比,年总降水量(PROPTOT)、五日最大降水量(Rx5day)、强降水量(R95p)均将增加,而且极端降水的增加幅度更为明显,我国北方增加幅度冬季大于夏季,南方则相反.Chen 和Sun(2014)还研究了中国区域极端事件对CO2增加的敏感性,结果发现更强的降水事件对CO2增加的敏感性更大,并且南方与其他地区的表现不同.这些研究都揭示出未来极端事件对气候变暖的响应具有一定的区域性.陈活泼(2013)利用16个CMIP5耦合模式的集合结果分析了未来中国降水对变暖的响应,指出未来气温升高1 ℃,中国年平均降水量增加1.6%,同时中国南、北方地区表现出一定的差异.鉴于平均降水和极端降水未来变化的区域不一致性,那么,未来变暖背景下,中国不同区域的平均降水和极端降水与气候变暖的定量关系到底又如何?这也正是本研究的出发点.
本文基于24个CMIP5耦合模式模拟结果,首先评估CMIP5模式对20世纪历史时期(1961—2005年)平均降水和极端降水对气候变暖响应的模拟能力,随后进一步对RCP4.5和RCP8.5情景下的预估结果进行分析,揭示未来中国不同分区平均降水和极端降水对增暖的响应.
2 数据和方法
本文采用的数据主要为24个CMIP5耦合模式模拟的20世纪历史气候(historical,1961—2005)和典型浓度路径(RCP)下2006—2099年的气温和降水.CMIP5所用的RCP情景共包括RCP2.6,RCP4.5,RCP6.0和RCP8.5四种情景.本文主要分析RCP4.5和RCP8.5两种情景.RCP4.5代表中低排放情景,指的是2100年辐射强迫稳定在4.5 W·m-2;RCP8.5代表高排放情景,指2100年辐射强迫达到8.5 W·m-2(Moss et al.,2010;Taylor et al.,2012).有关模式的详细信息可参见表1.由于各模式的分辨率不同,为此我们通过双线性插值方法,将所有模式的模拟数据统一插值到1°×1°的水平网格上.
为评估CMIP5模式对平均降水和极端降水与气候变暖关系的模拟能力,我们还使用了1961—2005年的CN05.1格点化观测资料.CN05.1是基于中国2400多个地面气象台站的观测资料(吴佳和高学杰,2013),通过插值建立的一套高分辨率的格点数据集,该资料已被广泛应用于气候变化检测、归因和模式评估等领域(Gao et al.,2013;Huang et al.,2014,2015;徐集云等,2013;Yang and Jiang,2014).为了探讨中国区域平均降水和极端降水事件对气候变暖的响应,本研究定义全年(1—12月)平均的降水量为平均降水(Pr);选取世界气象组织(WMO)气候变化检测和指标专家组(ETCCDI)定义的强降水量(R95p)和极端强降水量(R99p)作为极端降水指标.R95p指日降水量大于95%分位值的年累计降水量,R99p指日降水量大于99%分位值的年累计降水量.
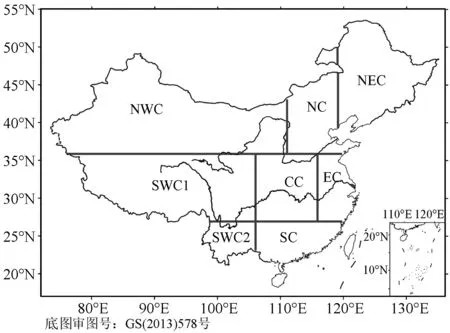
图1 中国8个分区分布示意图NEC(东北):39°N—54°N,119°E—134°E;NC(华北):36°N—46°N,111°E—119°E;EC(华东):27°N—36°N,116°E—122°E;CC(华中):27°N—36°N,106°E—116°E;SC(华南):20°N—27°N,106°E—120°E;SWC1(青藏高原):27°N—36°N,77°E—106°E;SWC2(西南):22°N—27°N,98°E—106°E;NWC(西北):36°N—46°N,75°E—111°E CN(中国)Fig.1 Domains of eight subregions in ChinaNEC (Northeast China): 39°N—54°N, 119°E—134°E; NC (North China): 36°N—46°N, 111°E—119°E; EC (East China): 27°N—36°N, 116°E—122°E; CC (Central China): 27°N—36°N, 106°E—116°E; SC (South China): 20°N—27°N, 106°E—120°E; SWC1 (Tibetan Plateau): 27°N—36°N, 77°E—106°E; SWC2 (Southwest China): 22°N—27°N, 98°E—106°E; NWC (Northwest China): 36°N—46°N, 75°E—111°E. CN refers to China as a whole.
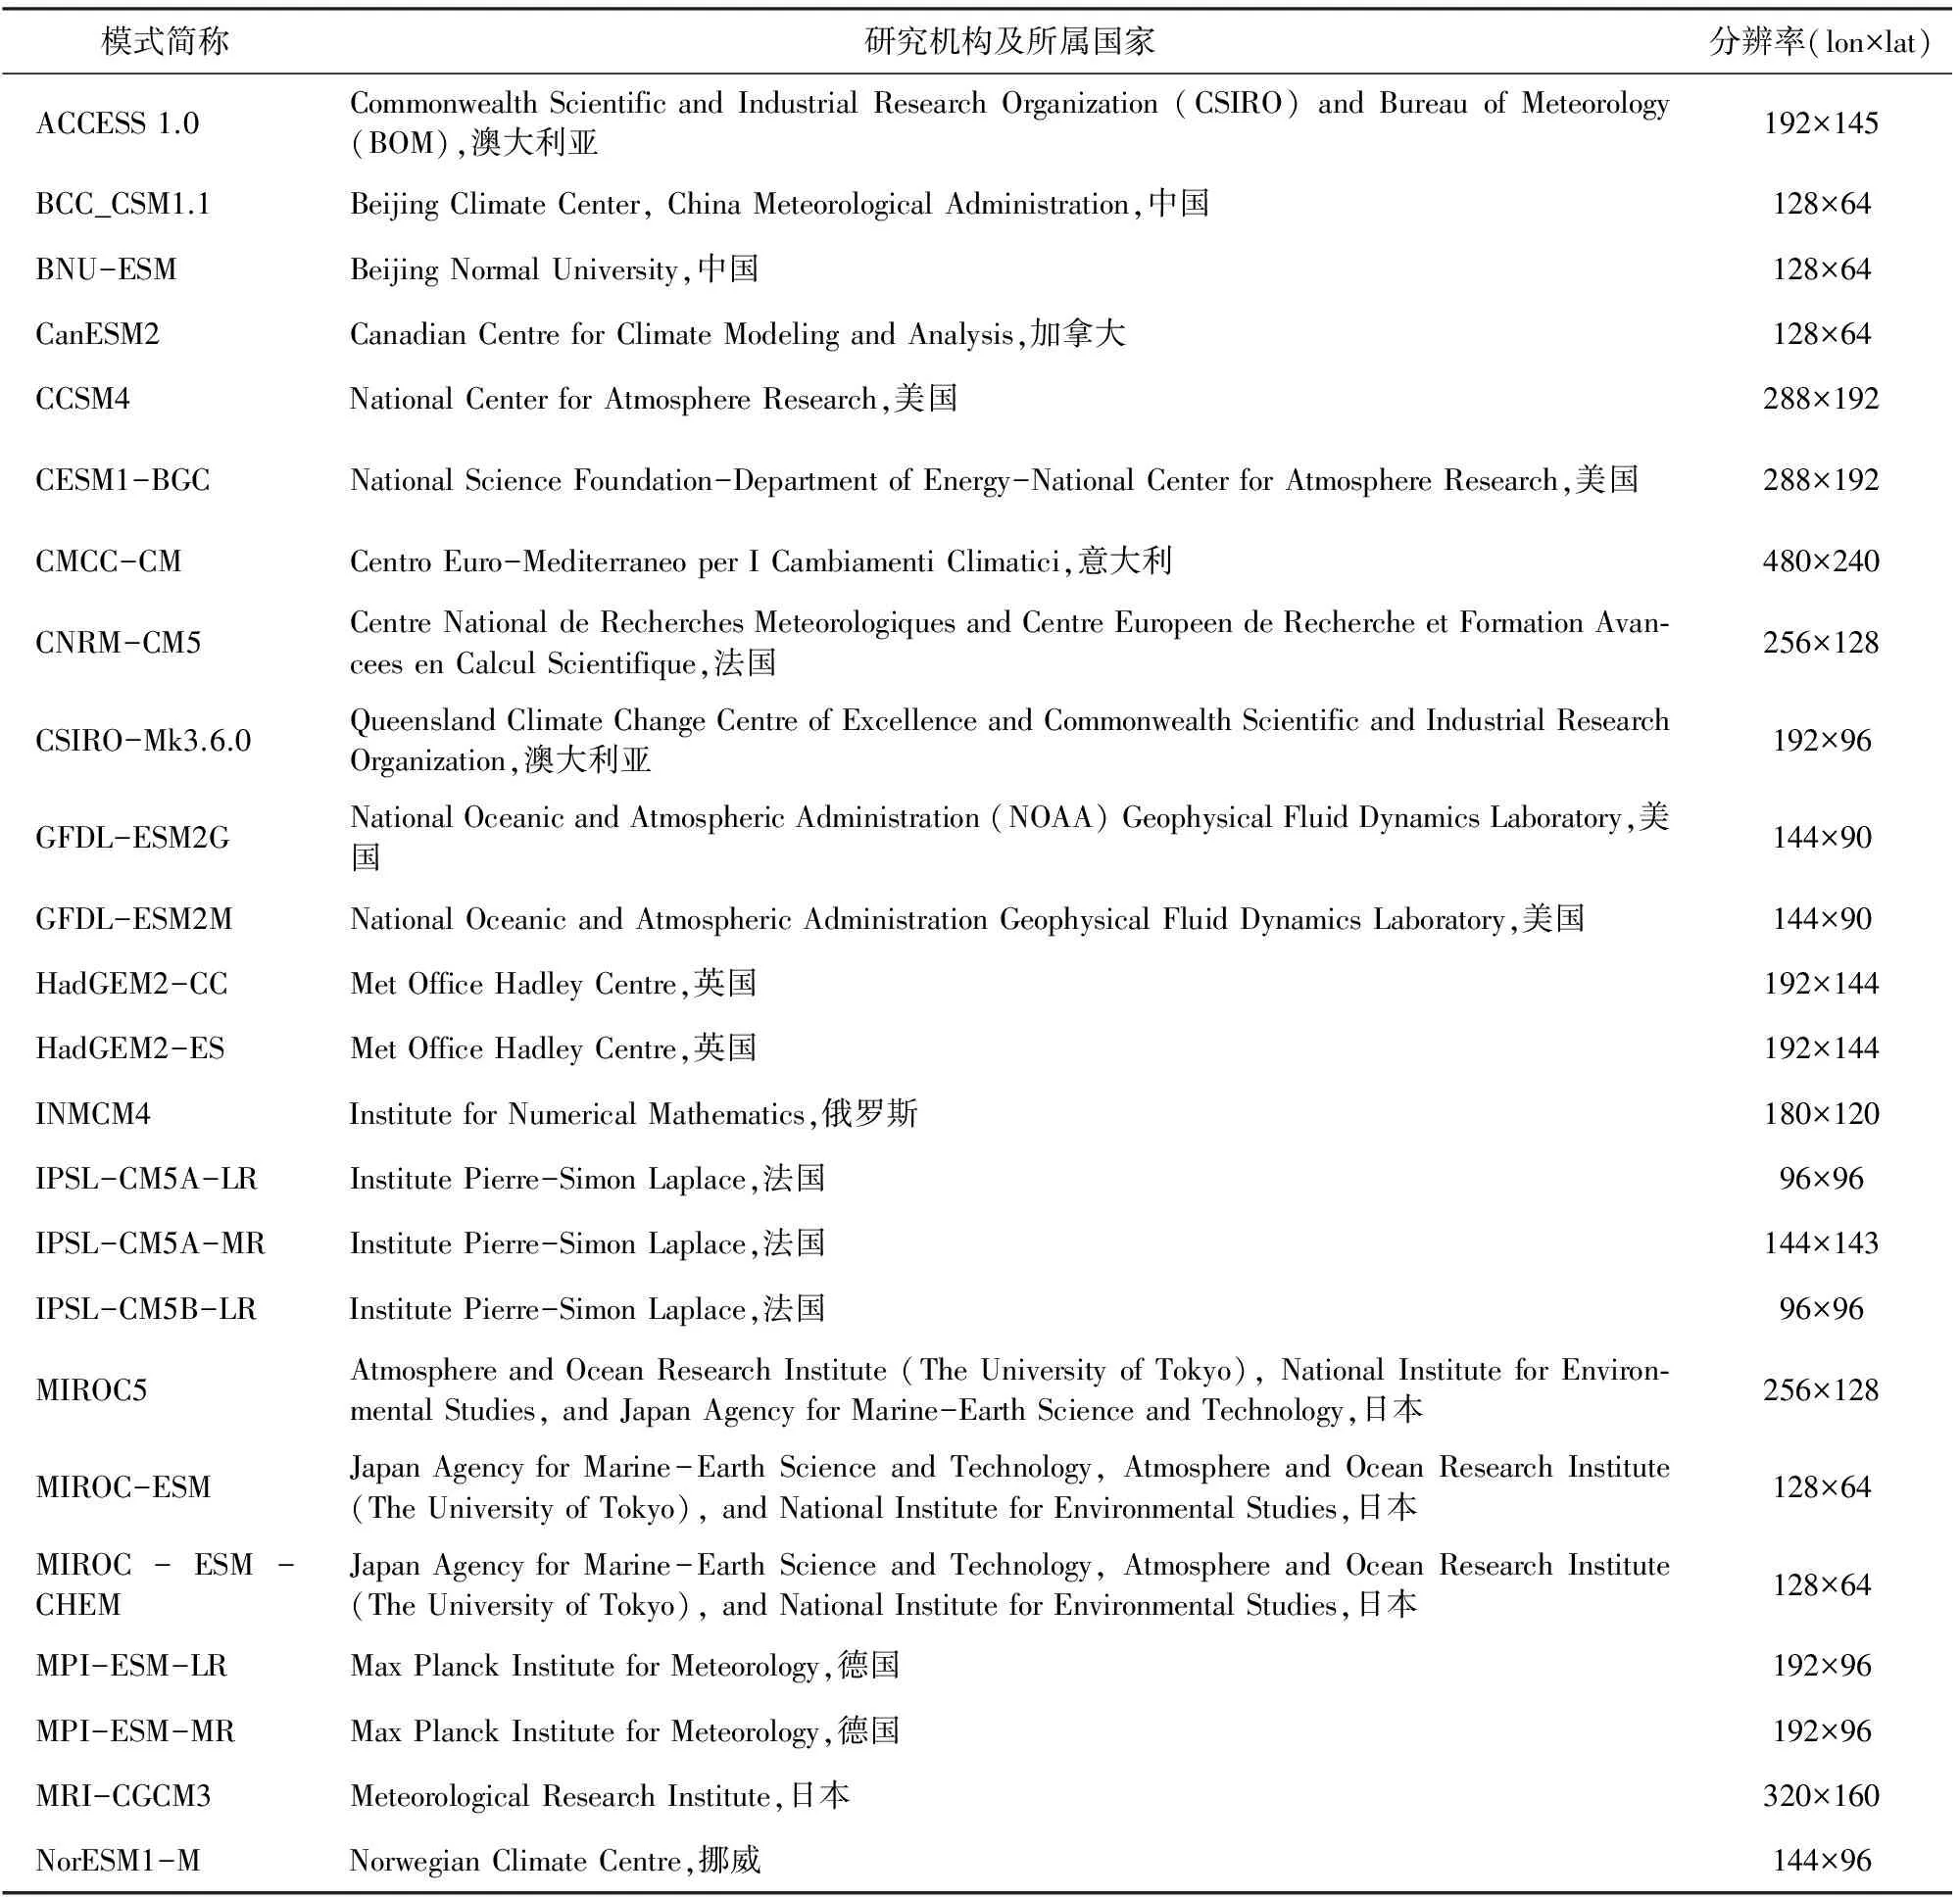
表1 模式介绍Table 1 Model information
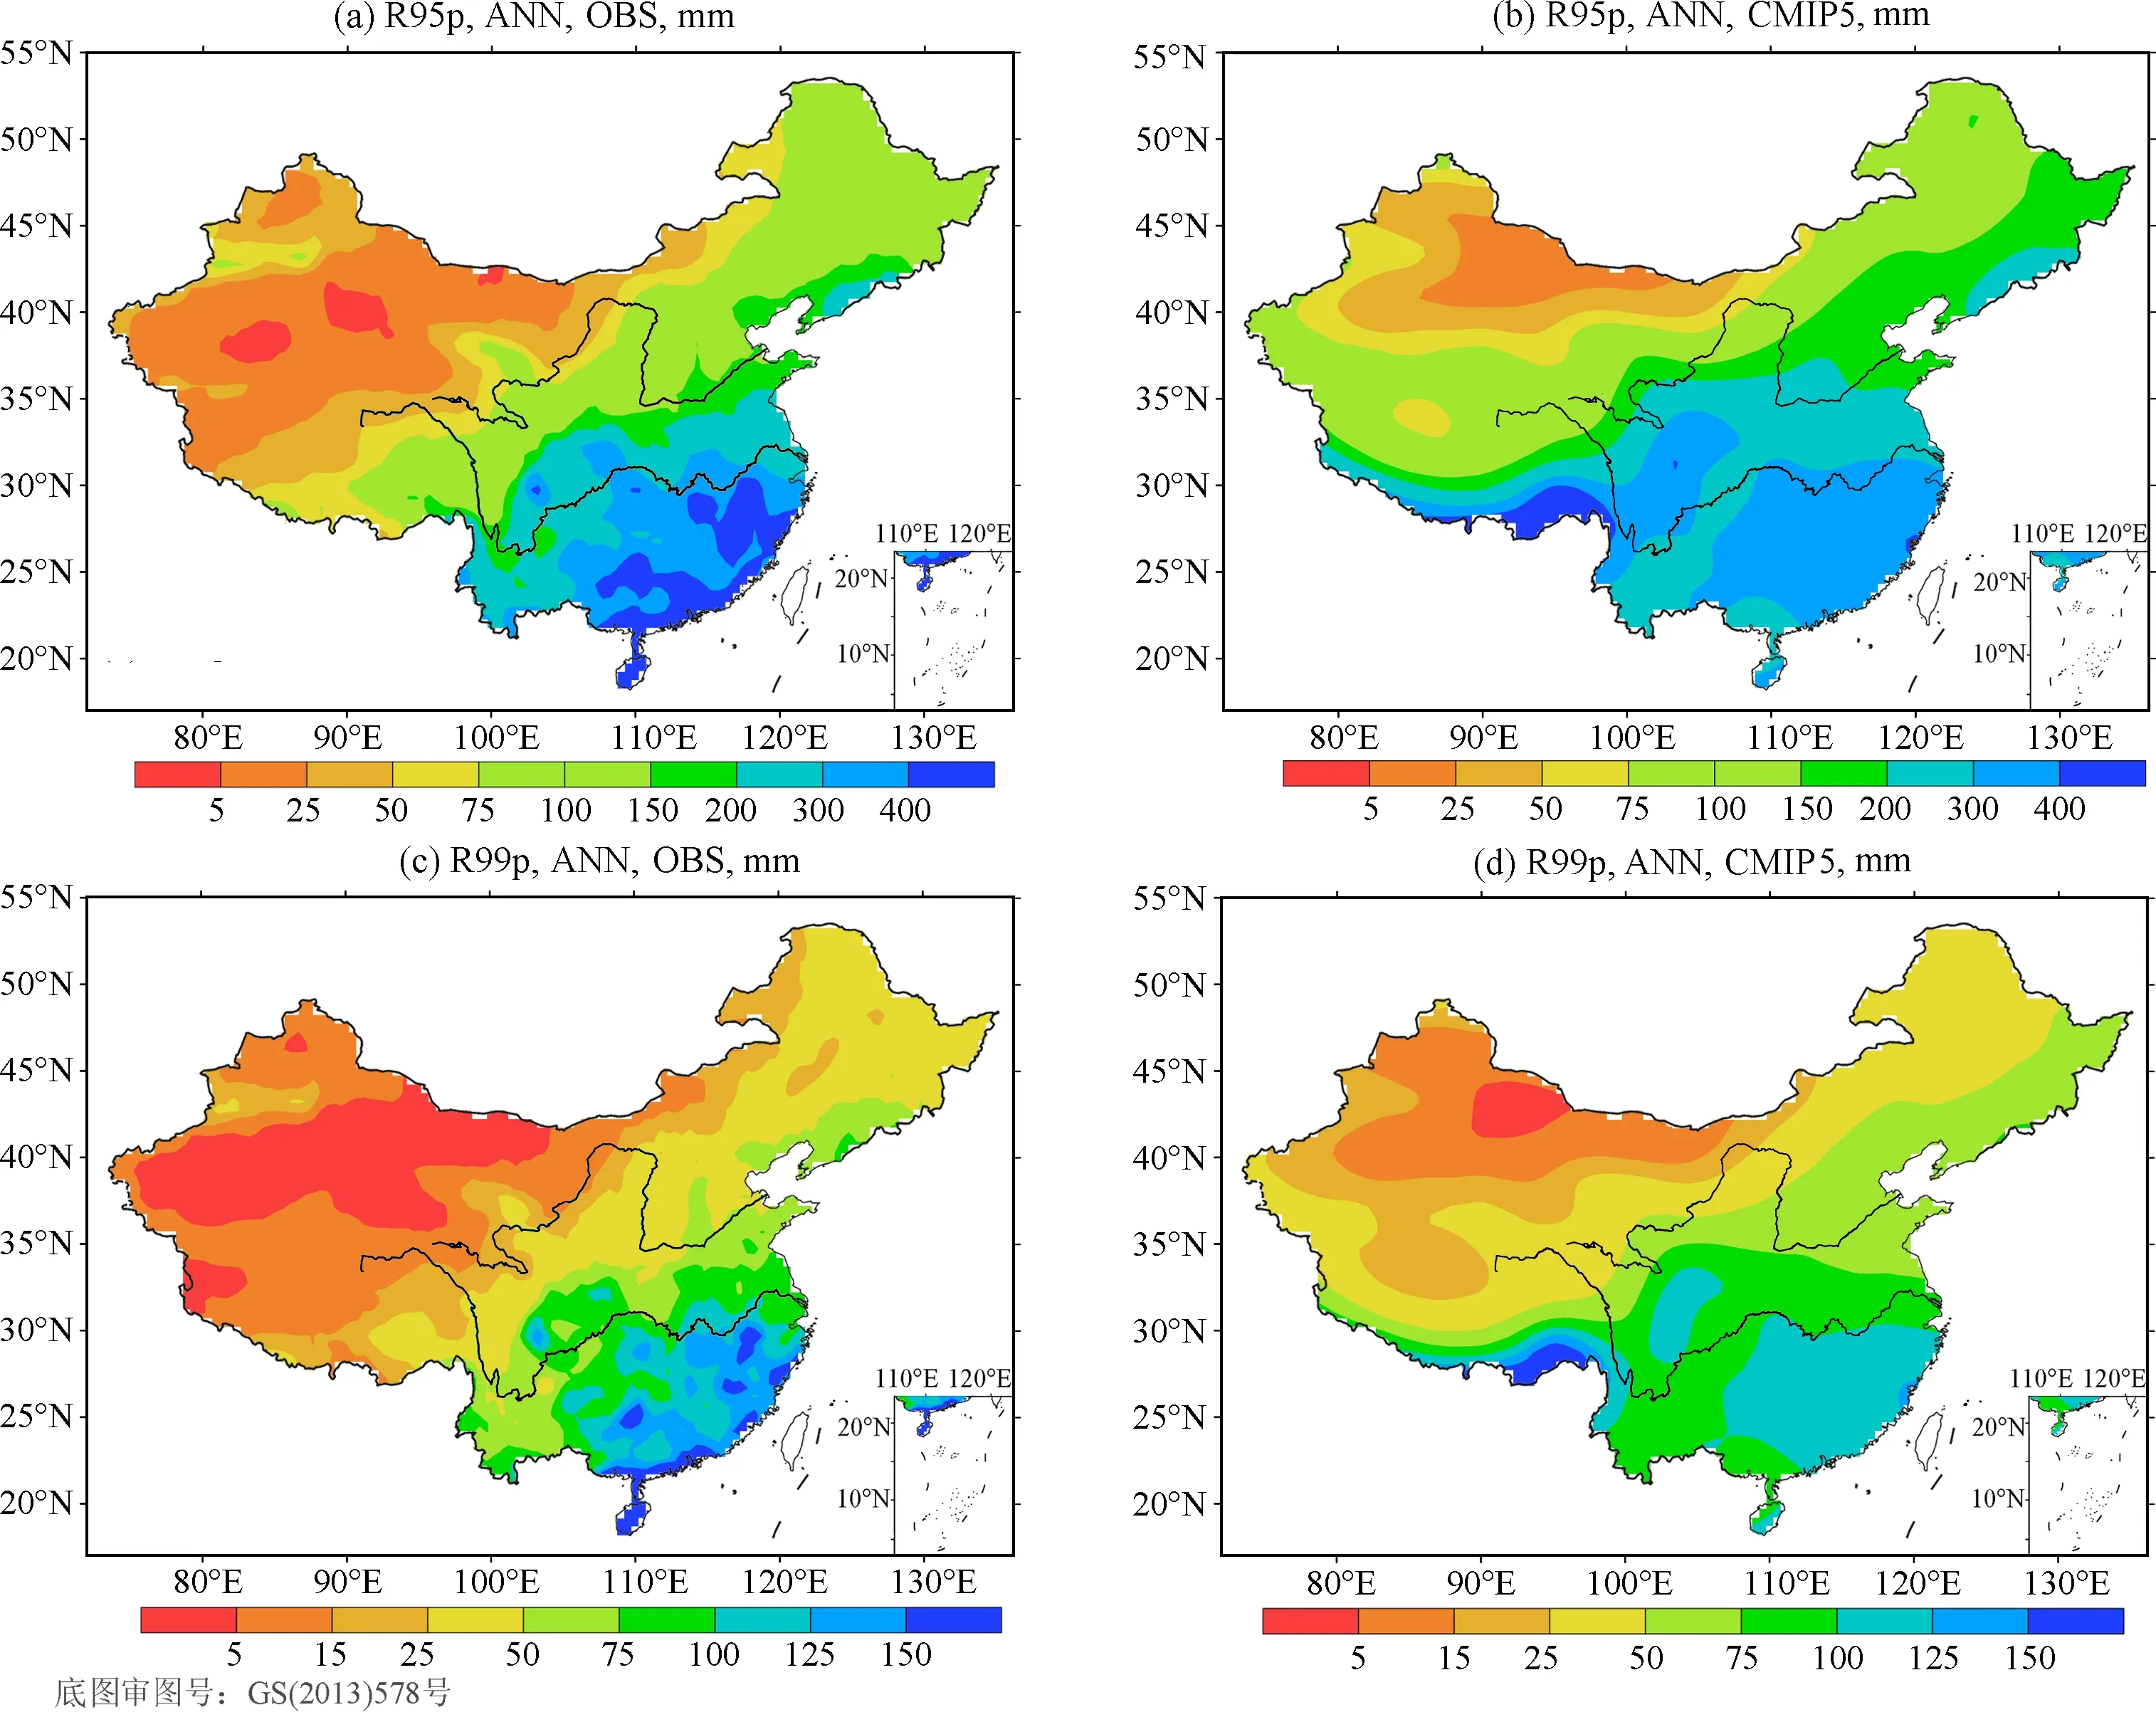
图3 观测和模拟的当代(1961—2005年)极端降水(mm)分布(台湾资料缺省)(a)观测R95p;(b)模拟R95p;(c)观测R99p;(d)模拟R99pFig.3 Distribution of observed and simulated precipitation extremes (mm) averaged for 1961—2005 over China(a) Observed R95p; (b) Simulated R95p; (c) Observed R99p; (d) Simulated R99p.
为分析中国不同区域降水与气候变暖的定量关系,根据第二次气候变化国家评估报告(气候变化国家评估报告编写委员会, 2011)的区划,本文将中国(CN)分为8个子区(图1),即NEC(东北),NC(华北),EC(华东),CC(华中),SC(华南),SWC1(青藏高原),SWC2(西南),NWC(西北).本研究重点分析24个耦合模式在等权重系数下的多模式集合平均(MME)结果,该方法广泛应用于气候变化预估研究(Meehl et al.,2007;Jiang et al.,2009;陈活泼,2013).平均降水和极端降水对增暖响应的定量判断计算采用线性拟合方法.研究指出,利用这种方法来研究降水对气温的响应较为合理(Lambert et al.,2008).
3 中国平均降水和极端降水对增温响应的模拟能力评估
首先通过与观测资料的对比,评估CMIP5多模式集合平均对中国区域气温、平均降水和极端降水空间分布的模拟能力.图2和图3分别给出了CN05.1和Historical试验模拟的1961—2005年中国区域平均气温、降水和极端降水的分布.由图2可以看到,观测中气温(图2a)在中国东部受纬度影响呈北冷南暖的形势,西部则受地形影响显著.CMIP5模式(图2b)很好地再现了观测中气温的分布型,模拟的平均气温与观测的空间相关系数高达0.96(通过99%统计显著检验).但模拟在中国西部至内蒙一带及东北等地存在偏冷的误差,西北部分地区偏冷超过2 ℃,这种系统性冷偏差在以往的全球模式模拟中也普遍存在,可能与全球气候模式分辨率较粗,对于地形的描述存在误差有关(Jiang et al.,2005;许崇海等,2007;Xu and Xu,2012).观测中年平均降水(图2c)呈东南沿海向西北内陆逐渐减少的分布,东南沿海降水最多,达1500 mm以上,西北的盆地附近最少,不到50 mm.CMIP5模式(图2d)能够较好的模拟出观测中的降水分布,模拟与观测的空间相关系数为0.79(通过99%统计显著检验).不过,模式模拟的降水在长江以北大部分地区普遍偏多,西北和青藏高原偏多达75%以上,这种现象也存在于以往的全球模式中,同样与全球模式对于复杂地形的反映有限有关(Jiang et al.,2005;Phillips and Gleckler,2006;Xu and Xu,2012),南方地区偏差较小,在±10%之间.
观测中R95p(图3a)和R99p(图3c)的分布与年平均降水(图2c)类似,其分布特点基本为由东南沿海向西北内陆递减,东南沿海的R95p和R99p分别达400 mm和125 mm以上,西北的盆地附近基本不足10 mm.CMIP5模式对这两个极端降水指数的分布具有较好的模拟能力(图3b和图3d),模拟与观测的空间相关系数值分别为0.78和0.77(均通过99%统计显著检验).与平均降水类似,模式对极端降水分布的模拟也存在北方地区模拟偏多的误差,尤其在西北地区,偏差达75%以上,这种偏差同样与模式对地形的刻画能力不足有关.南方大部分地区模拟偏差较小,偏差值在±10%之间.
图4给出了观测和模拟集合平均数据揭示的中国区域平均气温与降水、极端降水对应关系的散点图.其中,横坐标为中国区域平均的气温距平,纵坐标为平均降水或极端降水距平(均相对于1986—2005年).该图可以反映温度距平和降水、极端降水距平的对应关系.由图4a可见,1961—2005年的气温变化在-1~1 ℃之间,相应的降水变化介于-3%~3%,平均降水距平与气温距平时间序列的相关系数为0.28(通过90%统计显著检验).模拟(图4b)中平均降水变化与气温之间也存在明显的线性对应关系,两者的相关系数为0.37,通过99%统计显著检验.就中国区域平均而言,温度每增加1 ℃,观测中降水增加2.7%;MME模拟中增加1.3%,比观测偏小.其原因可能是模式对于气溶胶及其辐射效应、云物理过程的模拟存在偏差,导致模拟的降水对气温的敏感性比观测要弱(Lambert et al.,2008).通过对比24个模式的响应情况发现,有3个模式(CCSM4,INMCM4,MIROC5)模拟的响应值较观测偏大,其余均偏小,其中3个模式(GFDL-ESM2G,MIROC-ESM,MRI-CGCM3)为负响应,与观测相反(见表2).
观测中极端降水指数R95p(图4c)的变化在±10%之间,与气温距平的相关系数为0.32(通过99%统计显著检验),R99p(图4e)的变化较平均降水和R95p都要大,介于±15%之间,与气温距平的相关系数也为0.32(通过99%统计显著检验).气温每升高1 ℃,中国区域平均R95p将增加7.8%,R99p则将增加11.7%.MME模拟同样能够再现极端降水变化与增温之间的线性对应关系,相比年平均降水更为敏感.R95p和R99p的变化值则分别在-5%~5%和-15%~5%之间(图4d、4f).模拟的2个极端降水指数距平与气温距平的相关系数均高于0.85,通过99%统计显著检验.从回归关系来看,中国平均气温每升高1 ℃,R95p和R99p分别增加8.0%和15.3%,高于观测揭示的7.8%和11.7%.模拟的极端降水对增温的响应偏强,可能与CMIP5模式对中国地区R95p和R99p事件的模拟偏强有关(陈晓晨,2014).就单个模式而言,模拟的R95p响应值变化范围为1%(MIROC-ESM-CHEM)~12.3%(MIROC5).其中,有10个模式的响应值比观测值偏大;R99p响应范围介于1.8%(MIROC-ESM-CHEM)~20.8%(GFDL-ESM2M和MPI-ESM-LR),其中,15个模式模拟的响应值高于观测值(见表2).
进一步给出了针对中国及8个区域的观测和模拟结果(图5).可以看到,观测中东北、华北、华中和西南地区年平均气温每升高1 ℃,降水将分别减少-0.9%、-4.4%、-3.7%和-4.2%,MME模拟出了华中和西南的负响应,但模拟比观测偏弱.观测中其他地区平均降水对升温的响应均为正,青藏高原地区最为敏感,气温每升高1 ℃,年平均降水增加4.8%.MME模拟可以再现青藏高原、西北及中国区域平均的正响应,但与观测之间仍存在一定偏差.此外,东北、华北、华东及华南地区模拟的响应与观测相反(图5a).对于这四个区域,24个模式中分别有12、11、9和17个模式的模拟值与观测值相反.就R95p(图5b)来看,观测中除东北、华北和华中外,其他地区均为增加;MME模拟则在中国及8个子区域都为增加.模式模拟的华东和中国区域平均的响应值与观测值最为接近,青藏高原和西北地区的响应偏强,华南和西南地区则偏弱,东北、华北和华中地区与观测相反,24个模式中模拟值与观测值相反的模式分别有8、12和10个.观测中青藏高原的R99p(图5c)对增温的响应为弱的减少,气温每升高1 ℃,R99p减少0.5%,而MME模拟表现为增加22.3%(共有22个模式呈现正的响应特征).观测中其他区域R99p对温度的响应均为增加;模拟除在华东地区较观测偏弱外,其他地区都表现为偏强.
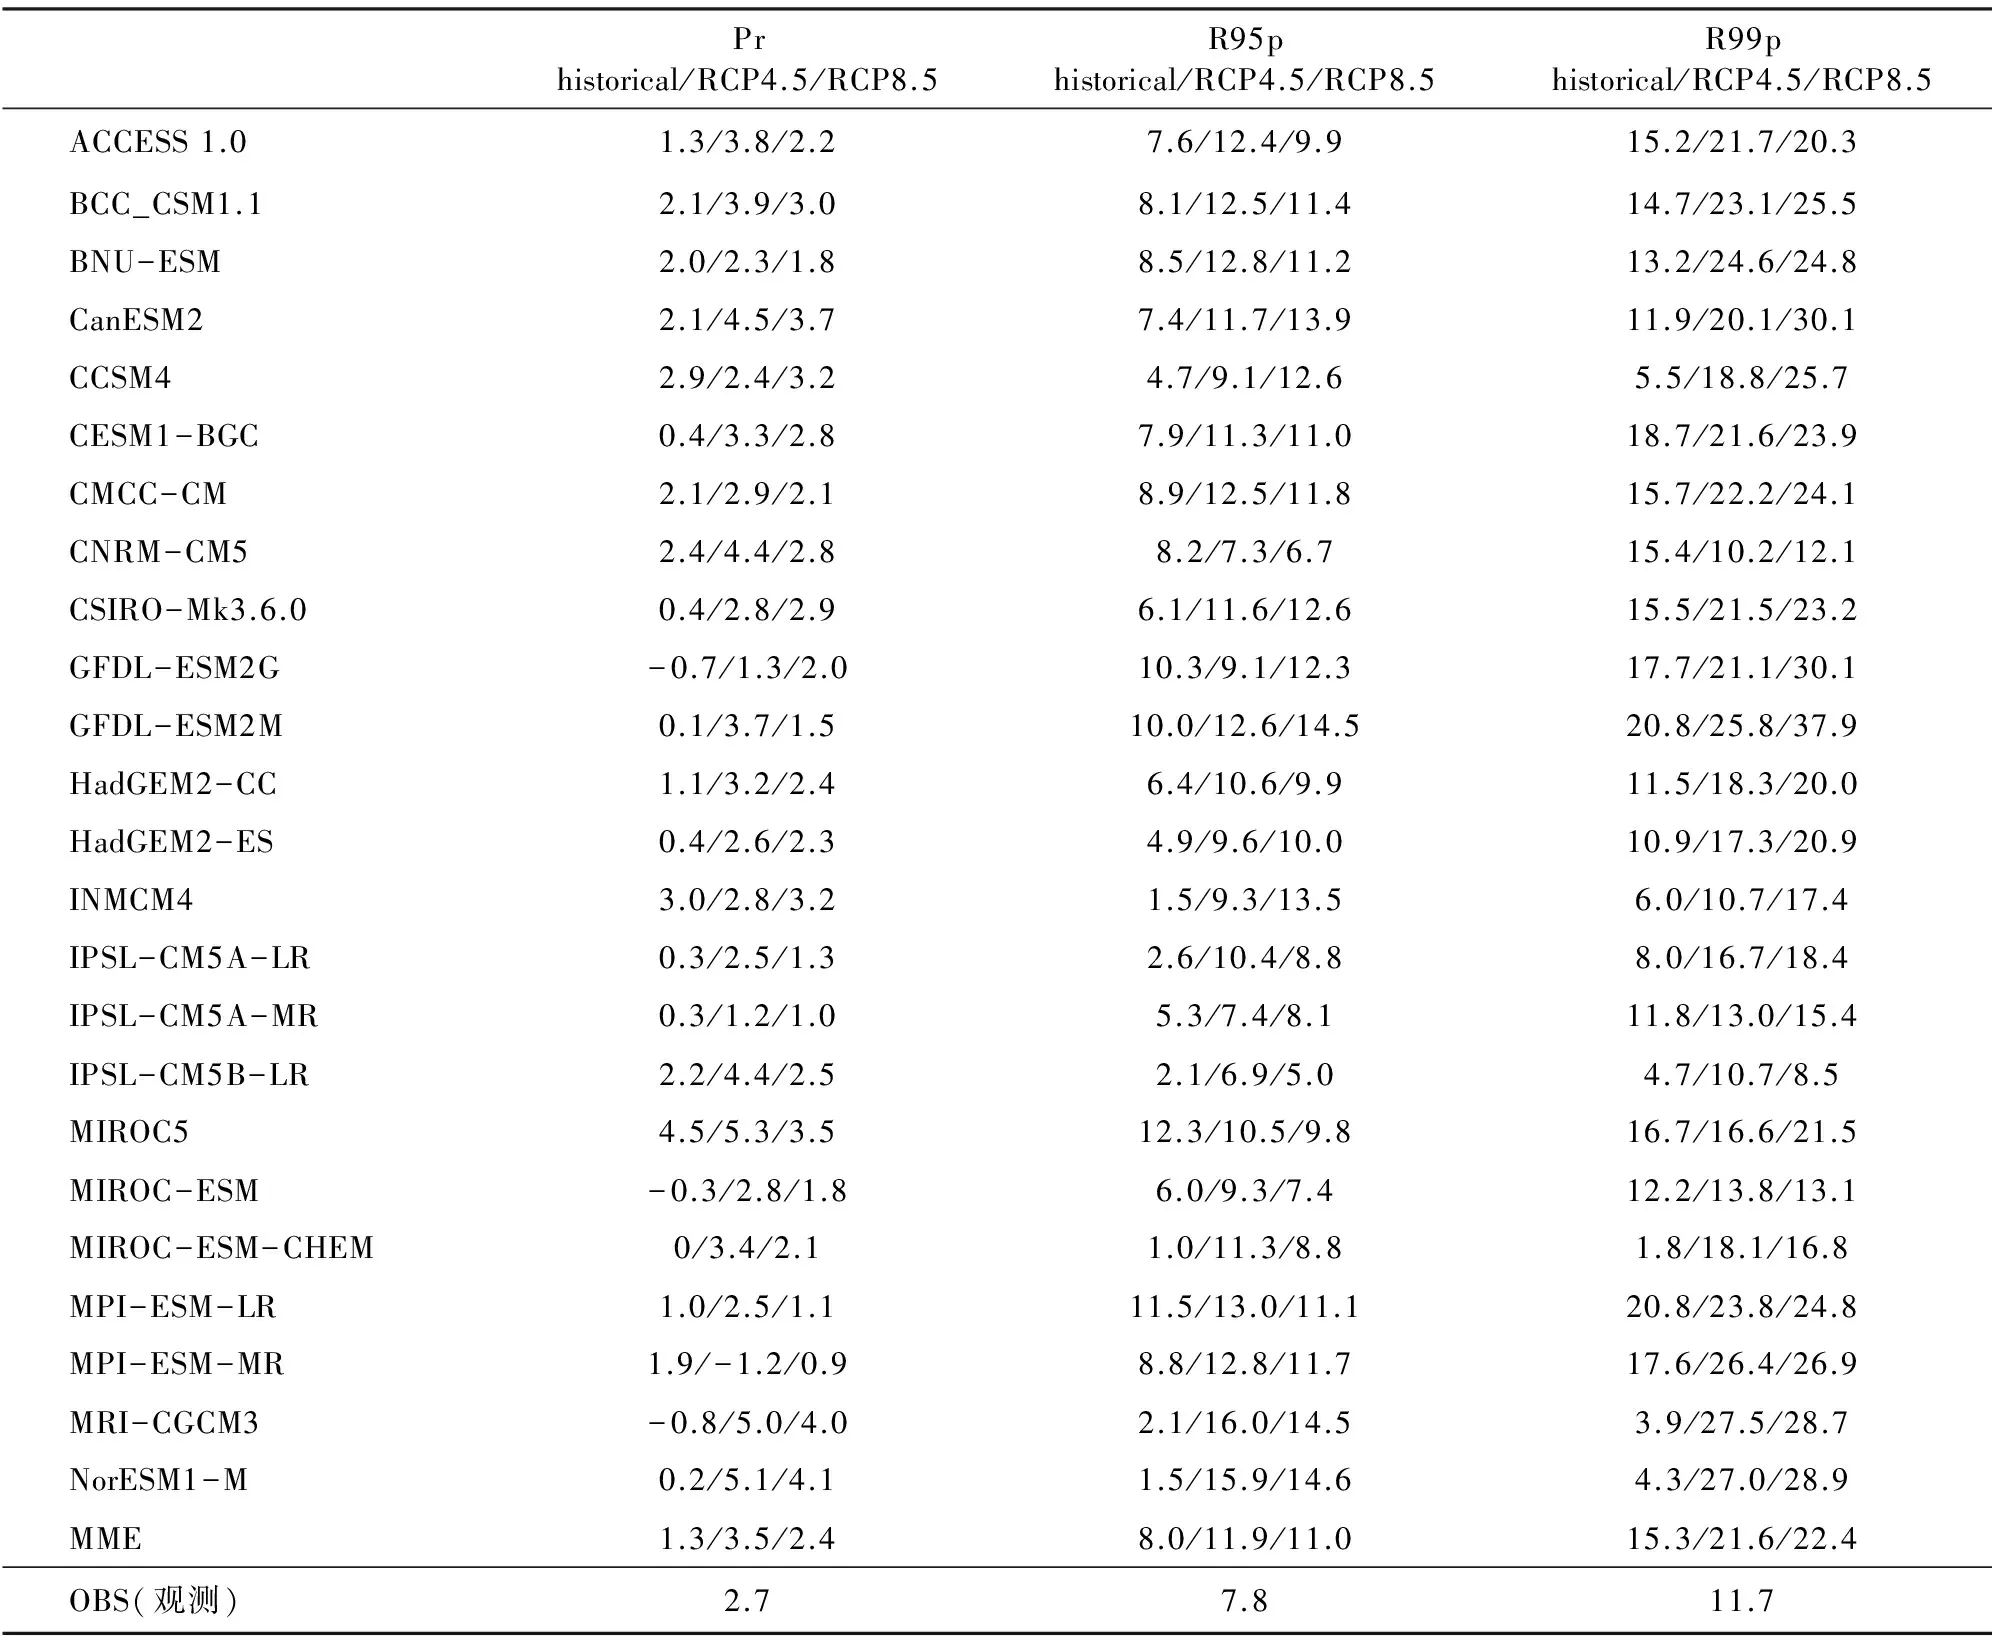
表2 观测和模式模拟的中国区域平均降水、极端降水对增暖的响应(单位:%/℃)Table 2 Response of mean precipitation and precipitation extremes to warming over China region from observation and model simulations (unit: %/℃)
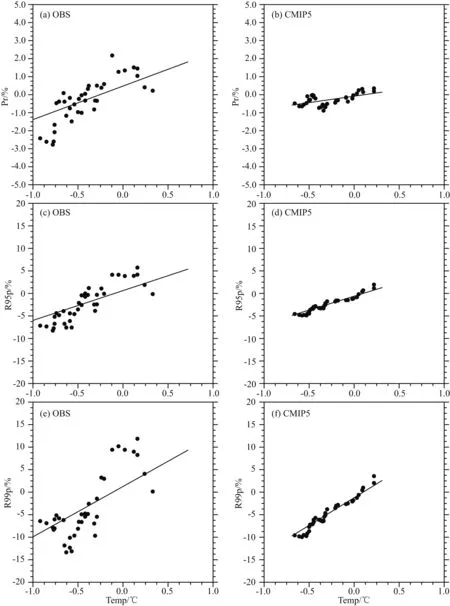
图4 观测和模拟的1961—2005年(相对于1986—2005)中国区域(a,b)平均降水、(c,d)R95p和(e,f)R99p对增温响应的散点图(横坐标:气温距平,℃;纵坐标:平均降水、R95p和R99p距平,%)Fig.4 Scatter plots of observed and simulated responses of (a, b) precipitation, (c, d) R95p and (e, f) R99p to warming during 1961—2005 (relative to 1986—2005) over China (X-coordinate: temperature anomaly (℃); Y-coordinate: precipitation, R95p and R99p anomaly, %)
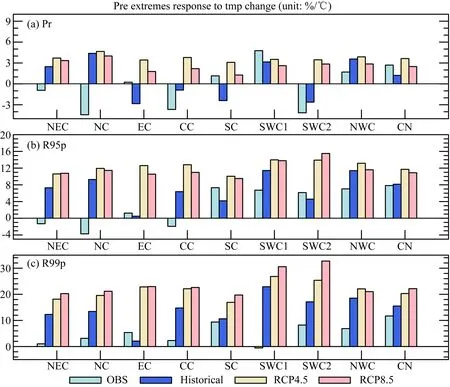
图5 中国及其8个分区(a)平均降水、(b)R95p和(c)R99p对升温的响应(单位:%/℃)浅蓝色:观测;深蓝色:historical模拟;黄色:RCP4.5预估;粉色:RCP8.5预估.Fig.5 Response of (a) annual mean precipitation, (b) R95p and (c) R99p over China and its subregions to warming (unit: %/℃)Light blue indicates observation, dark blue indicates historical simulation, yellow indicates RCP4.5 projection, and pink indicates RCP8.5 projection.
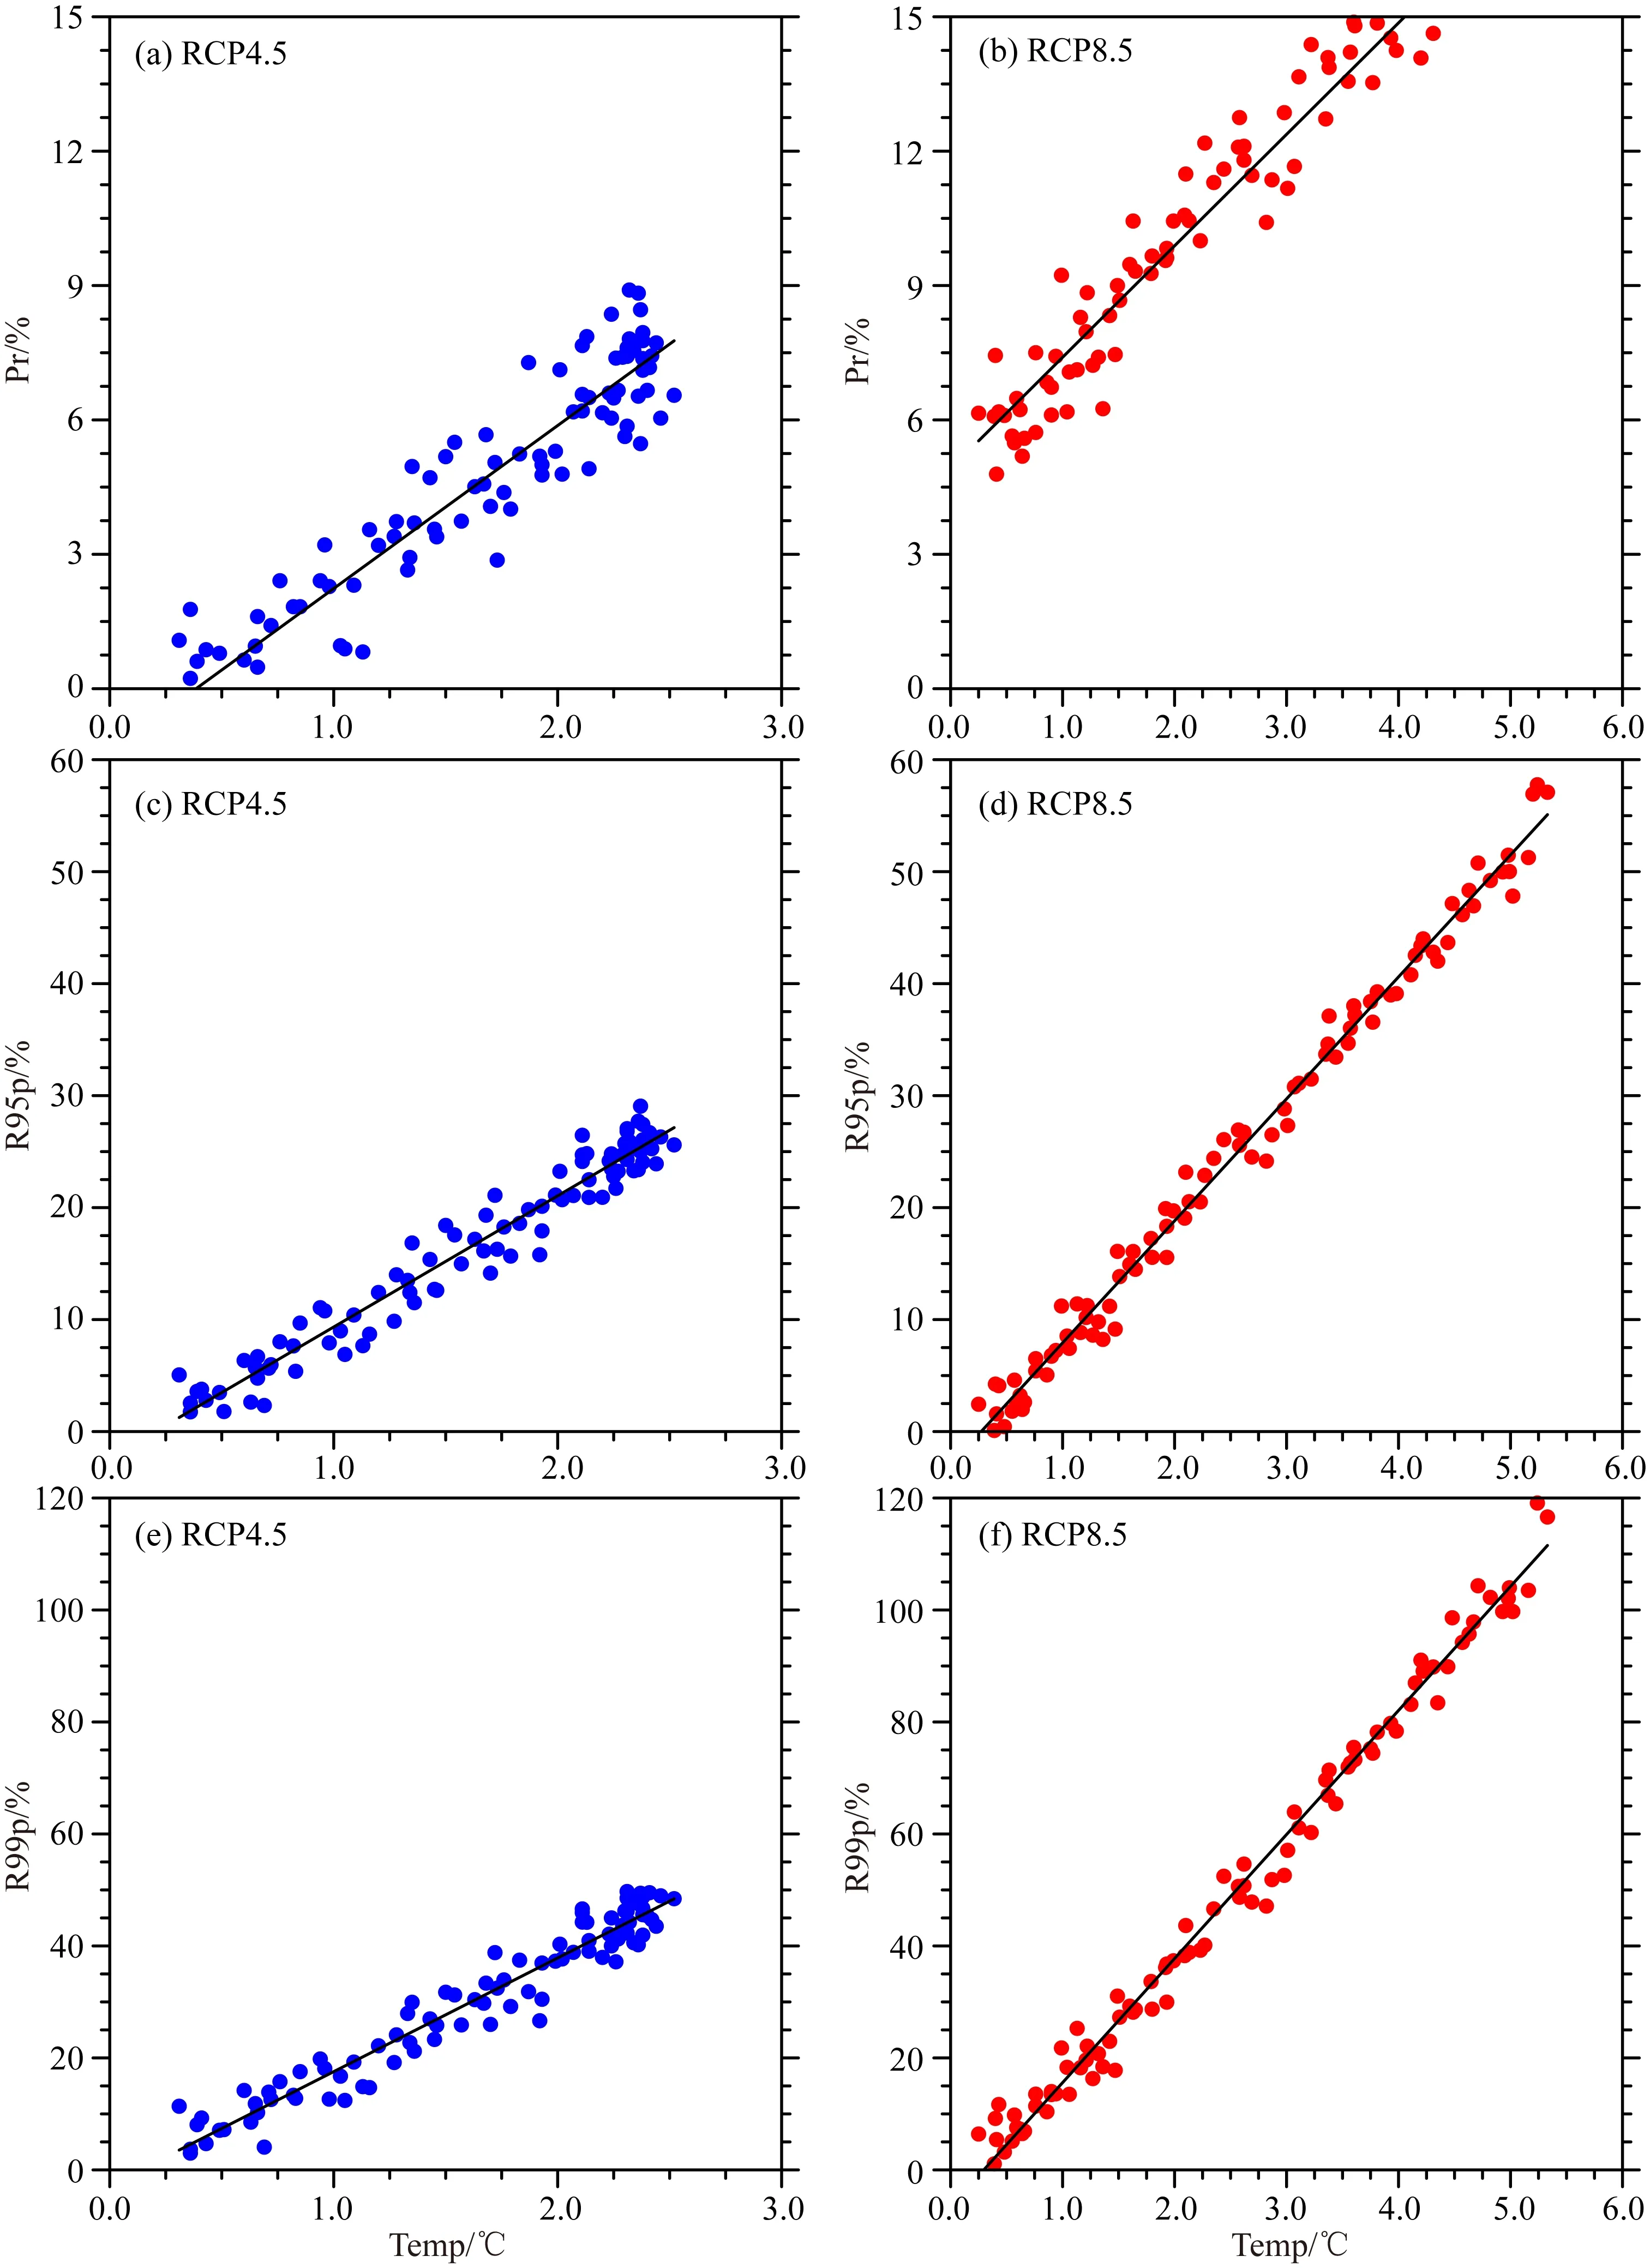
图6 RCP4.5和RCP8.5情景下2006—2099年(相对于1986—2005)中国区域(a,b)平均降水、(c,d)R95p和(e,f)R99p对增温响应的散点图(横坐标:气温距平,℃;纵坐标:平均降水、R95p和R99p距平,%)Fig.6 Scatter plots of projected responses of (a, b) mean precipitation, (c, d) R95p and (e, f) R99p to warming during 2006—2099 (relative to 1986—2005) over China under RCP4.5 and RCP8.5 scenarios (X-coordinate: temperature anomaly, ℃;Y-coordinate: precipitation, R95p and R99p anomaly, %)
总体而言,模式能够较好地模拟中国区域平均气温和降水、极端降水的空间分布.对中国及各子区域气温与降水、极端降水的关系的模拟也具有一定的能力,并且极端降水的模拟好于平均降水,这为其未来响应的定量预估奠定了基础.
4 未来变化预估
图6给出RCP4.5和RCP8.5排放情景下气温与年平均降水、极端降水的关系.可以看到,RCP4.5情景下,2006—2099年的增温值在0~3 ℃之间.相应的平均降水变化与增温的相关系数值达0.94,存在很好的线性对应关系(图6a),中国区域平均气温每升高1 ℃,MME模拟的平均降水将增加3.5%,明显高于当代.单个模式模拟的降水响应变化介于-1.2%(MPI-ESM-MR)~5.3%(MIROC5)之间,其中9个模式的模拟值高于集合平均值(表2).由图6c、6e可以看到,R95p和R99p变化对增温的响应更为敏感,相关系数值分别为0.98和0.97.MME预估结果显示,气温每升高1 ℃,R95p将增加11.9%,R99p将增加21.6%.单个模式模拟的R95p响应的变化幅度为6.9%(IPSL-CM5B-LR)~16.0%(MRI-CGCM3);模拟的R99p响应的变化范围介于10.2%(CNRM-CM5)~27.5%(MRI-CGCM3)之间(见表2).总的来说,RCP4.5情景下,平均降水和极端降水对增温的响应比当代要强,并且更强的极端降水指数变化更显著.
RCP8.5情景下,2006—2099年的升温幅度在0~6 ℃之间,明显高于RCP4.5情景.MME预估的平均降水变化与升温的相关系数达0.97,中国区域平均气温每升高1 ℃,平均降水增加2.4%(图6b),略低于RCP4.5情景.单个模式预估的变化幅度介于0.9%(MPI-ESM-MR)~4.1%(NorESM1-M)之间(表2).R95p和R99p的变化与升温之间存在很好的相关关系,相关系数值都为0.99(图6d、6f).同样可以看到,R95p对增温的敏感性比平均降水要高,但比更强的极端降水指数R99p要低.MME预估结果显示,气温每升高1 ℃,R95p和R99p将分别增加11.0%和22.4%.就单个模式而言,气温每升高1 ℃,R95p将增加5.0%(IPSL-CM5B-LR)~14.6%(NorESM1-M),R99p将增加8.5%(IPSL-CM5B-LR)~37.9%(GFDL-ESM2M)(表2).注意到,RCP8.5情景下,平均降水和极端降水对升温的响应幅度与RCP4.5情景相比并没有明显差异,同时,两种情景下的响应程度分别与Chen和Sun(2014)在2倍和3倍CO2排放情景下的模拟结果相当.
以下进一步探讨RCP4.5和RCP8.5情景下中国8个区域的平均降水和极端降水对增温的敏感性差异.由图5a可以看到,南方地区(包括华东、华中、华南和西南)当代年平均降水对增温的响应都为负,未来在变暖背景下则均转为明显的正响应,其他地区当代和未来均为正响应.RCP4.5情景下平均降水对增暖的敏感性最高,RCP8.5情景则较RCP4.5稍低.RCP4.5情景下,各分区年平均降水对增温的响应幅度普遍在(3%~5%)/℃之间,华北地区的敏感性最高,气温每升高1 ℃,平均降水增加4.7%,华南地区敏感性最低,为2.8%.RCP8.5情景下,各分区年平均降水对增温的响应幅度较RCP4.5要小,在(1%~4%)/℃之间,华北和华南仍分别为最敏感和最不敏感区域,气温每升高1 ℃,平均降水分别增加3.9%和1.3%.
图5b给出未来极端降水指数R95p对增温的响应,可以看到,相比当代,RCP4.5和RCP8.5情景下各分区R95p对增温的响应值均将增大,但各区域之间的差异比当代要小,青藏高原和西南地区最为敏感.RCP4.5情景下,气温每升高1 ℃,中国及各分区的R95p都将增加10%以上,青藏高原和西南地区则都为14.1%,东北和华南地区增加值相对较小,分别为10.8%和10.2%.RCP8.5情景下各区域的响应强度与RCP4.5一致,青藏高原增加13.9%,西南地区则比RCP4.5要高,为15.7%,东北和华南分别增加10.9%和9.7%.注意到,RCP8.5情景下,R95p对增温的响应与RCP4.5类似,但除东北和西南地区较RCP4.5略高外,RCP8.5情景对增暖的敏感性总体比RCP4.5要低.
更强的极端强降水指数R99p对升温的响应最为敏感(图5c),未来各分区的响应幅度也将进一步增强.与R95p类似,青藏高原和西南地区敏感性最高,东北和华南最低.RCP4.5情景下,气温每升高1 ℃,各分区R99p增加均将超过18%,青藏高原和西南地区增加值分别达到27.9%和25.7%,东北和华南则分别为18.4%和17.2%,其他区域基本介于18%~22%之间.RCP8.5情景下,气温每升高1 ℃,青藏高原的R99p增加最显著,达30.7%,西南地区次之,为33.2%,相对来说,东北和华南的响应仍较小,分别为20.5%和20.1%,其他区域增加值在20%~23%左右.注意到,与平均降水和R95p不同的是,R99p在RCP8.5情景下的响应比RCP4.5情景要大.
5 总结与讨论
本文利用CMIP5中的24个耦合模式结果,分析了当代、RCP4.5和RCP8.5情景下中国平均降水和极端降水对气候变暖的响应特征,并进一步探讨了中国8个子区域的敏感性差异,得出以下结论.
CMIP5模式能够较好地模拟出当代中国区域平均气温、平均降水和极端降水的空间分布特征.中国区域平均降水和极端降水的变化与增温存在很好的线性对应关系,CMIP5模式模拟的平均降水对增温的响应较观测偏弱,极端降水则偏强,这与模式对平均降水和极端降水的模拟存在偏差有关,除此之外观测资料的不确定性也是一个方面(叶柏生等,2008;Xu et al.,2009c;Li and Yan,2010;吴佳和高学杰,2013).MME预估的未来平均降水和极端降水对增暖的敏感性都比当代要高,并且极端强降水量(R99p)对于增暖的敏感性最高.由此可以看出,随着中国区域气温的升高,平均降水和极端降水均呈现一致增加的趋势.
对于各分区来说,未来平均降水对增暖的响应在北方大部分地区较大,R95p和R99p对增暖的敏感性更高.总的来看,当代平均降水和极端降水对增温的响应存在较大的差异,未来的差异则有所减小.与中国区域平均类似,各子区域未来极端降水对增暖的响应均比平均降水要敏感,R99p的敏感性最高.在RCP4.5和RCP8.5情景下,各分区平均降水和极端降水对增暖的敏感性都将升高,并且一些在当代为负响应的区域,未来也都转为正响应.极端指数R95p和R99p对增暖的响应均在青藏高原和西南地区最为敏感,东北和华南敏感性较低.
尽管CMIP5耦合模式在各方面均比以往的全球模式有一定的改进和提高,但其模拟的降水及其变化还存在较大的不确定性(Taylor et al.,2012;陈活泼,2013).未来可以利用高分辨率区域气候模式的集合结果开展研究,可望得到更可靠的结论(Gao et al.,2012;Wu et al.,2015).以往的研究还指出降水和极端降水在不同的季节对增暖的响应存在差异(孙建奇和敖娟,2013),因此进行分季节探讨可以得到更全面的结果.另外,本研究只是关注气候变化本身,未来也有必要从气候变化相对于背景变率的信噪比角度开展进一步的工作(Sui et al., 2014).
Chen H P. 2013. Projected change in extreme rainfall events in China by the end of the 21st century using CMIP5 models.ChineseSci.Bull., 58(12): 1462-1472, doi: 10.1007/s11434-012-5612-2.Chen H P, Sun J Q. 2014. Sensitivity of climate changes to CO2emissions in China.Atmos.OceanicSci.Lett., 7(5): 422-427, doi: 10.3878/j.issn.1674-2834.14.0028.Chen X C. 2014. Assessment of the precipitation over China simulated by CMIP5 multi-models [Master′s thesis] (in Chinese). Beijing: Chinese Academy of Meteorological Science. Gao X J, Shi Y, Zhang D F, et al. 2012. Uncertainties in monsoon precipitation projections over China: Results from two high-resolution RCM simulations.ClimateRes., 52: 213-226, doi: 10.3354/cr01084.
Gao X J, Wang M L, Giorgi F. 2013. Climate change over China in the 21st century as simulated by BCC_CSM1.1-RegCM4.0. Atmos.OceanicSci.Lett., 6(5): 381-386, doi: 10.3878/j.issn.1674-2834.13.0029.
Huang Y Y, Wang H J, Fan K. 2014. Improving the prediction of the Summer Asian-Pacific oscillation using the interannual increment approach.J.Climate, 27(21): 8126-8134, doi: 10.1175/JCLI-D-14-00209.1.
Huang Y Y, Wang H J, Fan K, et al. 2015. The western Pacific subtropical high after the 1970s: westward or eastward shift?.ClimateDyn., 44(7-8): 2035-2047, doi: 10.1007/s00382-014-2194-5.
IPCC. 2013. Climate change 2013: the physical science basis. ∥Stocker T F, Qin D H, Plattner G K, et al. eds. Contribution of Working Group I to the Fifth Assessment Report of the Intergovernmental Panel on Climate Change. Cambridge, United Kingdom and New York, NY, USA: Cambridge University Press, 1535.Jiang D B, Wang H J, Lang X M. 2005. Evaluation of East Asian climatology as simulated by seven coupled models.AdvancesinAtmosphericSciences, 22(4): 479-495.
Jiang D B, Zhang Y, Sun J Q. 2009. Ensemble projection of 1~3 ℃ warming in China.ChineseSci.Bull., 54(18): 3326-3334.Lambert F H, Stine A R, Krakauer N Y, et al. 2008. How much will precipitation increase with global warming.EOS, 89(21): 193-200.
Lang X M, Sui Y. 2013. Changes in mean and extreme climates over China with a 2 ℃ global warming.ChineseScienceBulletin, 58(12): 1453-1461.Li H M, Feng L, Zhou T J. 2011. Multi-model projection of July-August climate extreme changes over China under CO2doubling. Part I: Precipitation.Adv.Atmos.Sci., 28(2): 433-447.
Li Z, Yan Z W. 2010. Application of multiple analysis of series for homogenization to Beijing daily temperature series (1960—2006).Adv.Atmos.Sci., 27(4): 777-787.
Meehl G A, Stocker T F, Collins W D, et al. 2007. Climate change 2007: The physical science basis. ∥ Solomon S, Qin D, Manning M, et al., eds. Contribution of Working Group 1 to the Fourth Assessment Report of the Intergovernmental Panel on Climate Change. Cambridge, United Kingdom and New York: Cambridge University Press, 1-18.
Moss R H, Edmonds J A, Hibbard K A, et al. 2010. The next generation of scenarios for climate change research and assessment.Nature, 463(7282): 747-756.
National Report Committee. 2011. China′s National Assessment Report on Climate Change (in Chinese). Beijing: Science Press.Phillips T J, Gleckler P J. 2006. Evaluation of continental precipitation in 20th century climate simulations: the utility of multimodel statistics.WaterResourcesResearch, 42(3): W03202, doi: 10.1029/2005WR004313.Qian W H, Fu J L, Yan Z W. 2007. Decrease of light rain events in summer associated with a warming environment in China during 1961-2005.Geophys.Res.Lett., 34: L11705, doi: 10.1029/2007GL029631.Sui Y, Lang X M, Jiang D B. 2014. Time of emergence of climate signals over China under the RCP4.5 scenario.ClimaticChange, 125(2): 265-276, doi: 10.1007/s10584-014-1151-y.
Sun J Q, Wang H J, Yuan W, et al. 2010. Spatial-temporal features of intense snowfall events in China and their possible change.J.GeophysRes., 115: D16110.
Sun J Q, Ao J. 2013. Changes in precipitation and extreme precipitation in a warming environment in China.ChineseSci.Bull., 58(12): 1395-1401, doi: 10.1007/s11434-012-5542-z.Taylor K E, Stouffer B J, Meehl G A. 2012. An overview of CMIP5 and the experiment design.Bull.Amer.Meteor.Soc., 93(4): 485-498.Trenberth K E, Fasullo J, Smith L. 2005. Trends and variability in column-integrated atmospheric water vapor.ClimateDyn., 24(7-8): 741-758.
Wang H J, Sun J Q, Chen H P, et al. 2012. Extreme climate in China: Facts, simulation and projection.Meteorol.Z., 21(3): 279-304.Wentz F J, Ricciardulli L, Hilburn K, et al. 2007. How much more rain will global warming bring.Science, 317(5835): 233-235.
Wu J, Gao X J. 2013. A gridded daily observation dataset over China region and comparison with the other datasets.ChineseJournalofGeophysics(in Chinese), 56(4): 1102-1111, doi: 10.6038/cjg20130406.
Wu J, Gao X J, Xu Y L, et al. 2015. Regional climate change and uncertainty analysis based on four regional climate model simulations over China.Atmos.OceanicSci.Lett., 8(3): 147-152, doi: 10.3878/AOSL20150013.Xu C H, Shen X Y, Xu Y. 2007. An analysis of climate change in East Asia by using the IPCC AR4 simulations.AdvancesinClimateChangeResearch(in Chinese), 3(5): 287-292.
Xu C H, Xu Y. 2012. The projection of temperature and precipitation over China under RCP scenarios using a CMIP5 multi-model ensemble.Atmos.OceanicSci.Lett., 5(6): 527-533.
Xu J Y, Shi Y, Gao X J, et al. 2013. Projected changes in climate extremes over China in the 21st century from a high resolution regional climate model (RegCM3).ChineseSci.Bull., 58(12): 1443-1452, doi: 10.1007/s11434-012-5548-6.
Xu Y, Gao X J, Giorgi F. 2009a. Regional variability of climate change hot-spots in East Asia.Adv.Atmos.Sci., 26(4): 783-792.Xu Y, Xu C H, Gao X J, et al. 2009b. Projected changes in temperature and precipitation extremes over the Yangtze River Basin of China in the 21st century.Quater.Int., 208(1-2): 44-52.
Xu Y, Gao X J, Shen Y, et al. 2009c. A daily temperature dataset over China and its application in validating a RCM simulation.Adv.Atmos.Sci., 26(4): 763-772.
Yang K Q, Jiang D B. 2014. Recent change of the South Asian High.Atmos.OceanicSci.Lett., 7(4): 330-333, doi: 10.3878/j.issn.1674-2834.14.0003.
Ye B S, Chen P, Yang D Q, et al. 2008. Effects of the bias-correction on changing tendency of precipitation over China.JournalofGlaciologyandGeocryology(in Chinese), 30(5): 717-725.
Zhai P M, Zhang X B, Wan H, et al. 2005. Trends in total precipitation and frequency of daily precipitation extremes over China.J.Climate, 18(7): 1096-1108.
Zhao P, Yang S, Yu R C. 2010. Long-term changes in rainfall over eastern China and large-scale atmospheric circulation associated with recent global warming.J.Climate, 23(6): 1544-1562.
Zhou B T, Wen Q H, Xu Y, et al. 2014. Projected changes in temperature and precipitation extremes in China by the CMIP5 multimodel ensembles.J.Climate, 27(17): 6591-6611.
附中文参考文献
陈活泼. 2013. CMIP5模式对21世纪末中国极端降水事件变化的预估. 科学通报, 58(8): 743-752.
陈晓晨. 2014. CMIP5全球气候模式对中国降水模拟能力的评估
[硕士论文]. 北京: 中国气象科学研究院.
气候变化国家评估报告编写委员会. 2011. 第二次气候变化国家评估报告. 北京: 科学出版社.
孙建奇, 敖娟. 2013. 中国冬季降水和极端降水对变暖的响应. 科学通报, 58(8): 674-679.
吴佳, 高学杰. 2013. 一套格点化的中国区域逐日观测资料及与其它资料的对比. 地球物理学报, 56(4): 1102-1111, doi: 10.6038/cjg20130406.
许崇海, 沈新勇, 徐影. 2007. IPCC AR4模式对东亚地区气候模拟能力的分析. 气候变化研究进展, 3(5): 287-292.
徐集云, 石英, 高学杰等. 2013. RegCM3对中国21世纪极端气候事件变化的高分辨率模拟. 科学通报, 58(8): 724-733.
叶柏生, 成鹏, 杨大庆等. 2008. 降水观测误差修正对降水变化趋势的影响. 冰川冻土, 30(5): 717-725.
(本文编辑 胡素芳)
Response of precipitation and its extremes over China to warming: CMIP5 simulation and projection
WU Jia1, ZHOU Bo-Tao1,2*, XU Ying1
1NationalClimateCenter,Beijing100081,China2CollaborativeInnovationCenteronForecastandEvaluationofMeteorologicalDisasters,NanjingUniversityofInformationScience&Technology,Nanjing210044,China
The relationship between regional precipitation change and warming is an important open issue in climate change physical science. Because precipitation in China has strong sensitivity to warming, quantitative assessment and projection on the responses of precipitation and its extremes in a warming world are crucial for better understanding of regional climate change and helpful for regional adaption to climate change.For this reason, based on simulations of 24 models from Coupled Model Intercomparison Project Phase 5 (CMIP5), this study assesses the ability of the models in simulating the responses of annual mean precipitation and its extremes to warming over China and its subregions, and then projects their change under the RCP4.5 and RCP8.5 scenarios that represent respectively a medium-low and high radiative forcing. The annual mean precipitation is defined as the total amount of precipitation from January to December. The precipitation extremes are measured by the R95p (very wet days) and R99p (extremely wet days) indices, which are defined by the Expert Team on Climate Change Detection and Indices (ETCCDI). According to the definition of ETCCDI, the R95p and R99p refer to annual total precipitation when the daily precipitation exceeds the 95th and the 99th percentile of the wet day precipitation, respectively. Eight subregions determined by administrative boundaries and societal and geographical conditions, i.e., NEC(Northeast China), NC(North China), EC(East China), CC(Central China), SC(South China), SWC1(Tibetan Plateau), SWC2(Southwest China), and NWC(Northwest China), are used in this study. The model performance is validated through the comparison for the time period from 1961 to 2005 between the historical simulation and the gridding observation dataset with a horizontal resolution of 0.25°×0.25° in latitude and longitude.Quantitative analysis shows that the CMIP5 multi-model ensemble(MME) can generally capture the spatial features of the temperature, mean precipitation and precipitation extremes as well as the relationship of precipitation and its extremes with temperature over China. However, it underestimates the response of mean precipitation while overestimates the response of precipitation extremes over China region in historical period. The CMIP5 MME also has some abilities in reproducing the responses of the mean precipitation and its extremes to the warming over the subregions of China, and better performance can be found for the precipitation extremes. Under the RCP4.5 and RCP8.5 scenarios, concurrent with the temperature rising, the mean precipitation and precipitation extremes are projected to increase consistently over China. As the regional mean temperature rises by 1 ℃, the mean precipitation will increase by 3.5% and 2.4%, and the R95p will increase by 8.0% and 11.9%, respectively. The response of R99p is much more sensitive, respectively with an increase of 15.3% and 21.6%. For the subregions of China, they all show positive response and the regional difference will decrease in the future. Moreover, the sensitivity of the precipitation extremes to the warming is higher than that of the mean precipitation. The stronger the precipitation extreme is, the higher sensitivity it will have. Besides, the response of the mean precipitation to the warming is larger in Northern China than in Southern China. The largest increases in R95p and R99p are projected in the Tibetan Plateau and Southwest China, indicating an increasing risk of heavy rainfall and floods.
Warming; CMIP5; Precipitation; Precipitation extremes; Regional response
吴佳, 周波涛, 徐影. 2015. 中国平均降水和极端降水对气候变暖的响应:CMIP5模式模拟评估和预估.地球物理学报,58(9):3048-3060,
10.6038/cjg20150903.
Wu J, Zhou B T, Xu Y. 2015. Response of precipitation and its extremes over China to warming: CMIP5 simulation and projection.ChineseJ.Geophys. (in Chinese),58(9):3048-3060,doi:10.6038/cjg20150903.
10.6038/cjg20150903
P461
2015-05-09,2015-07-07收修定稿
公益性行业(气象)科研专项(GYHY201306019),国家自然科学基金(41275078),气候变化专项(CCSF201329)联合资助.
吴佳,女,1984年生,副研究员,主要从事区域气候模拟及气候变化研究. E-mail: wujia@cma.gov.cn
*通讯作者 周波涛,男,1979年生,研究员,从事气候变化及古气候模拟研究. E-mail: zhoubt@cma.gov.cn

