
Experimental study of the flow structure of decelerating and accelerating flows under a gradually varying flume*
2015-02-16 06:50WANGXiekang王协康YIZijing易子靖YANXufeng闫旭峰HUANGEr黄尔LIUXingnian刘兴年
水动力学研究与进展 B辑 2015年3期
WANG Xie-kang (王协康), YI Zi-jing (易子靖), YAN Xu-feng (闫旭峰),2, HUANG Er (黄尔), LIU Xing-nian (刘兴年)
1. State Key Laboratory of Hydraulics and Mountain River Engineering, Sichuan University, Chengdu 610065, China, E-mail: wangxiekang@scu.edu.cn
2. Department of Civil and Structural Engineering, The Hong Kong Polytechnic University, Hong Kong, China
Experimental study of the flow structure of decelerating and accelerating flows under a gradually varying flume*
WANG Xie-kang (王协康)1, YI Zi-jing (易子靖)1, YAN Xu-feng (闫旭峰)1,2, HUANG Er (黄尔)1, LIU Xing-nian (刘兴年)1
1. State Key Laboratory of Hydraulics and Mountain River Engineering, Sichuan University, Chengdu 610065, China, E-mail: wangxiekang@scu.edu.cn
2. Department of Civil and Structural Engineering, The Hong Kong Polytechnic University, Hong Kong, China
(Received June 24, 2014, Revised March 25, 2015)
The turbulence characteristics of both decelerating and accelerating flows under a gradually varying flume are investigated by using a three-dimensional down-looking acoustic Doppler velocimeter (ADV). The time-averaged velocity profiles are flatened except for the central parts, and fairly fit into logarithmic laws and those in the plane circulation under the gradual expansion are more likely to be negative. The complex secondary currents are identified under the present gradual transition attributed to the combination of driving forces induced by both the boundary configuration variation and the unbalanced turbulence: a circulation on each side of the expansion and a pair of circulations on each side of the contraction. One sees an anisotropy in the turbulence intensities, the turbulence intensities increase or level out with the flow depth except those under expansion, and the Vcomponent of the turbulence intensity typically outweighs that in the streamwise direction. Apart from the above results, the respective particular distributions of the primary Reynolds shear stresses (τxyand τxz) under the gradual expansion and contraction can account for the patterns of the secondary currents in this investigation.
turbulence characteristics, secondary currents, gradual transition, non-uniform flows, open channel
Introduction
The turbulence characteristics of open-channel flows, like the flow velocity profile, the Reynolds (shear) stress and the turbulence intensities were intensively explored in past several decades, and are now largely well understood for spatial uniform flows. Those turbulent features play predominant roles in the transport of momentum, mass and energy, which are usually considered to account for the initial motion and the transport of particles. After the logarithmic law being applied for practical boundary layer flows, observations of open-channel flows[1,2]were primarily concentrated on steady uniform flows whose turbulence structure is well depicted for regular boundary and flow configurations.
In the nature, however, non-uniform open-channel flows are ubiquitous, characterized by velocity accelerations and decelerations due to either the unique topography like relatively negative and positive bed slopes or the variation of geometry of riverbanks. Thus their hydraulic phenomena (i.e., the sediment transport, the particle motion and the secondary currents) differ from those conventionally revealed within uniform open-channel flows. Hence, most previous research results for uniform open-channel flows are not well applicable to natural-channel flows featured by spatial non-uniformity, more specifically, the turbulence in uniform open-channel flows must be considered and even modified, and then applied to realistic scenarios. The significance of the non-uniformity of flows and the turbulence characteristics were widely reported. Kironoto and Graf[1]discussed in detail the turbulence characteristics of the rough non-uniformflow and discovered that these turbulence characteristics are distinctive against those of the uniform flows. Afzalimehr and Anctil[3,4], respectively, investigated the velocity profile and the shear velocity of decelerating and accelerating flows over gravel beds, confirming the validity of the logarithmic law in non-uniform flows and the variations of decelerating and accelerating bed shear stresses. Dey and Lambert[5]theoretically developed a model to predict the flow characteristics of the nonuniform unsteady open-channel flows, and good agreement was found between the predicted results and the previous laboratory measurements. Yang and Chow[6]experimentally identified a self-similarity relationship between the Reynolds shear stress and the turbulence intensities in non-uniform flows, which indicates that the non-uniformity does not affect the mixing length. Afzalimehr[7]also discovered that the inner layer of the non-uniform flows over cobbled beds took a log-low velocity profile with deviations in the outer layers. Emadzadeh et al.[8]studied the effect of accelerating and decelerating flows on the incipient motion, and it was pointed out that the critical shear stress and the shield parameter for the incipient motion in accelerating flows were considerably larger than those in decelerating ones.
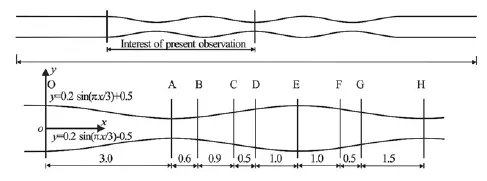
Fig.1 The gradual (lotus-shape) channel transition (m)
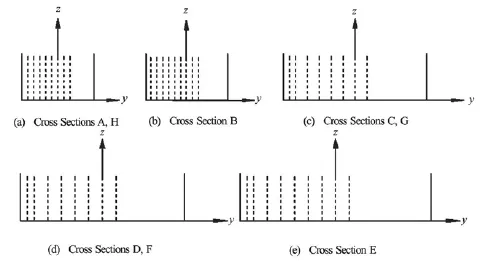
Fig.2 The measurements of particular cross sections of interest
But the above-mentioned studies concern only the unidirectional non-uniformity. Due to the non-uniformity of geological conditions, the widths of natural channels either gradually expand or gradually contract along the longitudinal direction. The variation in the channel geometric configuration leads to more complex turbulence structures in the decelerating and accelerating flows[9,10]. The stream pattern can be widely found in mountainous and gorgy areas. This geometric nature obviously produces the head loss, especially in terms of the local head[11]. Moreover, the flows under this circumstance always go from the subcritical state to the supercritical state in the gradual contraction transition, or vice versa in the gradual expansion transition[11,12], which requires particular treatments as compared with regular uniform flows[13]. This hydraulic changes may not only induce the anisotropy of the turbulence, but more importantly, may have radical effects on themselves along the transition. Therefore, the turbulence characteristics of non-uniform flows under gradual transition are a worthwhile issue to study. This paper aims to experimentally investigate the turbulence characteristics of non-uniform flows over a channel transition, which is desigined in a lotus shape for simplicity.
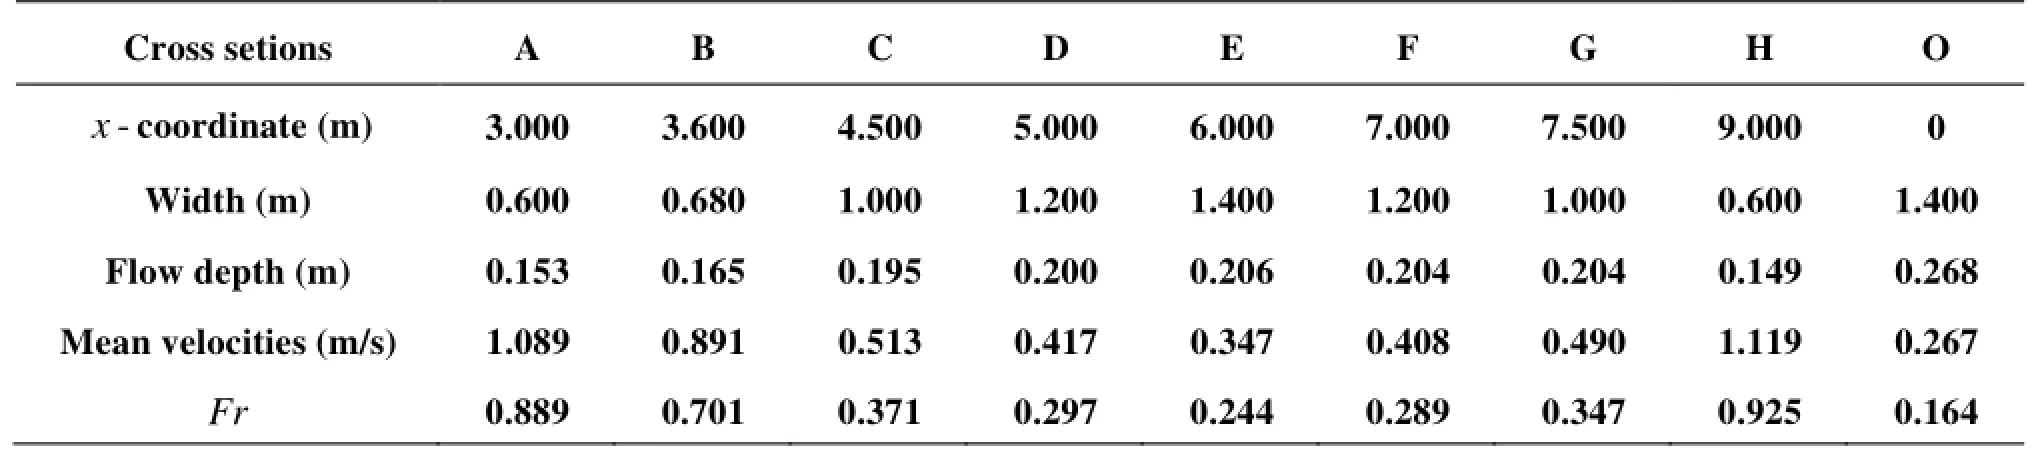
Table1 The parameters of measurements
In accordance with Papanicolaou and Hilldale’s[9]observation, the flow under gradual transitions can generate secondary currents of Prandtl’s second kind due to the turbulence anisotropy. That specific observed transition is geometrically similar to a straight channel, nevertheless, the secondary currents of the first kind frequently occur due to actions of such as the centrifugal force or the presure gradients within bends. Therefore, the kinds of the secondary currents under gradual transitions can not be clearly defined.
This paper will explore the turbulence structure and characteristics, including the velocity profiles, the secondary currents, the turbulence intensities and the Reynolds shear stresses under the gradual lotus-shape channel transition to improve our knowledge of natural flows according to experimental data.
1. Experimental setup
The experiments are conducted in a man-made gradual flume located in the State Key Laboratory of Hydraulics and Mountain River in Sichuan University, China. The water is supplied by a circulation system. The flume is 28 m in length and 0.5 m in height with cement plastered on the inside surface, whose Manning roughness coefficient is roughly 0.012 and the bed slope is 0.2%. In order to decelerate and accelerate the flow, each sidewall is horizontally moulded in the figure of “lotus shape” expressed by a trigonometric curve as,
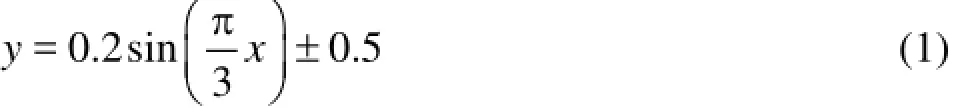
wherexandy signify the plane Cartesian coordinates in longitudinal and spanwise directions, as shown in Fig.1, with the unit of meter.
The water is driven by two pumps with discharge capacity of 100 L/s. At the beginning of the flume, a grid wall is set to make the flow uniform, in the meanwhile, a reach of 5.5 m from the upstream of the first contraction plays the same role as the grid wall. The flume comprises three lotuses, which implies that two same constant complete channel transitions occur alternately. The measured data obtained over the first transition, in this study, is used to analyse the flow characteristics within the current gradually varied channel.
As illustrated in Fig.1 and Fig.2, the measurements of the point velocity vectors are performed on 9 cross sections properly distributed in the investigated reach of the flume, to evaluate the turbulence in detail in the lotus-shape channel transition. Among them, Sections A and B are in the accelerating flow region, Sections D and E are in the decelerating flow region, and Section C is within the transitional flow region. Table 1 summerizes the fundamental hydraulic parameters of the measurement set.
Mounted on a transverse boom, the three-dimensional down-looking SonTek ADV that was employed in observations of uniform and non-uniform flows[14]is employed to measure the instantaneous velocity vectors. Based on the design principle of this instrument, the flows 0.05 m beneath the bottom of the probe can be monitored. The probe is of a volume of approximately 8×10⁻⁸m3. To assure the measurement efficiency without loss of accuracy, the sampling frequency and time are set to be 50 Hz and over 20 s, respectively, which indicates that the number of sampling points during one single measurement is greater than 1 000. The computer-monitored data are analyzed by WinADV software. As the signal-to-noise ratio (SNR) is only slightly larger than 15 dB and the correlation (COR) is greater than 70 (as suggested by SonTek), the data are valid to be used.
Measurement results are recorded to be used for the analysis of turbulence characteristics. The frictional velocity plays an essential role in the particle motion and the sediment transport, and is frequently applied to normalize other turbulence variables as a vital parameter calculated by the known velocity profile. There are several approaches available[15], two of them are reliable and usually used by pioneering studies[8,16]in non-uniform flows within the inner region: (1) the logarithmic low, (2) the Reynolds stress distribution. Both approaches are based on the least-squares fitting method. For convenience and simplicity, the latter one is chosen in this paper.
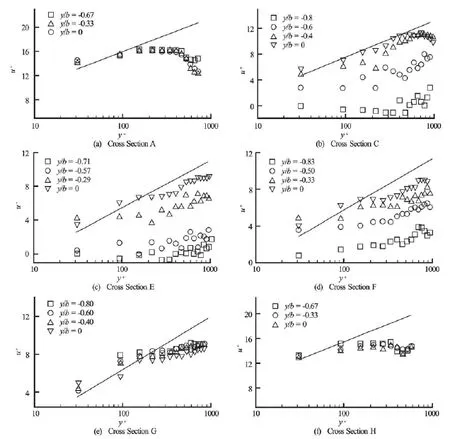
Fig.3 Time-averaged velocity profiles
2. Results and analyses
2.1 Time-averaged velocity profiles
Based on studies in Refs.[3,8,11,13,17] of the distribution of time-averaged velocity profiles (U+=U/ U*)for uniform and unidirectional non-uniform flows, the velocity profiles are fitted to a logarithmic law within the inner region(h/ z≤0.2). To investigate the turbulence characteristics, the time-averaged velocity profiles will be examined along with the theoretical logarithmic profiles. For simplicity, the frictional velocityU∗is determined as 0.068 m/s fpr the central vertical profile (y/ B=0)within cross Section O, where the flow is approximately in the uniform flow profiles, and is used as a universal parameter to normalize longitudinal velocities for all velocity profiles. It is readily seen (Fig.3) that the velocity profiles of the central verticals in the near-wall inner region conform to the logarithmic law. At the location (the cross Section A or H) where the channel width reaches its minimum at 0.60 m. no distinction is seen in the velocity profile, and this may be due to the flow pattern with relatively high Froude number, so the longitudinal velocity is less influenced by the boundary effect. More interestingly, the velocity dips are more recognizable near the bed at this location as compared with the others, which is one abnormal phenomenon not mentioned in previous observations[2,14]. However, those velocities of the verticals far away from the central ones, in particular, at cross Sections C, E and F, see a dramatic deviation from the standard theoretical solution with κ=0.142. The deviations increase with the increase of the distance of the verticals from the central ones. The variation of the channel widths tends to flatten the gradient of the velocities, indicating a decrease inκ. Th change is due tothe stream separations and the boundary effect[11,15]. The stream separations reduce the streamwise velocities, which in some regions even become negative so the backwater is likely to occur. Moreover, the extention of the stream separations along the flow depth takes various forms. It should be noted that the boundary layers within the narrowest regions (i.e., cross Sections A and H) become thinner to fit the logarithmic law.
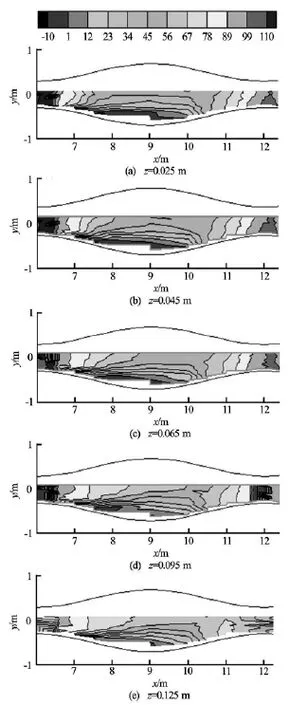
Fig.4 The contour of longitudinal velocity
2.2 The contour of the longitudinal velocity
The contours of the longitudinal velocity, as shown in Fig.4, clearly represent the variation of the longitudinal velocity at typical water depths. It is noted that the separations zones, which is represented by small or even negative values, are formed near the sidewall of the gradual expansion. With the increase of the water depth, the size of the separations actually decreases, as is consistent with the vertical velocity profiles at those regions. In other regions within the gruadual expansion, one sees a moderate variation in the longitudinal velocity as the water depth increases. With respect to the gradual contraction, however, the velocity significantly changes with the increase of the water depth. The relatively large velocity occurs at a lower water depth (z=0.45 m), while it gradually reduces as the water depth decreases. It should be noted that the profile of the velocity at the lower water depth is much wider than that at the upper water depth, which indicates the complex spatial variaiton of the flow structure within the gradually varied channel. The mass and momentum transportation within the channel transition, therefore, plays a more important in comparison with that in a straight open channel, which shows the effects of such gradually varied width of an open channel on the sediment transportation and the fluvial process.
2.3 Secondary currents
According to the plots of the secondary currents, the V- Wsecondary currents generated are compared with those observed by Papanicolaou and Hilldale[9]. They are driven both by the anisotropy of the turbulence and the external forces due to the moderately gradual variation of the boundary configuration, which tends to induce a transverse difference of the water level so that the lateral pressure gradient drives the flow to circulate as the first kind of the secondary currents. The unbalanced turbulence, however, is not likely to be related to the formation of secondary currents.
The visualization of theV- Wvelocity field in Fig.5 identically shows the existence of spanwise secondary currents along the gradual channel transition. Furthermore, with the longitudinal velocityU, the helical flow occurs along the transition, which is usually considered as a driving force for the sediment transport. The spanwise secondary currents feature various scale sizes and specific positions in terms of the absolute coordinates; with the enlargement of the channel width, the distance between the secondary currents and the central vertical is increased or the secondary currents occur nearer the sidewall, which means that the helical flow is not straight but sinuous against gradually expanded and/or contracted channel widths. This phenomenon ubiquitously happens except within cross Section B (B=0.68 m)under the expansion. The vertical velocity vectorsWrather prevail in the spanwise direction, which might, as in this study, generate hydraulic jumps as compared with those incross Section A. Therefore, the helical flow is cut off by this section within which hydraulic jump happens, so that the mass transport is hereby relieved.
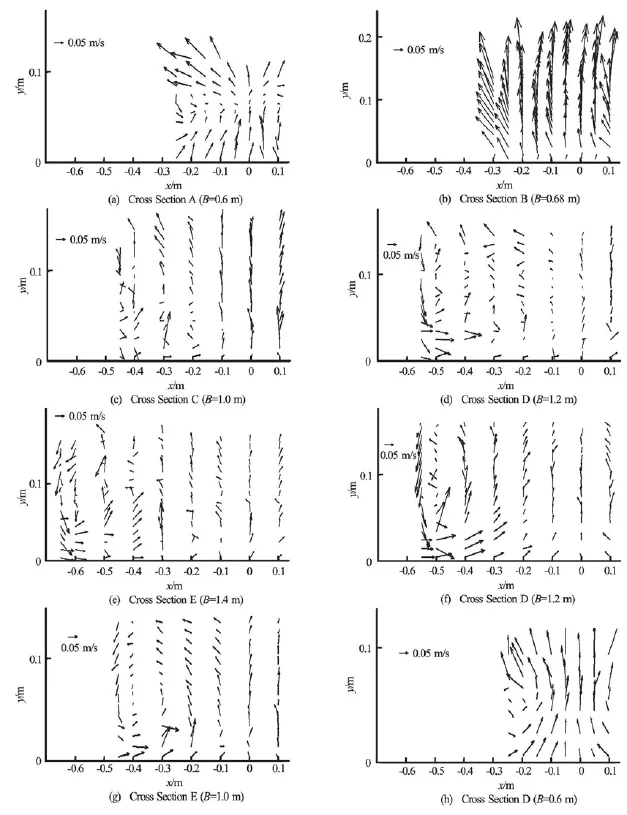
Fig.5 The performance of spanwise secondary currents along the gradual channel transition (B- cross-sectional width,yspanwise coordinate andh- flow depth)
Furthermore, after comparing the flow circulations under the gradual expansion and contraction conditions, the obvious distinction in the size of circulations can be identified. The size of the circulations within the decelerating flow is relatively larger than that within the accelerating flow. Due to the limitation of the ADV measurements, the features under the flow surface cannot be revealed. The circulations within the decelerating flow span the whole measured flow depth with theW component not reaching zero, indicating that only one circulation is formed at each side of thecross section with respect to the present observation of the decelerating flow. However, the counterparts within the accelerating flow can be seen in the observed flow, which means the presence of another counterrotating circulation above the observed region. This discovery is rather significant for understanding the energy loss, the local sediment transport and the particle motion.
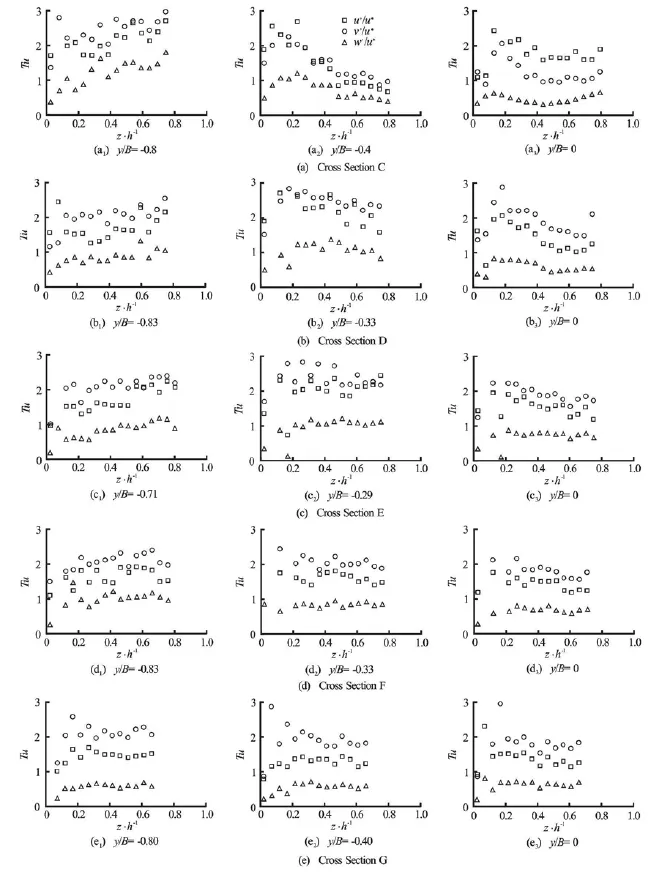
Fig.6 Turbulence intensities characterizing both accelerating and decelerating flows under lotus-shape transition
2.4 Turbulence intensities
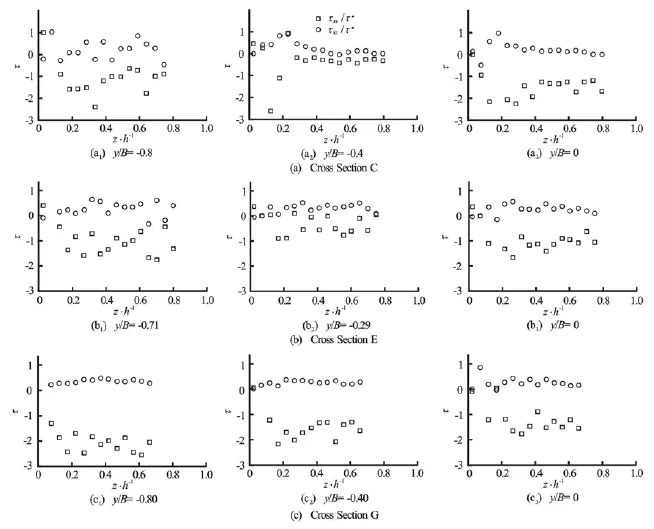
Fig.7 Reynolds shear stresses within vertical and transverse directions under typical cross sections (τxy=-uv,τxz=-uwandτ∗=U∗2)
The turbulence intensity as a statistical hydraulic parameter featuring the turbulence characteristics of the flow is very important, and the anisotropy of the turbulence intensities in all directions is the rooted cause of the secondary currents of the second kind. In the actual case, for a particular boundary configuration in the present lotus-shape gradual channel transition, it is clearly noted that the secondary currents of the first kind exist, which in turn also will affect the way the turbulence intensities distribute. Therefore, the turbulence intensities there more likely differ radically from those within the uniform flows.
Figure 6 shows the turbulence intensities (Tu)in three directions within both decelerating and accelerating flows against the flow depth. The anisotropy in the circulations is obviously recognizable, conforming to the existence of the secondary currents of the second kind. The functions describing the relationship between the flow depths and the individual turbulence intensities are established to imply that the turbulence intensities decline with the increase of the flow depths in the outer region[15,18]after reaching the peak in the inner region, and this demonstration is supported by[3,12], in a fractionally good agreement with the demonstrations of cross Sections C (y/ B =-0.4 and 0) and D (y/ B=-0.33 and 0), where the observation is within the decelerating flow. Hence, the turbulence intensities are positively related to or level out with the flow depth. Additionally, it is clearly noted that theVcomponent of the turbulence intensity is the largest, followed by theU component and then the Wcomponent. This scenario is fairly different from descriptions in previous studies, which states that the magnitude of the turbulence intensity in the streamwise direction prevails as compared to the transverse one with the formation of flow circulations[1,15,16]. The above observations are believed to indicate that the secondary currents generated under the present lotusshape gradual transition have significant effects on the turbulence intensities.
2.5 Reynolds shear stress
Likewise, the anisotropic Reynolds shear stresses, in particular, the components in vertical and transverse directions, can be used to explain the different kinds of the secondary currents[15,16]. To reveal the individual turbulent features of the current non-uniform flow, the primary Reynolds shear stresses()τunder typical cross sections responsible for the production of the flow circulation are shown for the comparison (Fig.7). Clearly from the illustrations, within the decelerating flow for each verticals (cross Sections C and E), except for the central verticals, the difference between τxyand τxzis small. However, this result cannot be applicable for cross Section G under which the flow is developed to be accelerating. The apparent difference supplying the external force is understood to be able to drive the flow to circulate. This demonstration is consistent with the presence of the secondary currents within the gradual expansion due to the variation of geometric configurations, while within the gradual contraction, they are both induced by the boundary conditions and the anisotropic turbulence. This turns out to be the most supportive evidence for one pair of flow circulations occurring in the decelerating flow and two pairs in the accelerating under the lotus-shape gradual transition. The former belongs to the first kind while the latter is the combination pattern of the first kind and the second kind. The distribution of the two-component Reynolds shear stresses along the central verticals is somehow identical indicating that the turbulence along the axial line of the gradual transition is minimally affected by the secondary currents. It should be noted that the Reynold shear stressτxzmostly remains negative. However, this is reasonable, since the negative τxzindicates that the turbulent momentum is tranfered from the main flow around the middle of the expansion towards the wall side. This transfer also implies the dispersion circulation.
3. Conclusions
The paper focuses on the turbulence characteristics and the flow structures under a lotus-shape gradual channel transition involved in both decelerating and accelerating flows that are not the traditional unidirectional ones but varying three-dimensional ones.
The time-averaged velocities along various verticals of different cross sections are investigated and the central ones are shown to be basically consistent with the classic logarithmic law. The distribution of those along verticals far away from the central ones, however, deviates from the standard theoretical solution, and the trend of the deviation is more similar with the increase of the distance between the particular vertical and the central one, which tends to reduce the value of the Karman constantκ. Particularly, with respect to the cross section (Section C) the vertical profile near the sidewall oscillates dramatically, with values fairly small even negative. This abnormal phenomenon is due to the fact that the plane circulation occurs owing to the flow dispersing through the gradual expansion. The separation is manifested by the contour of the lateral velocity at the water depths.
From the visualization, the complex combination of the secondary currents is identified. Only one flow circulation occurs at one side of cross sections under the gradual expansion, while a pair of flow circulations is more likely to appear under the gradual contraction. The explanation of the generation mechanism of the present secondary currents is complicated, since the driving force induced by the gradually-varied boundary configuration is coupled with another one characterized by the anisotropy of the turbulence.
The observation also reveals that the turbulence intensities are positively related to or level out with the flow depth. Furthermore, it is shown in this study that theV component of the turbulence intensity typically outweighs that in the streamwise direction, differing from the observations in previous studies. The primary Reynolds shear stresses (τxyand τxz) of the accelerating flow under the gradual contraction are dramatically more unbalanced than those under the gradual expansion, which can account for the pattern of secondary currents under a complete lotus-shape gradual transition.
Acknowledgement
This work was supported by the Open Foundation of State Key Laboratory of Hydraulics and Mountain River Engineering, Sichuan University (Grant No. SKHL1418).
[1] KIRONOTO B. A., GRAF W. H. Turbulence characteristics in rough non-uniform open-channel flow[J]. Proceedings of the Institution of Civil Engineers-Water Marit Energy, 1995, 112 (4): 336-348.
[2] SONG T., CHIEW Y. M. Turbulence measurement in nonuniform open-channel flow using acoustic Doppler velocimeter (ADV)[J]. Journal of Engineering Mechanics, 2001, 127(3): 219-231.
[3] AFZALIMEHR H., ANCTIL F. O. Velocity distribution and shear velocity behavior of decelerating flows over a gravel bed[J]. Canadian Journal of Civil Engineering, 1999, 26(4): 468-475.
[4] AFZALIMEHR H., ANCTIL F. O. Accelerating shear velocity in gravel-bed channels[J]. Hydrological Sciences Journal-Des Sciences Hydrologiques, 2000, 45(1): 113-124.
[5] DEY S., LAMBERT M. F. Reynolds stress and bed shear in nonuniform unsteady open-channel flow[J]. Journal of Hydraulic Engineering, ASCE, 2005, 131(7): 610-614.
[6] YANG S., CHOW A. T. Turbulence structures in nonuniform flows[J]. Advances in Water Resources, 2008, 31(10): 1344-1351.
[7] AFZALIMEHR H. Effect of non-uniformity of flow on velocity and turbulence intensities over a cobble-bed[J]. Hydrological Pprocesses, 2010, 24(3): 331-341.
[8] EMADZADEH A., CHIEW Y. M. and AFZALIMEHR H. Effect of accelerating and decelerating flows on incipient motion in sand bed streams[J]. Advances in Water Resources, 2010, 33(9): 1094-1104.
[9] PAPANICOLAOU A. N., HILLDALE R. Turbulence characteristics in gradual channel transition[J]. Journal of Engineering Mechanics, 2002, 128(9): 949- 960.
[10] HOAN N. T., BOOIJ R. and STIVE M. J. F. et al. Decelerating open-channel flow in a gradual expension[C]. Asian and Pacific Coasts Conference. Nanjing, China 2007, 902-915.
[11] ALAUDDIN M., BASAK B. C. Development of an expansion transition in open channel sub critical flow[J]. Journal of the Civil Engineering Division, 2006, 34(2): 91-101.
[12] LADOPOULOS E. G. Singular integral equations in potential flows of open-channel transitions[J]. Computers and Fluids, 2010, 39(9): 1451-1455.
[13] RAHMAN M., CHAUDHRY M. H. Computation of flow in open-channel transitions[J]. Journal of Hydraulic Research, 1997, 35(2): 243-256.
[14] SCHULTZ M. P., FLACK K. A. Outer layer similarity in fully rough turbulent boundary layers[J]. Experiments in Fluids, 2005, 38(3): 328-340.
[15] MANES C., POGGI D. and RIDOLFI L. Turbulent boundary layers over permeable walls: scaling and nearwall structure[J]. Journal of Fluid Mechanics, 2011, 687: 141-170.
[16] NEZU I., NAKAGAWA H. Turbulence in open channel flows[M]. Rotterdam, The Netherlands: A. A. Balkema, 1993.
[17] BALACHANDAR R., HAGEL K. and BLAKELY D. Velocity distribution in decelerating flow over rough surfaces[J]. Canadian Journal of Civil Engineering, 2002, 29(2): 211-221.
[18] WANG X., YANG Q. and LU W. et al. Experimental study of near-wall turbulent characteristics in an openchannel with gravel bed using an acoustic Doppler velocimeter[J]. Experiments in Fluids, 2011, 52(1): 85-94.
* Project supported by the National Natural Science Foundation of China (Grant No. 41171016), the Sichuan Province Science and Technology Support Program (Grant No. 2014SZ0163).
Biography: WANG Xie-kang (1970-), Male, Ph. D., Professor

- 水动力学研究与进展 B辑的其它文章
- Stability of a tumblehome hull under the dead ship condition*
- The impact of macroalgae on mean and turbulent flow fields*
- Numerical study of the performance of multistage Scaba 6SRGT impellers for the agitation of yield stress fluids in cylindrical tanks*
- Multi-scale Runge-Kutta_Galerkin method for solving one-dimensional KdV and Burgers equations*
- Ski jump trajectory with consideration of air resistance*
- United friction resistance in open channel flows*