
A LCA Based Biofuel Supply Chain Analysis Framework*
2014-07-18 12:09LIUZhexuan刘喆轩QIUTong邱彤andCHENBingzhen陈丙珍DepartmentofChemicalEngineeringTsinghuaUniversityBeijing100084China
LIU Zhexuan (刘喆轩), QIU Tong (邱彤) and CHEN Bingzhen (陈丙珍)**Department of Chemical Engineering, Tsinghua University, Beijing 100084, China
A LCA Based Biofuel Supply Chain Analysis Framework*
LIU Zhexuan (刘喆轩), QIU Tong (邱彤) and CHEN Bingzhen (陈丙珍)**
Department of Chemical Engineering, Tsinghua University, Beijing 100084, China
This paper presents a life cycle assessment (LCA) based biofuel supply chain (SC) analysis framework which enables the study of economic, energy and environmental (3E) performances by using multi-objective optimization. The economic objective is measured by the total annual profit, the energy objective is measured by the average fossil energy (FE) inputs per MJ biofuel and the environmental objective is measured by greenhouse gas (GHG) emissions per MJ biofuel. A multi-objective linear fractional programming (MOLFP) model with multi-conversion pathways is formulated based on the framework and is solved by using the ε-constraint method. The MOLFP problem is turned into a mixed integer linear programming (MILP) problem by setting up the total annual profit as the optimization objective and the average FE inputs per MJ biofuel and GHG emissions per MJ biofuel as constraints. In the case study, this model is used to design an experimental biofuel supply chain in China. A set of the weekly Pareto optimal solutions is obtained. Each non-inferior solution indicates the optimal locations and the amount of biomass produced, locations and capacities of conversion factories, locations and amount of biofuel being supplied in final markets and the flow of mass through the supply chain network (SCN). As the model reveals trade-offs among 3E criteria, we think the framework can be a good support tool of decision for the design of biofuel SC.
biofuel, life cycle assessment, supply chain, optimization
1 INTRODUCTION
Diminishing fossil fuel resources and increasing concern about greenhouse effect worldwide urge the development of biofuels [1]. Expecting the use of biofuels may reduce the GHG emissions and FE consumptions, many countries have adopted policies to promote the development of biofuels. In 2009, the new European Union Directive set aims at reaching a 10% share of renewable energy by 2020. Also, GHG emissions should be greatly reduced according to this directive. China plans to focus on biofuels converted from energy crops and cooking oil to ensure the food security according to the Renewable Energy Law passed in 2005. Standards have also been established on the fuel mixture of 10% ethanol and 90% gasoline (E10) and the fuel mixture of 10% biodiesel and 90% diesel (D10). Many provinces in China have replaced fossil gasoline for E10 under the requirement of National Development and Reform Commission.
There are abundant resources of biomass in China. The amount of crop residue that can be used for biofuel production is 300 million tons and China also has 7 million ha of potential land for planting energy crops (sweet sorghum, cassava, etc.) [2]. While the Middle and Long Term Development Plan of Renewable Energy requires that the annual bioethanol and biodiesel production should reach a minimum of 10 million and 2 million tons by 2020, respectively. The production of them is 1.9 million tons and 0.31 million tons in 2008, respectively [3]. Because of the limited availability of biomass in certain seasons, loss in biomass storage, economic problems and the concern whether biofuel can ease the problem of globe warming, most factories produce much less than the maximum capacity [4].
LCA is a method to study the impact in the life cycle of a product. It has become an important decision making tool for biofuel because it is very important to study the 3E performance before building factories for a certain biofuel pathway. Many studies have been carried out on biofuels in China [5-13]. Most of them focus on a unique single pathway and have not compared it to other pathways [6-9, 11-13]. The results of these studies are significantly different from each other even for the same biofuel pathway [6, 7, 11-13]. The conclusions of these studies are geographically dependent or national averaged. Thus, they cannot describe the situation of the biofuel industry in China accurately.
To solve these problems, it is necessary to integrate LCA with SC modeling by using geographically dependent LCA results in the model. SC modeling is often used for minimizing cost or maximize profit. Most early studies on biofuel SC use economic objective [14-18] thus ignoring the environmental aspects. Using multi-objective model and LCA to study both the economic and environmental impact in biofuel SC are now attracting the interest of researchers. But to the best of our knowledge, no such study has been done in China. Zamboni et al. [18] carried out an MILP model to minimize the overall operating cost for bioethanol SC in Northern Italy. Later they extended their model to a multi-objective one by using GHG emissions as another objective [19]. Another multi-objective MILP model for biomass-to-liquid SC was formulated and tested on the state of Iowa by You et al [20]. Other evaluation criteria are also reported, such as footprint [21], IMPACT 2002+ [22], Eco-indicator 99 [23], etc. Researchers have also paid much attention to the differencebetween centralized and distributed systems [16, 20].
In this paper an LCA based biofuel SC analysis framework is proposed, under which a single-period multi-objective model is formulated. In this framework, a method to integrate LCA with biofuel SC is provided. More complicated SC model can be built (ones that considering multi-period, uncertainty, carbon trading etc.) by adding other supply chain constraints to the basic framework. The study of trade-offs between the 3E goals is enabled in our framework. We also use this model to investigate the difference between the distributed and the centralized systems. In a distributed system, biofuel is firstly transported to pretreatment factories and converted to an intermediate product. The intermediate product is then converted to biofuel in biofuel production factories. In a centralized system, biomass is directly converted to biofuel in integrated factories. The model is solved by using ε-constraint method [24] to see how the FE inputs and GHG emissions limits influence the total economic profit and SCN.
2 PROBLEM STATEMENT
In our problem, a set of biofuel pathways for producing bioethanol and biodiesel are involved. It is necessary assess the 3E performances of the whole SC. LCA is used for calculating the energy and environment performances.
The SCN superstructure like the one in Fig. 1 is shown, in which potential locations of biomass feedstock, pretreatment factories, integrated factories, biofuel production factories and markets are included. Biomass can be firstly transported from biomass feedstock to pretreatment factories to be converted to some high energy density form and then converted to biofuel in biofuel production factories. Also, biomass can be directly converted to biofuel in integrated factories. After being blended with fossil gasoline and diesel, biofuels (E10 and D10) are consumed in markets.
The input parameters for this problems are:
(1) Maximum amount of biomass that can be provided in each biomass feedstock locations;
(2) Maximum and minimum capacities, fixed costs, variable costs of pretreatment factories, biofuel production factories and integrated factories;
(3) Maximum and minimum demand for E10 and D10;
(4) Distance between nodes in the biofuel SC;
(5) Transportation cost per ton-km;
(6) LCA results.
The objectives are minimizing average FE inputs and GHG emissions per MJ biofuel while maximizing total annual profit by making following decisions:
(1) Output of each kind of biomass in biomass feedstock locations;
(2) Sizes, technologies, locations of pretreatment factories, biofuel production factories and integrated factories;
(3) Locations of markets;
(4) Amount of substance being transported between the nodes in the biofuel SC.
3 LCA BASED SC ANALYSIS FRAMEWORK
In our LCA based SC analysis framework, the LCA results are used as inputs for objective functions in the model as the information flows as shown in Fig. 2.
Well-to-wheels (WTW) analysis is used for all biofuel pathways. WTW analysis includes two stages in biofuel life cycle, well-to-pump (WTP) and pump-towheel (PTW). WTP studies all the upstream stages including: biomass cultivation, biomass transportation, fuel production and intermediate product transportation (if any). Fuel production, distribution and consumption are studied in PTW analysis. WTW analysis is used because the biofuel SC to be studied includes both the upstream and downstream of biofuel.
To integrate LCA result with SC modeling, it is necessary divide the life cycle of biofuel according to the stage division of SC. In SC modeling, the FE inputs and GHG emissions of the whole SC can be divided into four parts: biomass production, fuel production, fuel consumption and transportation. The sum of influences led by biomass cultivation and biomass collection is used as the data inputs for the biomass production part. Though E10 or D10 may behave differently when combusted in engines, it can be still assumed that the influence in the fuel consumption stage can be offset by the carbon sink in biomass cultivation without losing much in accuracy. Thus, both parts can be ignored in LCA. All kinds of transportation (biomass, intermediate product and biofuel) are included in the transportation part.

Figure 1 The structure of biofuel supply chain in this paper
Based on the process data, how much basic fuel (gasoline, diesel, natural gas, electricity, etc.) is usedduring the life cycle of the other raw materials (fertilizer, methanol etc.) used in the SC can be analyzed. By multiplying the FE inputs and GHG emissions data by the amount of basic fuel used, the FE inputs and GHG emissions of all the other raw materials can be known.

Figure 2 LCA based SC analysis framework

Where Fiis the FE inputs for the other raw material i; Fχis the FE inputs for the basic fuel χ and Aχ,iis the amount of basic fuel χ used when producing other raw material i. Eq. (2) calculates the GHG emissions (Gi) in a similar way.
The LCA result of biofuel can be calculated in the same way. For each stage, EF inputs Fsand GHG emissions Gscan be given by multiplying the FE inputs and GHG emissions of all the raw materials (Fχ, Fi, Gχ, Gi) by the amount of raw materials used in that stage (Aχ,s, Ai,s).

4 MODEL FORMULATION
4.1 LCA model
Here we adopt the results of Tsinghua-CA3EM model. Tsinghua-CA3EM model [5] is a model for automotive fuel based on the GREET model (http://greet.es.anl.gov/) and the national conditions for China such as the over use of fertilizer in biomass cultivation and the dominance of coal utilization. Firstly, FE inputs and GHG emissions are calculated for all the basic fuels. When calculating GHG emissions, all the GHG is converted to their CO2equivalents according to their global warming potential (GWP) value under the guidance of Intergovernmental Panel on Climate Change (IPCC).
4.2 Supply chain model
To formulate a supply chain model, some subscripts, decision variables and input variables are needed. The detailed information about these subscripts and variables can be found in the nomenclature.
4.2.1 Constraints
The sum of the flow from biomass feedstock locations to biomass factories must not exceed the maximum

5 CASE STUDY
Because of the lack of detailed statistical data for China, the framework and our model are used to design an experimental biofuel SC in which only biodiesel (BD) pathway is considered.
The nation is divided into provinces, and we choose 19 provinces to be potential biomass feedstock locations, 14 capital cities to be potential locations for factories, and 18 capital cities to be potential markets. The highway distance is used as the distance between nodes. Since the distribution of biomass is dispersed, 100 km between biomass feedstock locations and factories is added as a collecting range. Also, it is assumed that all the transportation is done by diesel trucks. Only 1% of the total amount of rapeseed [27] in eachprovince is used for the production of biodiesel and 10% of potential land [28] for energy crop can be used for the plantation of jatropha fruit [29].
Unit emissions, FE inputs and costs will decrease while the fixed cost increases nonlinearly.
The difference led by the choice between centralized and distributed systems can be investigated. In a centralized system, integrated factories have greater capacity than biofuel production factories. Thus, the SC may benefit more from the scale effect. The distributed system may reduce the cost of transporting biomass, which is in a low energy density form by converting biomass to preliminarily processed oil in pretreatment factories.
The maximum demand in the final market is estimated by the number of trucks and cars in each province and the assumption that each truck or car will consume 1.5 t of gasoline or diesel. The minimum demand is set to be 60% of the maximum demand. The price of each product is set to be the price in the Chinese market in 2012.
All the input variables are listed in Table 1-8 in the Appendix [4, 9, 30, 31].
To solve the problem, the value of ε1and ε2is set large enough to guarantee that the constraints Eqs. (38) and (39) are redundant. By doing this, the actual values of ε1and ε2can be obtained, and used to be the upper bounds. The lower bounds are obtained by letting the other constrain be redundant and gradually tightening the constraint. The search stops when the model becomes infeasible and the current value of ε1or ε2is set to be its lower bound.
6 RESULT AND DISCUSSION
Because constraints Eqs. (38) and (39) do not require the actual values equal to ε1and ε2, it is necessary to calculate the actual value of the objectives after solving the problem. The distribution of Pareto-optimal solutions is not widely distributed because there is only one biofuel pathway in the case. But it can be still seen in Fig. 3 that the optimal solutions are on a convex surface.
One representative point (Point A) in Fig. 3 is chosen for a detailed analysis. Fig. 4 (a), (b) and (c) show the allocation of GHG emissions, FE inputs and costs for each stage of BD pathway, respectively. Due to the difficulty of biomass planting and the molecular similarity between the preliminarily processed oil obtained from the energy crop and the biodiesel, biomass planting accounts for the largest proportion.
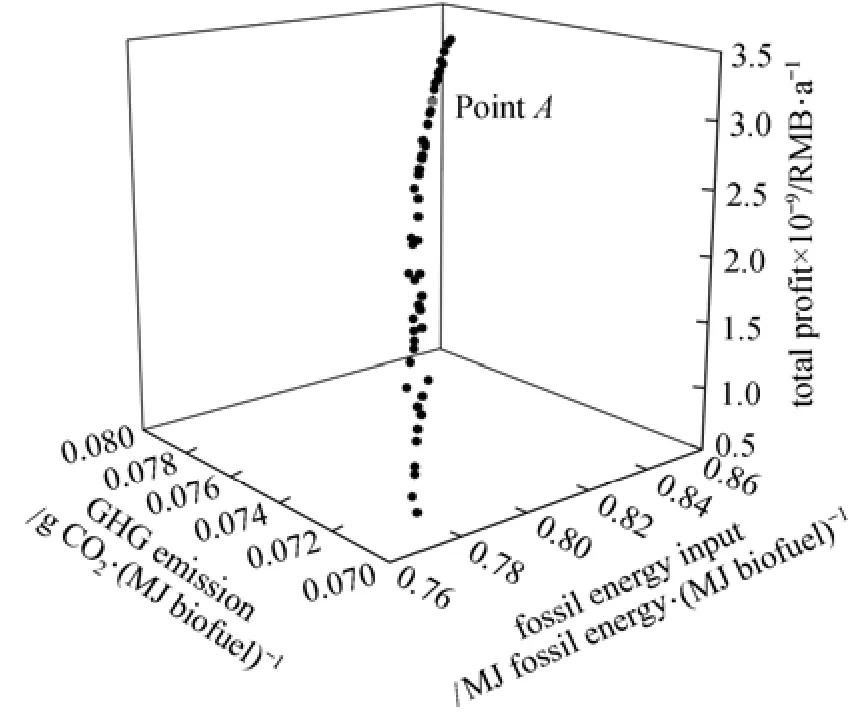
Figure 3 Pareto-optimal solutions (Point A indicates a SCN that makes a profit of 2.937×10⁹CNY·a−1while needs 0.83 MJ fossil energy and emits 0.0769 g CO2for every MJ biofuel)
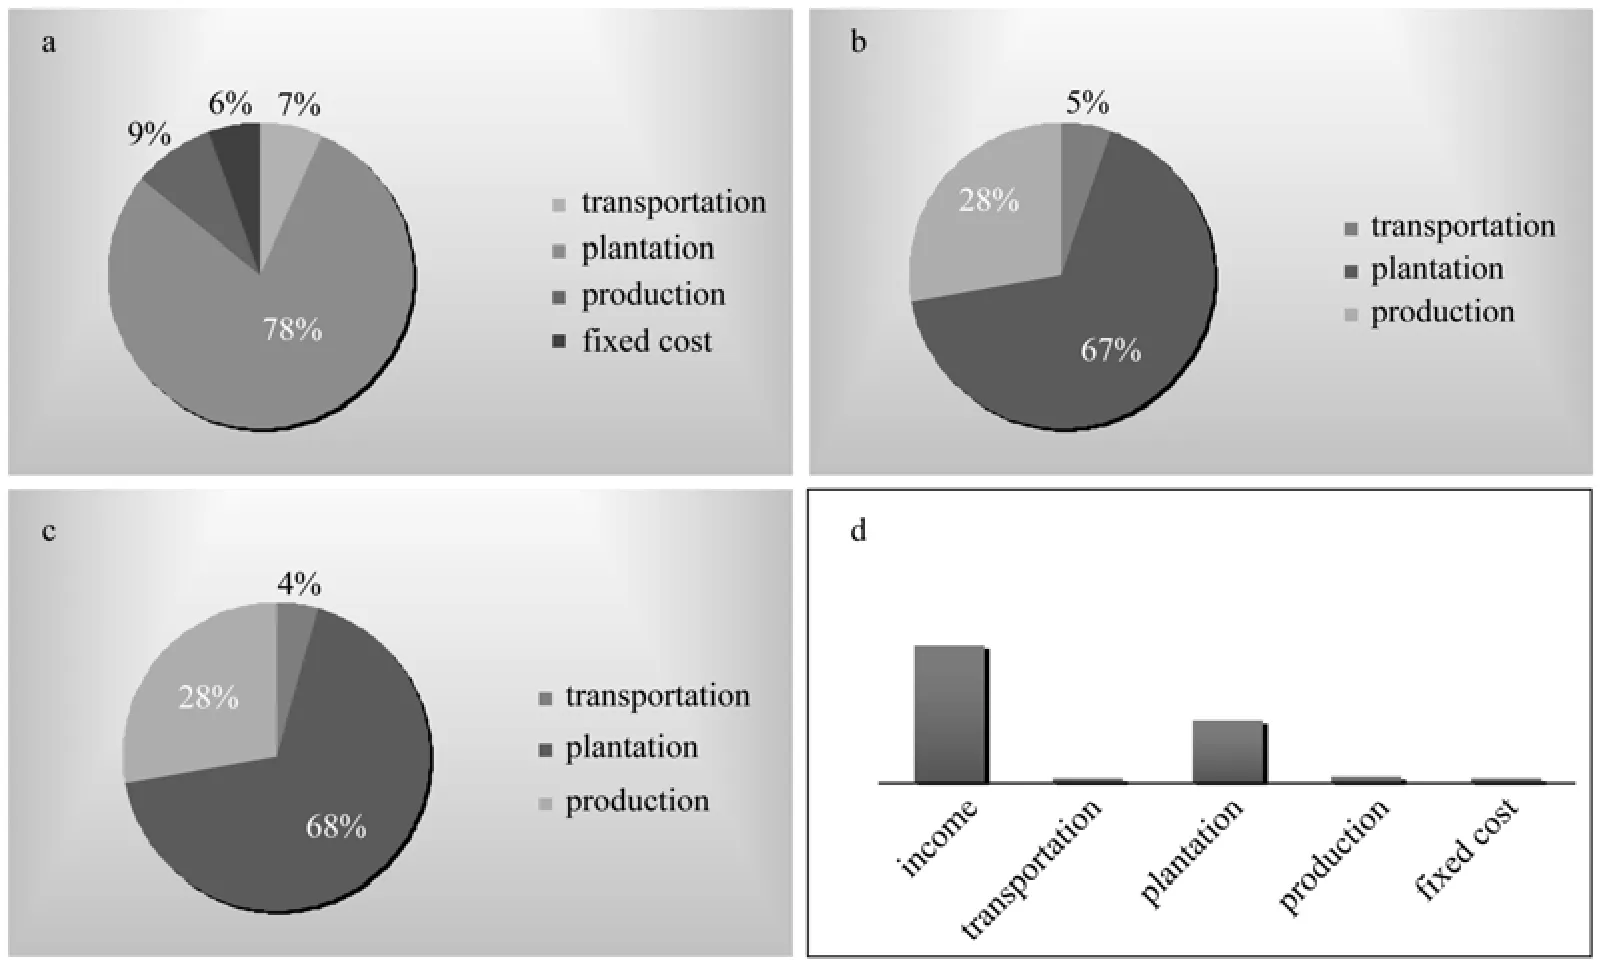
Figure 4 Breakdown analysis for the BD pathway

Figure 5 Flow network for the centralized BD pathway for the solution at Point A
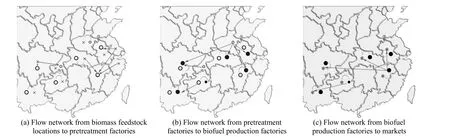
Figure 6 Flow network for the distributed BD pathway for the solution at Point A
Figure 4 (d) shows the comparison between the income and costs. As the estimated cost from literature is very ideal, income excess costs greatly.
A further check of Pareto-optimal solutions reveals that all the Pareto-optimal solutions adopt the centralized system. The production term in the BD pathway is fairly large, so the scale effect of using conversion factory with greater capacity is more preferable to the lower transportation costs of the distributed system. If a distributed system at point A in the model is chosen in the BD pathway, the total profit decreases from 2.937×10⁹CNY·a−1to 1.782×10⁹CNY·a−1, and the network structure differs significantly in the two systems.
Figures 5 and 6 show the flow network of the centralized and the distributed systems, respectively. From these two figures, it can be concluded that in the distributed system, biomass is more likely to be converted locally and then be transported to further factories for biofuel production.
7 CONCLUSIONS
In this study, an LCA based biofuel SC analysis framework is proposed. The 3E performance can be analyzed by adding LCA objectives to ordinary SC model under this framework. A static biofuel SC model with multi-conversion pathways is formulated as a MOLFP problem and is solved by using the ε-constraint method. In the case study, this model is used to design an experimental bio-fuel supply chain in China. Two biomass types and one pathway are considered. A set of the Pareto-optimal solutions is obtained. The choice between distributed systems and centralized systems is also taken into account. The result shows that the plantation of the biomass accounts for the biggest part of the cost, FE inputs and GHG emissions. Furthermore, the centralized system performs better than the distributed system because of the great scale effect.
It should be mentioned that though the model proposed is experimental because of the limited data, the model can be greatly extended under the guidance of our framework by using the follows.
(1) Using updated basic LCA data;
(2) Analyzing the combustion behavior of biofuels in detail;
(3) Adding other criteria such as IMPACT 2002+, Eco-indicator 99, etc.;
(4) Using multi-period SC model;
(5) Considering uncertainties in product pricing, demand change, and technology improvement.
NOMENCLATURE

REFERENCES
1 Bond, J.Q., Alonso, D.M., Wang, D., West, R., Dumesic, J.A., “Integrated catalytic conversion of γ-valerolactone to liquid alkenes for transportation fuels”, Science, 327 (5969), 1110-1114 (2010).
2 Yan, L., Zhang, L., Wang, S., Hu, L., “Potential yields of bio-ethanol from energy crops and their regional distribution in China.”, Transactions of the Chinese Society of Agricultural Engineering, 24 (5), 213-216 (2008). (in Chinese)
3 Qiu, H., Sun, L., Huang, J., Rozelle, S., “Liquid biofuels in China: Current status, government policies, and future opportunities and challenges”, Renewable and Sustainable Energy Reviews, 16 (5), 3095-3104 (2012).
4 Zhang, P., Yang, Y., Tian, Y., Yang, X., Zhang, Y., Wang, L., “Bioenergy industries development in China: Dilemma and solution”, Renewable and Sustainable Energy Reviews, 13 (9), 2571-2579 (2009).
5 Ou, X., Zhang, X., Chang, S., Guo, Q., “Energy consumption and GHG emissions of six biofuel pathways by LCA in (the) People’s Republic of China”, Applied Energy, 86, Supplement 1, S197-S208 (2009).
6 Chen, H., Chen, G.Q., “Energy cost of rapeseed-based biodiesel as alternative energy in China”, Renewable Energy, 36 (5), 1374-1378 (2011).
7 Hou, J., Zhang, P., Yuan, X., Zheng, Y., “Life cycle assessment of biodiesel from soybean, jatropha and microalgae in China conditions”, Renewable and Sustainable Energy Reviews, 15 (9), 5081-5091 (2011).
8 Shirvani, T., Yan, X., Inderwildi, O.R., Edwards, P.P., King, D.A.,“Life cycle energy and greenhouse gas analysis for algae-derived biodiesel”, Energy & Environmental Science, 4 (10), 3773-3778 (2011).
9 Hu, Z., Tan, P., Yan, X., Lou, D., “Life cycle energy, environment and economic assessment of soybean-based biodiesel as an alternative automotive fuel in China”, Energy, 33 (11), 1654-1658 (2008). 10 Ou, X., Yan, X., Zhang, X., Liu, Z., “Life-cycle analysis on energy consumption and GHG emission intensities of alternative vehicle fuels in China”, Applied Energy, 90 (1), 218-224 (2012).
11 Wang, Z., Calderon, M.M., Lu, Y., “Life cycle assessment of the economic, environmental and energy performance of Jatropha curcas L. Biodiesel in China”, Biomass and Bioenergy, 35 (7), 2893-2902 (2011).
12 Guo, R., Hanaki, K., “Potential and life cycle assessment of biodiesel production in China”, Journal of Renewable and Sustainable Energy, 2, 033107-1-033107-15 (2010).
13 Liang, S., Xu, M., Zhang, T., “Life cycle assessment of biodiesel production in China”, Bioresource Technology, 129, 72-77 (2013).
14 Giarola, S., Shah, N., Bezzo, F., “A comprehensive approach to the design of ethanol supply chains including carbon trading effects”, Bioresource Technology, 107, 175-185 (2012).
15 Akgul, O., Shah, N., Papageorgiou, L.G., “An optimisation framework for a hybrid first/second generation bioethanol supply chain”, Computers & Chemical Engineering, 42, 101-114 (2012).
16 Kim, J., Realff, M.J., Lee, J.H., Whittaker, C., Furtner, L., “Design of biomass processing network for biofuel production using an MILP model”, Biomass and Bioenergy, 35 (2), 853-871 (2011).
17 Papapostolou, C., Kondili, E., Kaldellis, J.K., “Development and implementation of an optimisation model for biofuels supply chain”, Energy, 36 (10), 6019-6026 (2011).
18 Zamboni, A., Shah, N., Bezzo, F., “Spatially explicit static model for the strategic design of future bioethanol production systems. 1. Cost minimization”, Energy & Fuels, 23 (10), 5121-5133 (2009).
19 Zamboni, A., Bezzo, F., Shah, N., “Spatially explicit static model for the strategic design of future bioethanol production systems. 2. Multi-objective environmental optimization”, Energy & Fuels, 23 (10), 5134-5143 (2009).
20 You, F., Wang, B., “Life cycle optimization of biomass-to-liquid supply chains with distributed—Centralized processing networks”, Industrial & Engineering Chemistry Research, 50 (17), 10102-10127 (2011).
21 Čuček, L., Varbanov, P.S., Klemeš, J.J., Kravanja, Z., “Total footprints-based multi-criteria optimisation of regional biomass energy supply chains”, Energy, 44 (1), 135-145 (2012).
22 Bojarski, A.D., Laínez, J.M., Espuña, A., Puigjaner, L., “Incorporating environmental impacts and regulations in a holistic supply chains modeling: An LCA approach”, Computers & Chemical Engineering, 33 (10), 1747-1759 (2009).
23 Kostin, A., Guillén-Gosálbez, G., Mele, F.D., Jim, E.N.L., “Identifying key life cycle assessment metrics in the multiobjective design of bioethanol supply chains using a rigorous mixed-integer linear programming approach”, Industrial & Engineering Chemistry Research, 51 (14), 5282-5291 (2012).
24 Mavrotas, G., “Effective implementation of the ε-constraint method in multi-objective mathematical programming problems”, Applied Mathematics and Computation, 213 (2), 455-465 (2009).
25 Konno, H., Yamashita, H., “Minimizing sums and products of linear fractional functions over a polytope”, Naval Research Logistics (NRL), 46 (5), 583-596 (1999).
26 Metev, B., Gueorguieva, D., “A simple method for obtaining weakly efficient points in multiobjective linear fractional programming problems”, European Journal of Operational Research, 126 (2), 386-390 (2000).
27 Liu, C.M., “Study on Rape Production and Development of Biodiesel in China”, Ph. D. Thesis, Huazhong Agricultural University (2008). (in Chinese)
28 Xu, Z., Cheng, S., Xie, G., “The suitable land for sweet sorghum and its potential for ehtanol production in China”, Renewable Energy Resources, 28 (4), 118-122 (2010).
29 Wu, Q., “Energy Utilization Actuality and Potential Evaluation of Jatropha curcas L. in China”, Master Thesis, Beijing Forestry University, (2009). (in Chinese)
30 National Bureau of Statistics of the People’s Republic of China, China statistical yearbook 2010, China Statistics Press, Beijing (2011) (in Chinese)
31 Xing, A., Ma, J., Zhang, Y., Wang, Y., Jin, Y., “Life cycle assessment of economy for biodiesel”, Journal of Tsinghua University Science and Technology, 50 (6), 923-927 (2010). (in Chinese)
APPENDIX

Table A1 Distance between provinces (km)*
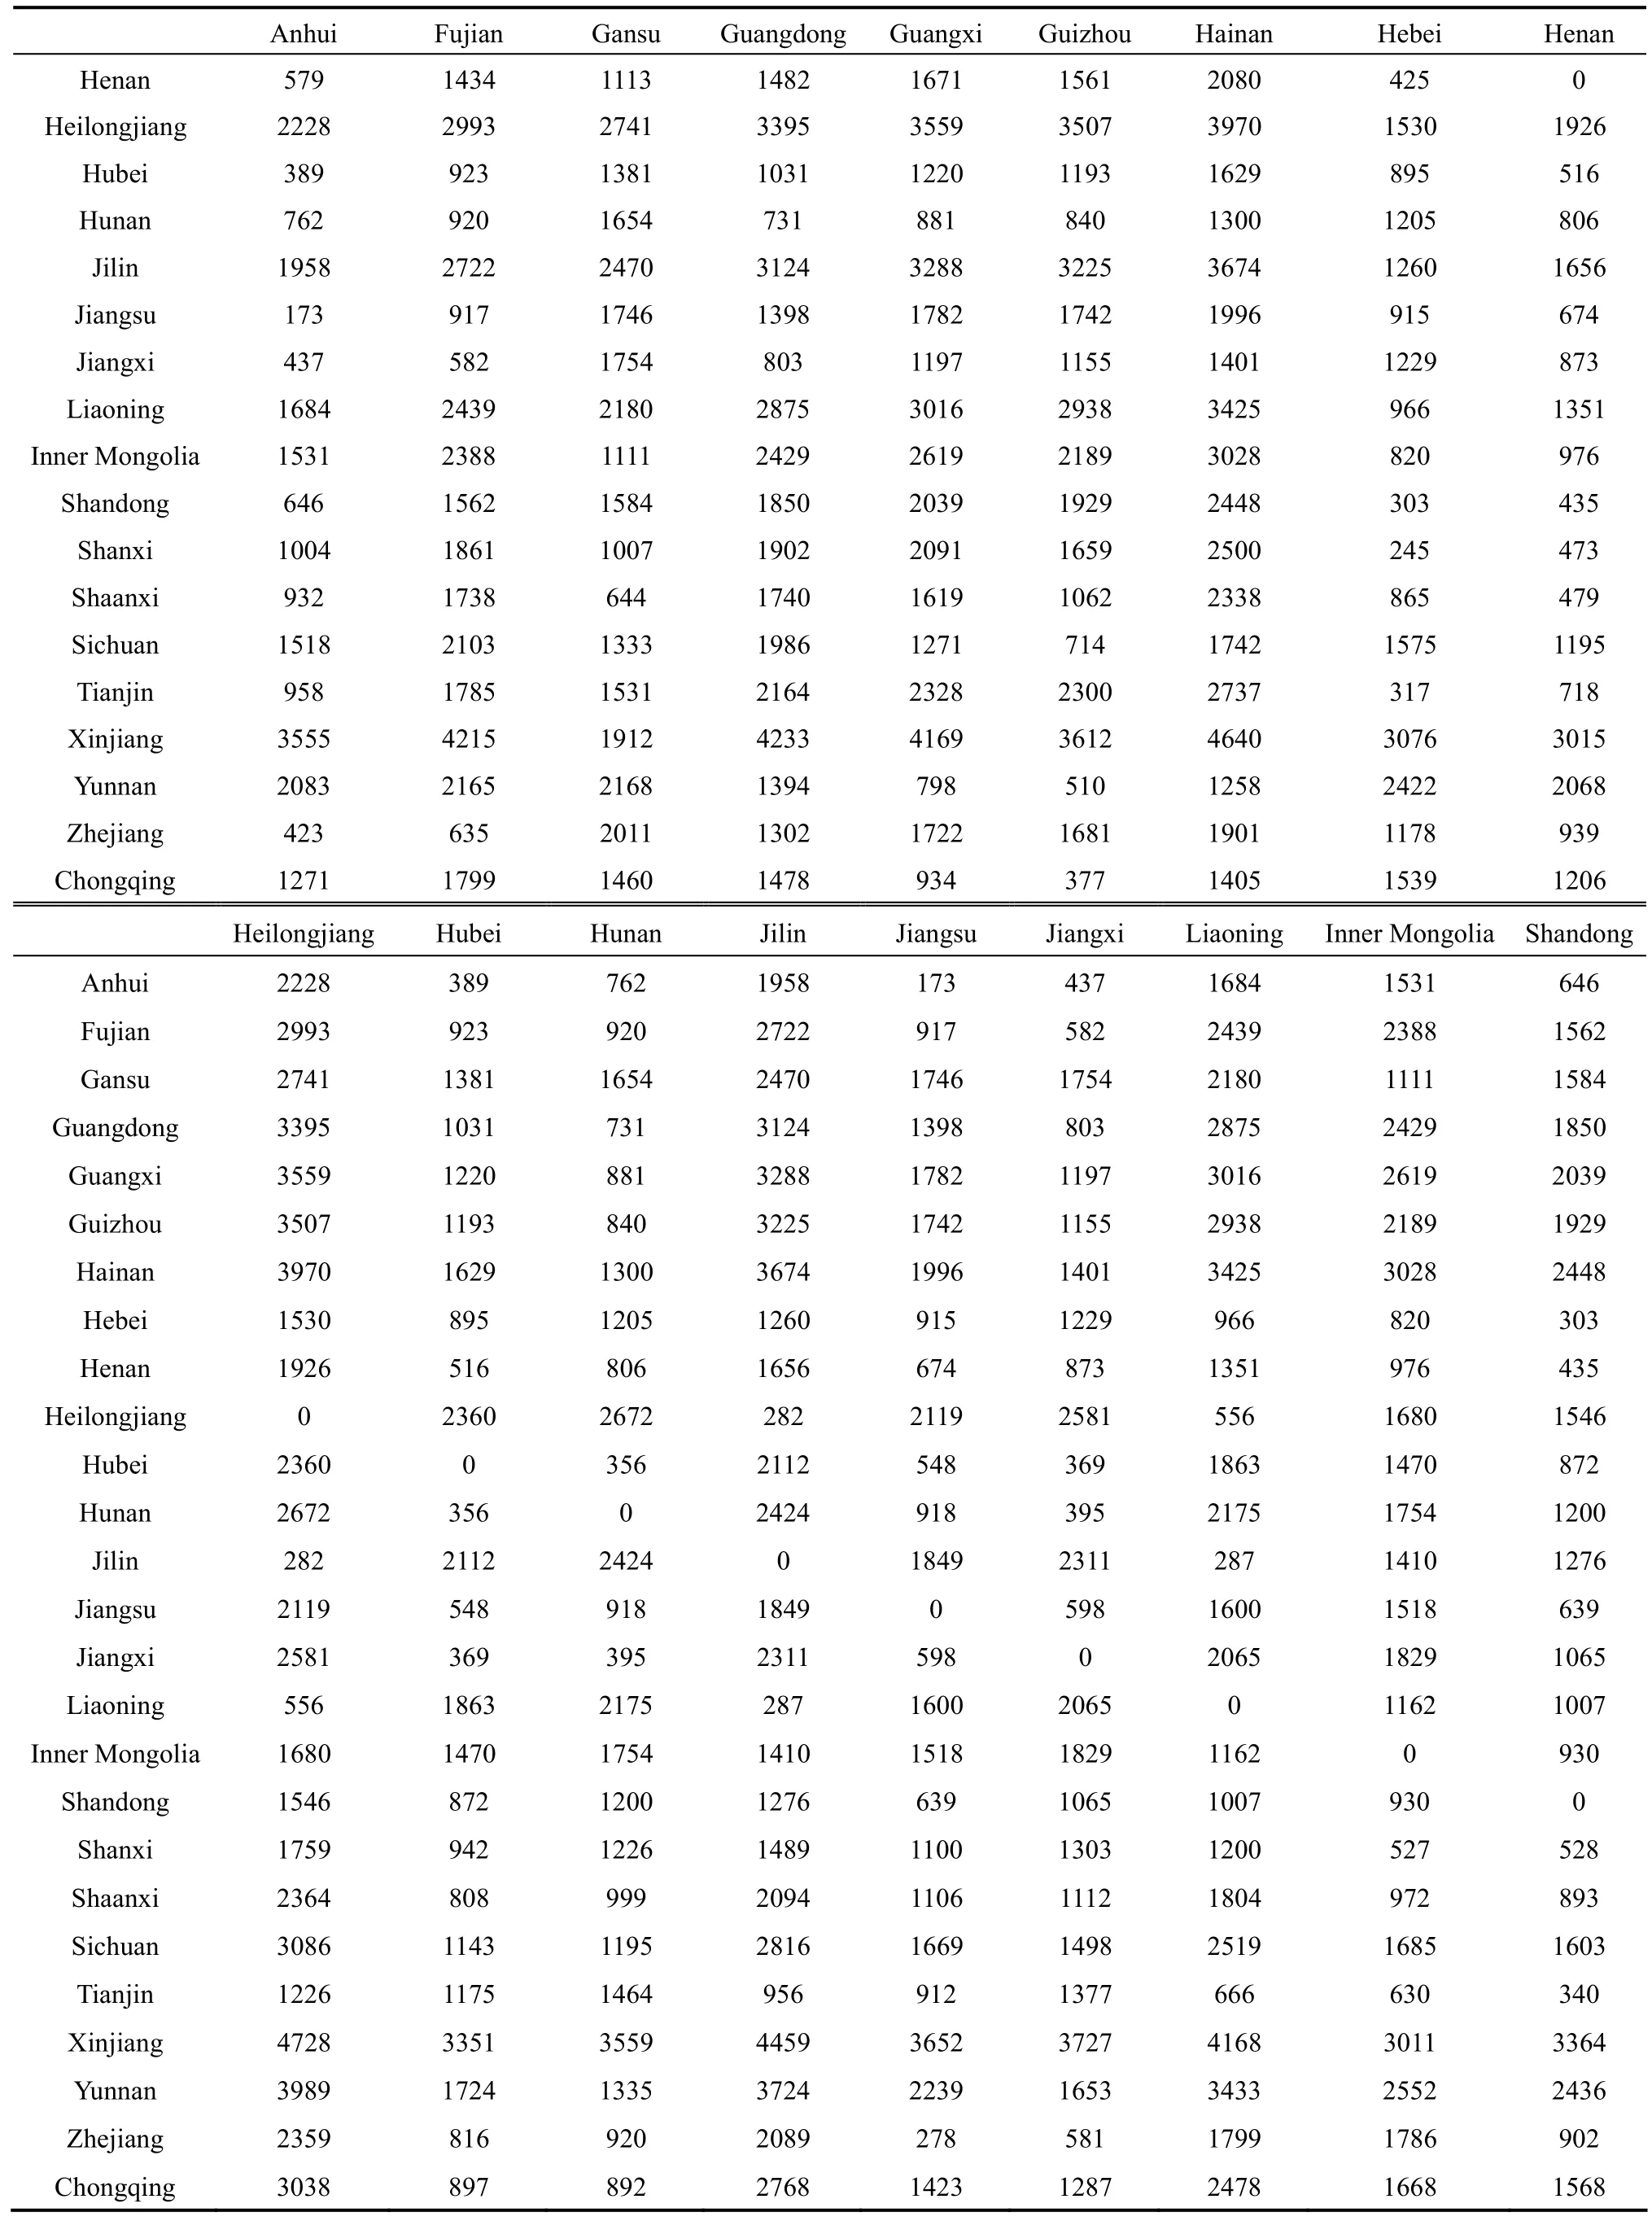
Table A1 (Continued)

Table A1 (Continued)
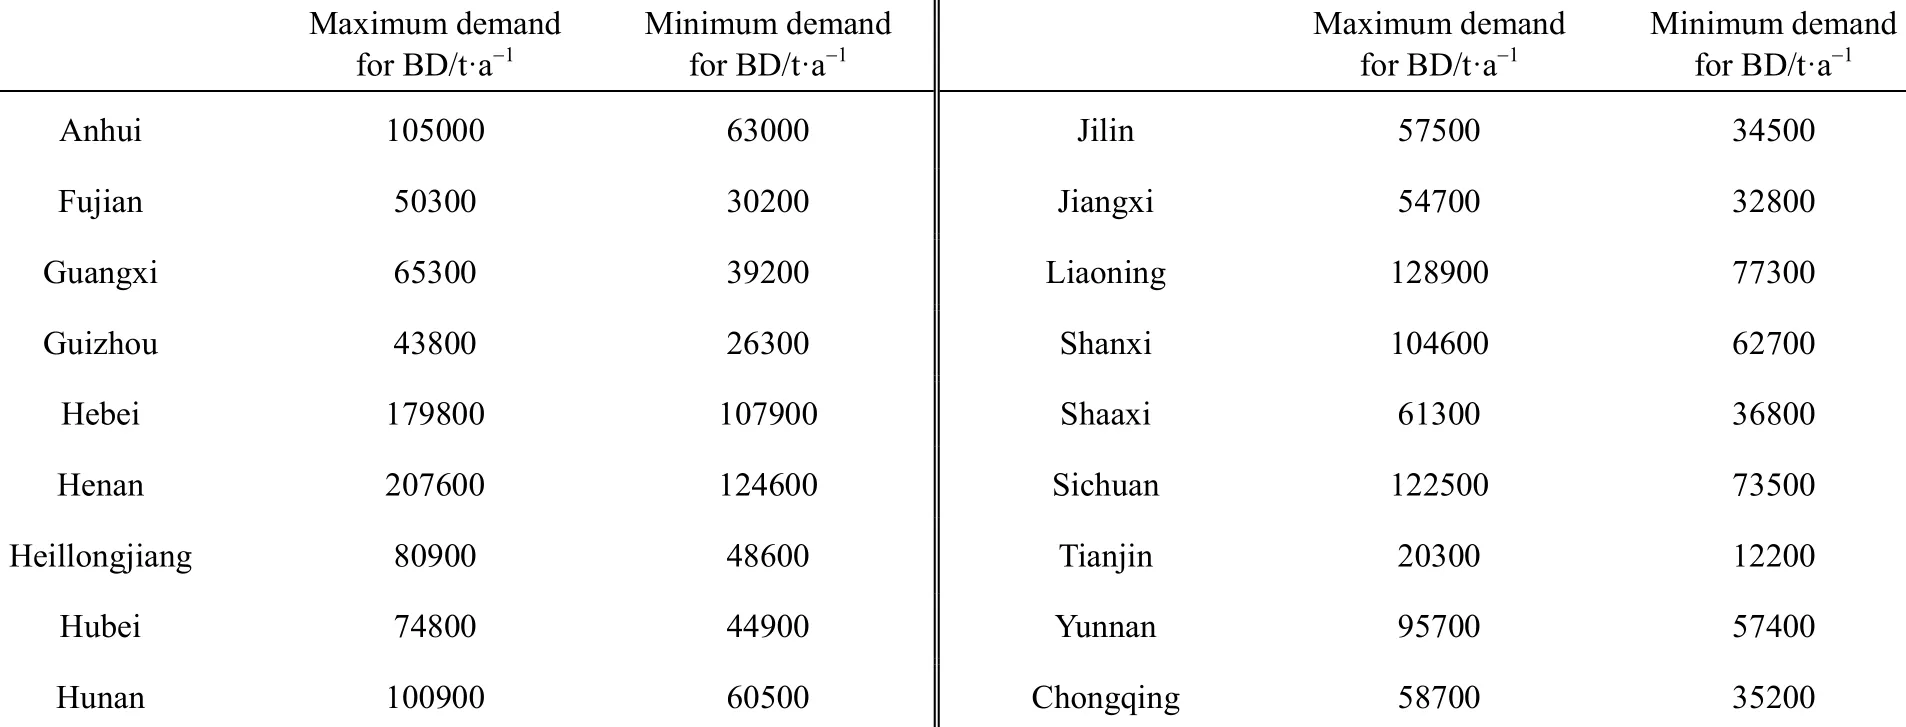
Table A2 Demand for bio-fuel in possible markets [30]
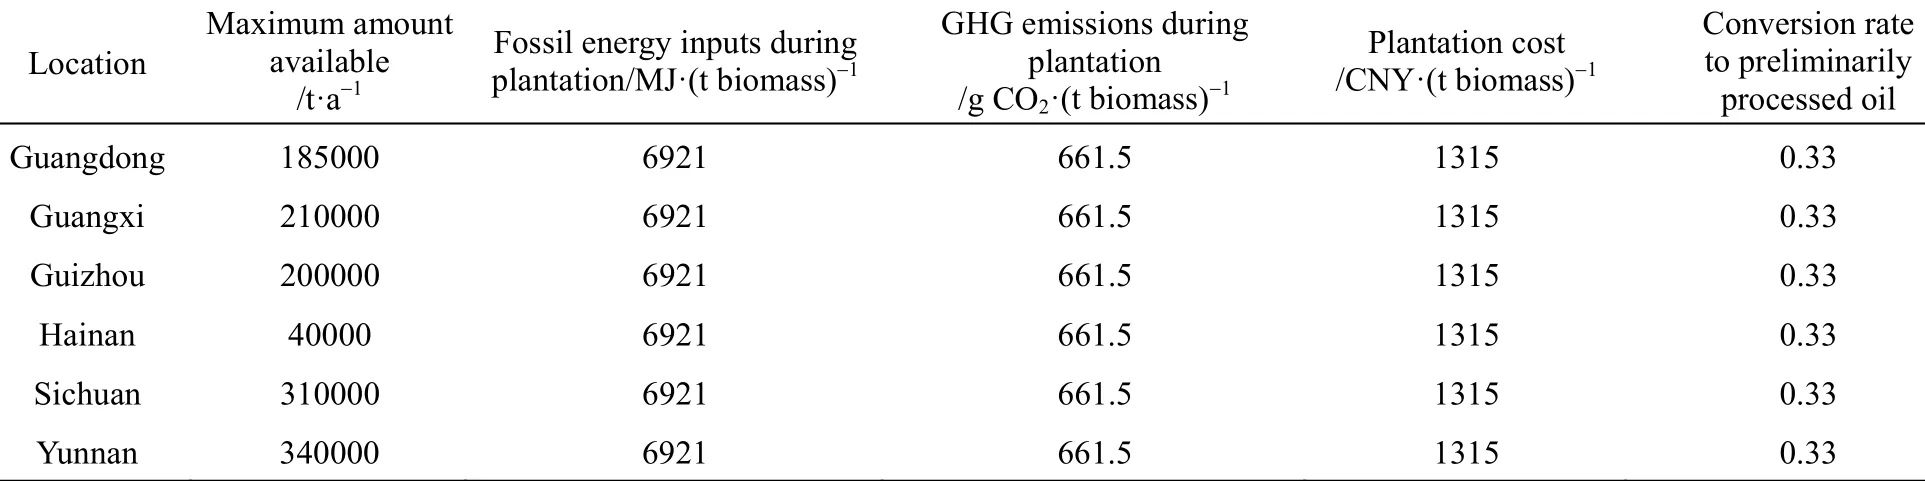
Table A3 Plantation information about Jatropha fruit [5, 10, 29-31]
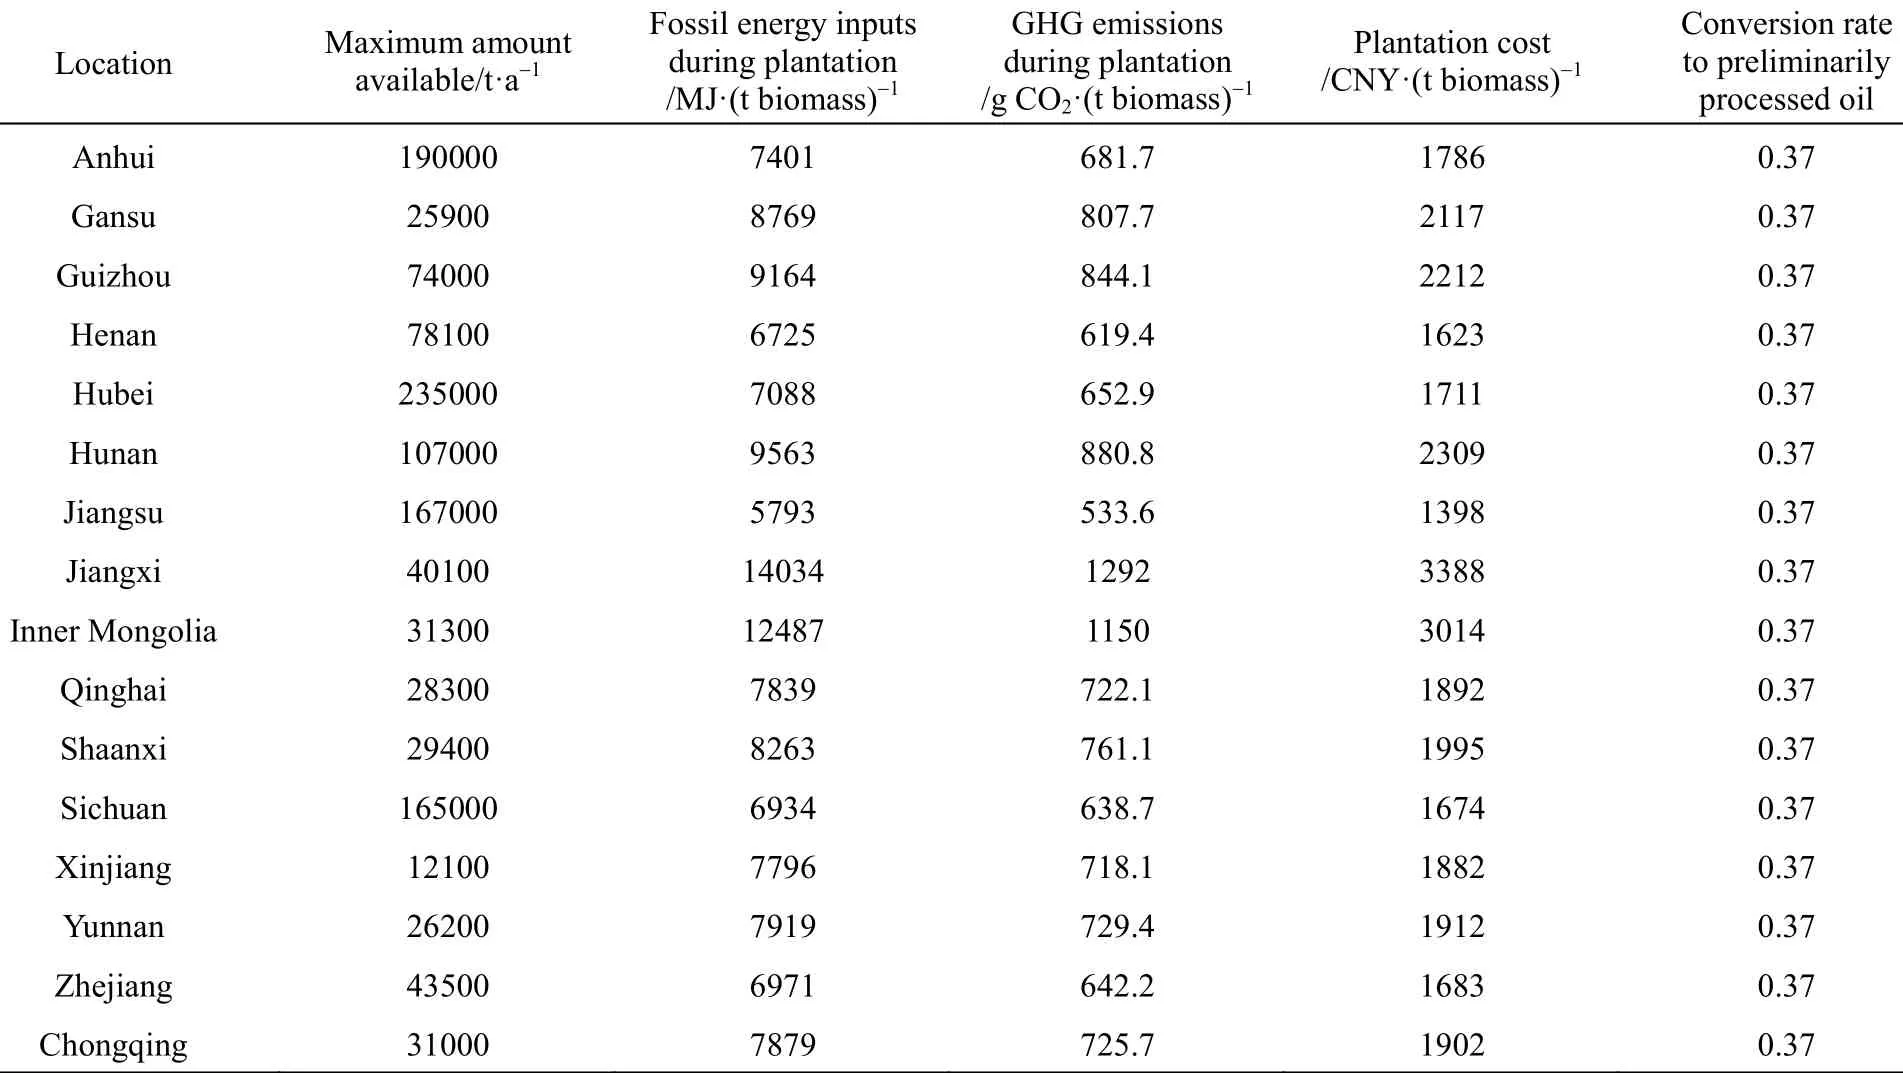
Table A4 Plantation information about rapeseed [5, 10, 29-31]

Table A5 Information about integrated factory [5, 10, 29-31]
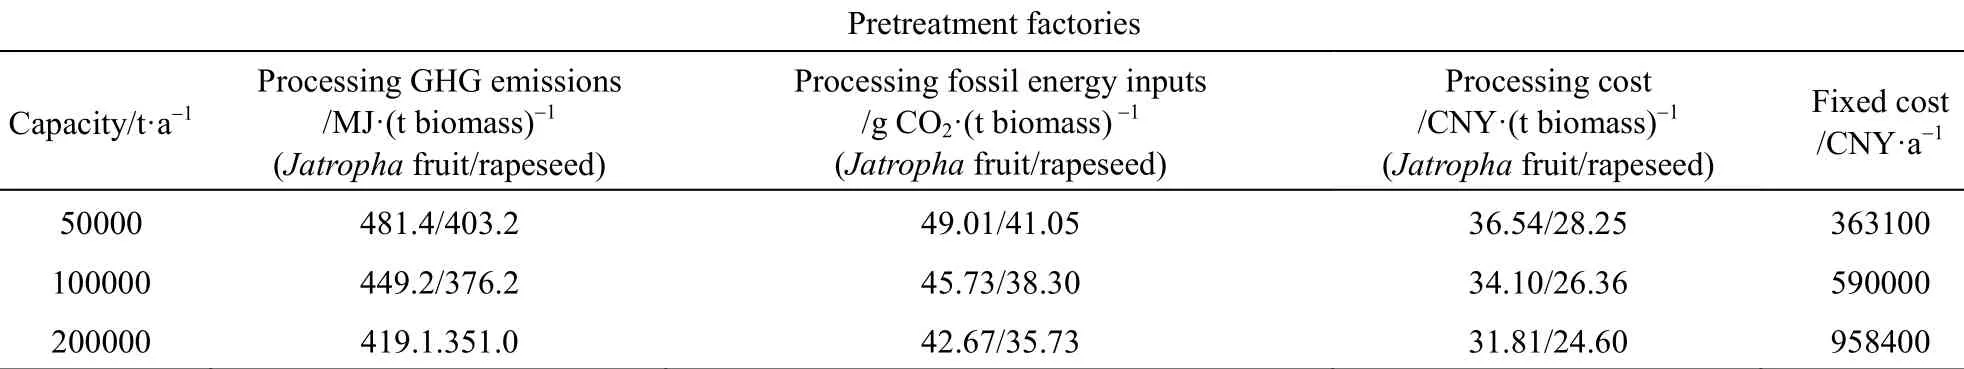
Table A6 Information about two steps factory [5, 10, 29-31]
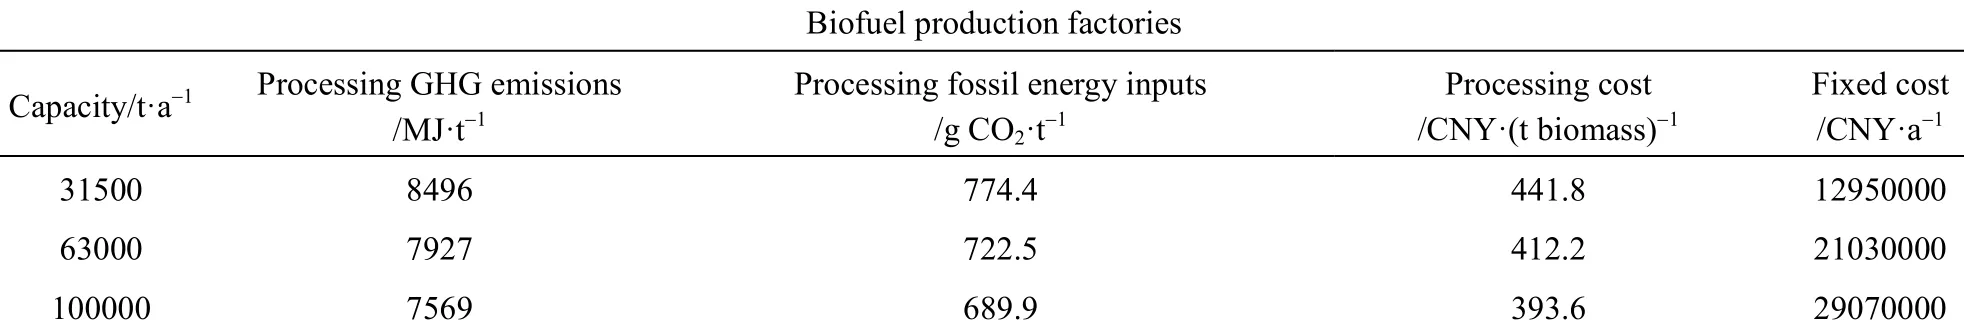
Table A6 (Continued)

Table A7 Information about transportation [10]

Table A8 Other information about products and pathways
2013-08-22, accepted 2013-09-30.
* Supported by the Chinese Academy of Engineering (20121667845).
** To whom correspondence should be addressed. E-mail: dcecbz@tsinghua.edu.cn
 Chinese Journal of Chemical Engineering2014年6期
- Chinese Journal of Chemical Engineering的其它文章
- Roles of Biomolecules in the Biosynthesis of Silver Nanoparticles: Case of Gardenia jasminoides Extract*
- Modeling and Optimization for Short-term Scheduling of Multipurpose Batch Plants*
- Symbiosis Analysis on Industrial Ecological System*
- Phase Behavior of Sodium Dodecyl Sulfate-n-Butanol-Kerosene-Water Microemulsion System*
- Photochemical Process Modeling and Analysis of Ozone Generation
- Unified Model of Purification Units in Hydrogen Networks*