Numerical simulation of the aerodynamic characteristics of heavy-duty trucks through viaduct in crosswind*
HU Xing-jun (胡兴军), QIN Peng (秦鹏), LIAO Lei (廖磊), GUO Peng (郭鹏), WANG Jing-yu (王靖宇), YANG Bo (杨博)State Key Laboratory of Automobile Simulation and Control, Jilin University, Changchun 130012, China,E-mail:hxj@jlu.edu.cn
Numerical simulation of the aerodynamic characteristics of heavy-duty trucks through viaduct in crosswind*
HU Xing-jun (胡兴军), QIN Peng (秦鹏), LIAO Lei (廖磊), GUO Peng (郭鹏), WANG Jing-yu (王靖宇), YANG Bo (杨博)
State Key Laboratory of Automobile Simulation and Control, Jilin University, Changchun 130012, China,
E-mail:hxj@jlu.edu.cn
(Received January 8, 2013, Revised December 31, 2013)
In our numerical simulation the hybrid mesh and the SSTk-ωturbulence model are adopted to investigate the variations of the aerodynamic loads and the flow field of heavy-duty trucks while crossing a viaduct with 1.1 m high fences in a crosswind at a velocity of 20 m/s. The results show that, with the protection of a fence, the side force is weakened, and the rolling and yaw moments are strengthened while the truck is crossing the viaduct, which relatively reduces the roll-over safety and the driving stability of the truck. Meanwhile, the direction of the side force changes when the truck enters the viaduct, which makes the roll-over safety and the driving stability the lowest during the process.
computational fluid dynamics, heavy-duty truck, crosswind, cross viaduct, aerodynamic loads, flow field
Introduction
Vehicles usually encounter a crosswind when moving on a road. Such a crosswind significantly affects the driving stability of the vehicles, particularly those with high and steep sides. Viaducts are more likely to be exposed to crosswind conditions. Trucks moving through viaducts will experience a crosswind. With the existence of a fence, the flow field around the truck becomes complex.
The aerodynamic characteristics of a vehicle under crosswind conditions were widely studied, including the situations when a vehicle travels on a viaduct or a subgrade. Bettle et al used numerical methods to study the aerodynamic characteristics of a tractor-trailer vehicle when crossing a bridge. Bridges and open highways are always exposed to crosswind conditions, such that tractor-trailer vehicles have the risk of rolling over. Bettle determined the relationshipbetween the vehicle traveling speed and the side force and then the safety speed when crossing a bridge[1]. Sterling et al.[2]focused on the aerodynamic forces and moments on a high-sided lorry and determined the flow structure around the lorry through on-road testing, wind tunnel testing, and computational fluid dynamics simulations. Studies of aerodynamic characteristics of vehicles or trains under crosswind conditions were also conducted in other countries, including Japan, the UK, Sweden, and Germany[3-5]and the accuracy of the numerical simulation and testing methods was validated[6-8]. Meanwhile, the effect of the front shapes on the aerodynamic characteristics under crosswind conditions was also a research focus[9-11].
In China, the aerodynamic characteristics of vehicles under crosswind conditions have been studied for many years. Jilin University explored the evolution of the aerodynamic characteristics of a sedan under crosswind conditions[12]. Hunan University focused on the effects of different methods of dealing with the crosswind in numerical simulations[13,14]. Other studies focused on heavy-duty trucks and trains under crosswind conditions[15,16].
Most studies focused on the aerodynamic characteristics of vehicles while on a viaduct. In fact, the change of road conditions while crossing a viaduct from the ground significantly affects the aerodynamiccharacteristics of vehicles.
In this paper, a common viaduct in China and a heavy-duty truck are selected as research objects. Numerical simulations are carried out to study the evolutions of the flow fields around the truck while crossing a viaduct. The influence of different positions on the viaduct on the aerodynamic effects of a truck is also studied.
1. Geometrical model
A common two-lane viaduct and a heavy-duty truck are considered. The geometrical parameters of the viaduct model are shown in Fig.1. The viaduct has fences of 1.1 m high on two sides.
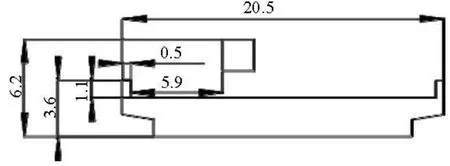
Fig.1 Model of viaduct dimensions (m)
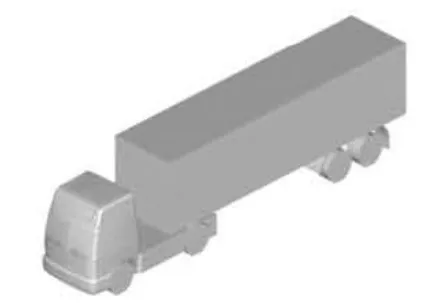
Fig.2 Model of the heavy-duty truck
The truck is 14 m in length. The length of the container is 10.5 m. The geometry of the heavy-duty truck is shown in Fig.2.
2. Numerical simulations
2.1Grid strategy
The computational domain is shown in Fig.3 and it is discretized by a hybrid grid strategy. As seen from Fig.3, the grid contains two kinds of cells: one is a polyhedron far from the truck, and the other is a polyhedral prism near the truck surface. After refining the grid around the truck body, the final grid is shown in Fig.3.
To study how different positions on the viaduct would influence the flow field and the aerodynamic loads around the truck, we consider four positions, as shown in Table 1 and Fig.4. The truck speed is taken as 30 m/s, whereas the velocity of the crosswind is 20 m/s.
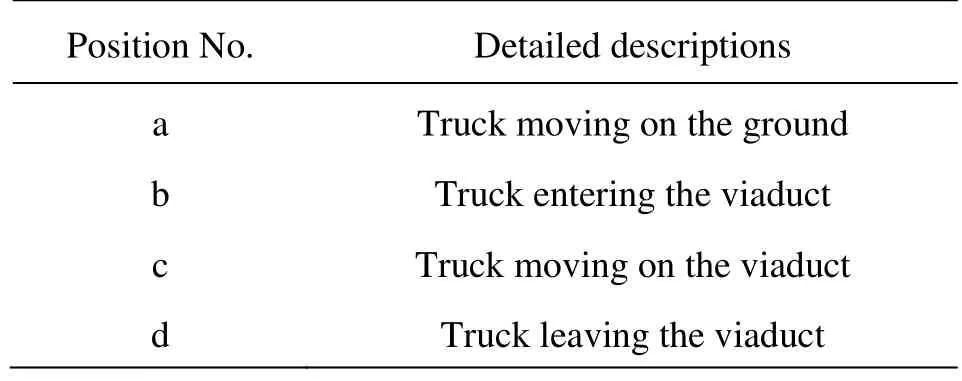
Table 1 Four situations studied in this paper
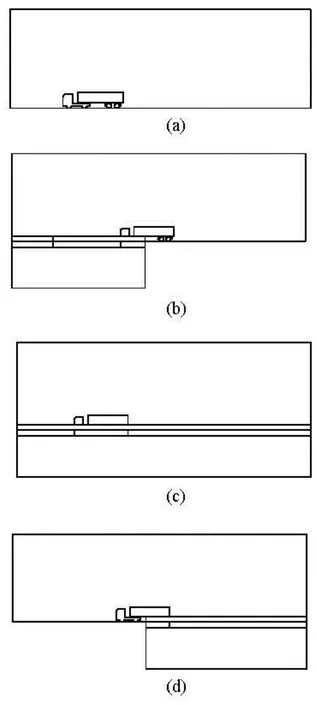
Fig.4 Relative positions of truck on the viaduct while crossing the viaduct
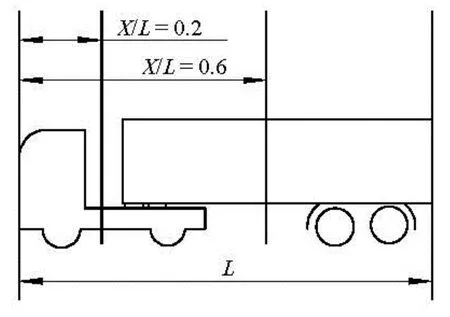
Fig.5 Cross-section locations
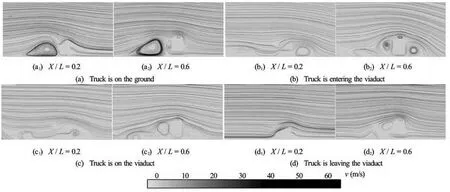
Fig.6 Structure of the flow field in different positions
Figure 4 shows the geometries of the truck and the viaduct at the four different positions.
2.2Boundary conditions
The velocity inlet is adopted as the inlet, and the turbulence intensity is set as 0.5%. The pressure outlet is taken as the outlet, and the reference pressure is set as 0 Pa. The boundaries of the computational domain are assumed as in the symmetry conditions. The ground and the viaduct have moving walls. The body of the truck has stationery walls.
2.3Turbulence model
The SSTk-ωmodel by Menter is used in the numerical simulations. As a two-equation viscosity model,k-ωmodel can well simulate the turbulent flow far from the wall.k-ωmodel is often used for boundary conditions of different pressure gradients. The SSTk-ωmodel combines the features of the two models, keeping the originalk-ωmodel at places near the wall and retaining thek-εmodel at places far from the wall. Therefore, the SSTk-ωmodel enjoys a better simulation performance in terms of the separation of the flow and is more suitable for the numerical simulation of the aerodynamic characteristics of vehicles than the other two models separately[17].
In thek-ωmodel model, the formula of the turbulent viscosity is as follows

In this formula, the expression ofkis the same as that in thek-εmodel However, the expression of the energy dissipation is different and is given byε=Ctkω. The expression ofωis as follows

By adding the following cross diffusion, thek-ωmodel is approximately equivalent to thek-εmodel

In the SST model, a blending function is used to achieve a transition from thek-ωmodel to thek-εmodel. In the blending function, the distance from the wall and the turbulence quantities are used as parameters. The function is then multiplied by the cross diffusion (3). In addition, the constants of the model are given below, with subscript 1 representing thek-ωmodel and subscript 2 representing thek-εmodel.
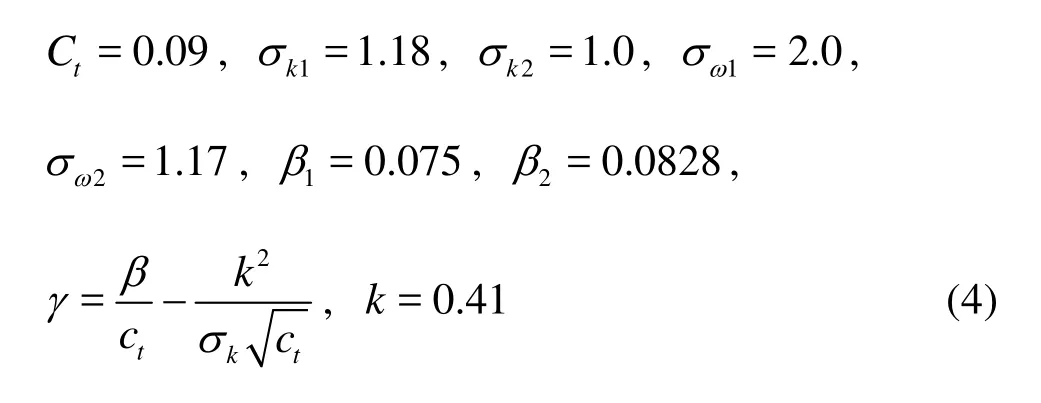

Table 2 Aerodynamic loads in different positions
Therefore, the SST model can be expressed by the following turbulent viscosity equation

In the equation,a1=0.31, andΩis the average vorticity. In the computation, both Eqs.(1) and (5) are interpolated by another blending function with the wall distance and the turbulence quantities as its arguments.
3. Results and discussions
3.1Variation of flow field around the truck
To study how the crosswind influences the flow field around a truck in different positions on the viaduct, the front of the truck is taken as the starting point and then the distance from the starting point on theX-axis is taken asX. The length of the truck isL. With the ratio ofXtoL, we define the location of the section of the truck, as shown in Fig.5. When the truck is entering and leaving the viaduct,X/L= 0.2 andX/L=0.6, respectively, refer to the locations of the section of the truck on both the viaduct and the ground.
Figure 6 shows the velocity streamline at the rear of the cab (X/L=0.2) and the container center (X/L=0.6)when the truck and the viaduct are in different relative positions.
When the truck is on the ground, one side of the truck would be exposed to the crosswind. A pair of vortices would form at the leeward side of the truck, particularly at the container. Meanwhile, at the edge of the windward side of the truck, vortices are also generated because of the separation of the flow.
When the truck enters the viaduct, the front of the truck is under the protection of the fences, such that the crosswind would not flow onto the front directly. However, the rear part of the truck remains on the ground and is exposed to the crosswind. Moreover, the surface conditions of the road that connects the ground and the viaduct are complicated, which makes the flow field around the truck complex. Compared with the cases in the other three positions, both the size and the speed of the vortices that are formed between the truck and the fence are significantly greater. Such kind of vortices also extends to the rear area of the truck, which also contributes to the backward movement of the separation zone. At the leeward side of the container, a vortex forms at the position similar to that when the truck is on the viaduct. When considering the speed of turbulence, such speed is larger because the vortex is closer to the top and the side of the truck.
When the truck is on the viaduct, it is influenced by the vortices that are generated between the truck and the fences. In Fig.6, the vortices between the truck and the fences are very distinct. Simultaneously, a large low-speed vortex forms at the leeward side of the truck low. The separation of the side flow remains, such that a vortex still exists at the top and the bottom of the container.
When the truck leaves the viaduct, the front of the truck is on the ground, whereas the container is on the viaduct. The flow field at the back of the cab is almost consistent with that on the ground. Although the container is under the protection of the fences, a vortex does not form behind the fences because the container is at the end of the viaduct. Similarly, the flow field around the container is consistent with that on the ground.
3.2Influence of crosswind on the aerodynamic force on the truck
Table 2 shows the aerodynamic forces and the moments of the truck in positions a, b and c, as illustrated in Fig.4. Table 3 shows the dimensionless coefficients of each force and moment in the given positions.
Figure 7 shows four different pressure distributions on the windward side and the leeward side. a, b, c, and d denote the four positions in Table 1.
When the truck is moving on the ground, the crosswind causes a great lateral force of 27.95 kN, and the direction is the same as that of the crosswind. Meanwhile, the edge of the container causes the separation of the flow, such that on the top of the truck, a large negative pressure area is formed, which increases the aerodynamic lift to 14.98 kN. However, according to Fig.7, the distribution of the pressure on the windward and leeward sides of the truck is relatively even, which indicates that the yaw moment and the lateral force are relatively small.

Table 3 Aerodynamic coefficients in different positions

Fig.7 Pressure distribution on the body of the truck in different positions
According to the aerodynamic loads, the driving resistance is slightly larger when the truck is on the viaduct than when it is on the ground. With the protection of the fences, the lateral force and the lift on the truck are weakened, but each moment on the truck increases. In Fig.7(c), the height of the fences is limited, such that the pressure from the crosswind mainly concentrates on the top of the truck, and the pressure on the bottom of the truck decreases, which could explain why the lateral force and the lift on the truck are weakened, whereas each moment on the truck is increased. As a result, an unstable and dangerous situation occurs when the truck is moving on the viaduct.
When the truck enters the viaduct, the complicated surface condition of the road that connects the ground and the viaduct makes the flow field at the end of the viaduct complex. From Fig.7, the back of the container is still within the wake flow of the crosswind. In addition, the complicated road surface condition significantly increases the aerodynamic resistance and the lateral force. The direction of the lateral force and those in the other three positions are opposite. In this position, the direction of the lateral force is from the leeward side to the windward side, which is mainly caused by the wake flow of the fences. The existence of the high-speed vortices at the windward side of the truck results in a low static pressure in this area. From the pressure distribution in Fig.7, a large area of low static pressure is seen on the windward side of the truck, which causes a lateral force from the leeward side to the windward side when the truck is entering the viaduct. Furthermore, the pressure on the truck mai-nly concentrates on the front part, which increases the aerodynamic moment but decreases the driving stability and safety.
When the truck is leaving the viaduct, only a part of the container is on the viaduct. However, as the truck is at the end of the viaduct, the influence of the wake flow from the fences is weakened by the flow coming from the end of the viaduct. Therefore, the structure of the flow field around the truck is similar to that when it is on the ground. At the front of the truck and the windward side of the container, no vortex exists. Moreover, the speed of the flow near the container is decreased by the fences. From the pressure distribution in Fig.7(d), the pressure on the windward side of the truck is lower, whereas the pressure on the leeward side is higher as compared with that in position (a). The influence of the wake flow from the fences is limited, therefore, no vortex exists between the truck and the fence. Moreover, the well-distributed pressure on the windward side of the truck decreases the lateral force and the lateral moment on the truck. However, as the whole pressure on the bottom of the container is lowered by the fences and the front of the truck is exposed to the crosswind, the pressure on the front ofthe truck remains very high, which significantly increases the yaw moment and decreases the driving stability.
4. Conclusions
In this paper, numerical simulations are carried out to study the characteristics of the flow field around a truck when it is on ground, entering the viaduct, on the viaduct, and leaving the viaduct.
When the truck is entering the viaduct with the crosswind on the side, the road surface conditions and the flow field around the truck are very complicated because of the existence of the fences. Although only the front of the truck is on the viaduct, the wake flow from the fences influences the whole truck. The aerodynamic resistance and the lateral force are significantly increased, similar to the aerodynamic moment. As a result, the driving stability and safety are the lowest when the truck is entering the viaduct. When the truck is moving on the viaduct, the protection from the fences decreases the lateral force and the lift on the truck. However, the limited height of the fences makes the lateral pressure concentrate on the top of the truck, which increases both the lateral moment and the yaw moment and results in the low driving stability and safety. When the truck is leaving the viaduct, the flow field around the truck is similar to that when the truck is on the ground. Meanwhile, the protection from the fences causes the force concentrate on the front of the truck, which significantly reduces the driving stability.
The results of numerical simulations suggest that when the fences of the viaduct are insufficiently high, the driving stability would be significantly reduced when the truck is crossing the viaduct, particularly when it is entering the viaduct.
Acknowledgement
This work was supported by the Foundation for Basic Science and Research of Jilin University.
[1] BETTLE J., HOLLOWAY A. G. L. and VENART J. E. S. A computational study of the aerodynamic forces acting on a tractor-trailer vehicle on a bridge in crosswind[J].Journal of Wind Engineering and Industrial Aerodynamics,2003, 91(5): 573-592.
[2] STERLING M., QUINN A. D. and HARGREAVES D. M. et al. A comparison of different methods to evaluate the wind induced forces on a high sided lorry[J].Journal of Wind Engineering and Industrial Aerodynamics,2010, 98(1): 10-20.
[3] SUZUKI M., TANEMOTO K. and MAEDA T. Aerodynamic characteristics of train/vehicles under cross winds[J].Journal of Wind Engineering and Industrial Aerodynamics,2003, 91(1-2):209-218.
[4] KHIER W., BREUER M. and DURST F. Flow structu
re around trains under side wind conditions: a numerical
study[J].Computers and Fluids,2000, 29(1): 179-195.
[5] BAKER C. J. The simulation of unsteady aerodynamic cross wind forces on trains[J].Journal of Wind Engineering and Industrial Aerodynamics,2010, 98(2): 88-99.
[6] SANQUER S., BARRE C. and de VIREL M. D. et al. Effect of cross winds on high-speed trains: Development of a new experimental methodology[J].Journal of Wind Engineering and Industrial Aerodynamics, 2004, 92(7): 535-545.
[7] BAKER C. J., JONES J. and LOPEZ-CALLEJA F. et al. Measurements of the cross wind forces on trains[J].Journal of Wind Engineering and Industrial Aerodynamics, 2004, 92(7-8): 547-563.
[8] STERLING M., QUINN A. D. and HARGREAVES D. M. et al. A comparison of different methods to evaluate the wind induced forces on a high sided lorry[J].Journal of Wind Engineering and Industrial Aerodynamics,2010, 98(1): 10-20.
[9] CARRARINI A. Reliability based analysis of the crosswind stability of railway vehicles[J].Journal of Wind Engineering and Industrial Aerodynamics,2007, 95(7): 493-509.
[10] GOHLKE M., BEAUDOIN J. F. and AMIELH M. et al. Shape influence on mean forces applied on a ground vehicle under steady cross-wind[J].Journal of Wind Engineering and Industrial Aerodynamics,2010, 98(8): 386-391.
[11] ALAM F., WATKINS S. Effects of crosswinds on double stacked container wagons[C].Proceedings of 16th Australasian Fluid Mechanics Conference Crown Plaza.Gold Coast, Australia, 2007.
[12] WANG Fu-liang, HU Xing-jun and YANG Bo et al. A study on the comparison between steady and dynamic numerical simulations of the cross wind effects on car aerodynamic characteristics[J].Automotive Engineering, 2010, 32(6): 477-481(in Chinese).
[13] HAI Gui-chun, GU Zheng-qi and WANG He-yi et al. Research on the effect of crosswinds on the stability of high speed vehicles[J].Journal of Hunan University (Natural Sciences),2006, 33(2): 40-43.
[14] GONG Xu, GU Zheng-qi and LI Zhen-lei et al. A study on the numerical simulation of car aerodynamic characteristics under crosswind conditions[J].Automotive Engineering,2010, (1): 13-16(in Chinese).
[15] JIANG Hao, YU Zhuo-ping. Effect of side wind on handling performance of truck with trailer[J].Journal of Tongji University,2001, 29(12): 1451-1455.
[16] DONG Xiang-ting, DANG Xiang-peng. Study on influence of wind barriers on traffic safety of trains under crosswind by numerical simulation[J].Journal of the China Railway Society,2008, 30(5): 36-40(in Chinese).
[17] ZHOU Yu, QIAN Wei-qi and DENG You-qi et al. In
troductory analysis of the influence of Menter’sk-ωSST turbulence model’s parameters[J].Acta Aerodynamica Sinica,2010, 28(2): 213-217(in Chinese).
10.1016/S1001-6058(14)60044-5
* Project supported by the National Natural Science Foundation of China (Grant No. 50805062), the Development Programs in Science and Technology of Jilin Province (Grant No. 20096005).
Biography: HU Xing-jun (1976-), Male, Ph. D.,
Associate Professor
- 水动力学研究与进展 B辑的其它文章
- Effect of bank slope on the flow patterns in river intakes*
- Influence of artificial ecological floating beds on river hydraulic characteristics*
- Numerical investigation of flow through vegetated multi-stage compound channel*
- Responses of thermal structure and vertical dynamic structure of South China Sea to Typhoon Chanchu*
- Effect of vegetated-banks on local scour around a wing-wall abutment with circular edges*
- URANS simulations of ship motion responses in long-crest irregular waves*

