
International Trade Status of Chinese Medicinal Materials from 2000 to 2012
2014-05-15 07:40:06QIANYunxuZHANGZhongpengYANGYueBIKaishun
亚洲社会药学杂志 2014年3期
QIAN Yun-xu, ZHANG Zhong-peng, YANG Yue, BI Kai-shun
(1.School of Business Administration, Shenyang Pharmaceutical University, Shenyang 110016, China; 2.Faculty of Life Science and Technology, Kunming University of Science and Technology, Kunming 650500, China; 3.National Technical Service Center For Trade, China Chamber of Commerce for Import and Export of Medicines and Health Products, Beijing 100010, China)
International Trade Status of Chinese Medicinal Materials from 2000 to 2012
QIAN Yun-xu1,2, ZHANG Zhong-peng3, YANG Yue1, BI Kai-shun1
(1.School of Business Administration, Shenyang Pharmaceutical University, Shenyang 110016, China; 2.Faculty of Life Science and Technology, Kunming University of Science and Technology, Kunming 650500, China; 3.National Technical Service Center For Trade, China Chamber of Commerce for Import and Export of Medicines and Health Products, Beijing 100010, China)
Objective To study the international trade trend of Chinese medicinal materials. Methods Trade data from 2000 to 2012, such as Chinese medicinal materials’ total international trade volume, prices of export and import, market shares, were analyzed empirically. Results and Conclusion Trade surplus of Chinese medicinal materials continued to expand and China’s competitiveness was growing substantially. The import prices were relatively stable while the export prices rose rapidly. The commodity compositions of export were relatively steady while those of the import were much more diverse. The export market of Chinese medicinal materials was too concentrated.
Chinese medicinal material; international trade; competitiveness; commodity composition of export and import
As the traditional superior products, Chinese medicinal materials were the chief export commodities in the past. In the 21st century, the role of Chinese medicinal materials in China’s international trade is declining while China’s share in global trade is growing. But Chinese medicinal materials, used as raw materials, are always the foundations for the development of Chinese medicinal industry. Furthermore, the strict international standards are helpful to optimize the industrial structure of Chinesemedicinal-material planting in the process of export. And imports of Chinese medicinal materials can overcome tight supply in the market. So it’s necessary to analyze the Chinese-medicinal-material international trade. Most of the previous researches focused on China’s international trade of Chinese medicinal materials in a short time, and this paper studied the long-term trend.
1 Data sources
Trade data from 2000 to 2012, such as Chinese medicinal materials’ total international trade volume, average prices of exports and imports, shares of different regions, were analyzed empirically in this paper. Raw data were from the database of China Chamber of Commerce for Import and Export of Medicines and Health Products. In order to eliminate the inflation interference, all data calculated with the U.S. dollars were deflated by CPI index and the year 2000 was used as a base reference.
2 Results
2.1 Flows in the trade of Chinese medicinal materials
Figure 1 shows that both imports and exports of Chinese medicinal materials have increased steadily since 2000. What distinguishes Chinese medicinal materials from other primary commodities is that China is a net supplier of Chinese medicinal materials but a net importer of other primary commodities[1]. China’s trade surplus in Chinese medicinal materials continued to widen in the past 13 years. The total volume of exports increased 410.99%, and imports increased 183.02%. The exports grew much rapidly than the imports. The trade competitiveness index was 0.45 in 2000 and soared to 0.71 in 2012. This indicates that China’s competitiveness in Chinese medicinal materials is higherthan the average level around the world.

Figure 1 Trade volume of Chinese medicinal materials (2000-2012)
2.2 Average import and export prices
Figure 2 shows the average annual import and export prices of Chinese medicinal materials from 2000 to 2012. The import prices were relatively steady and fluctuated between $1.0 and 1.8 per kilogram. Early on, the average export prices were below $1.5 per kilogram. And the prices were higher than it from 2008. The average export price reached $3.18 per kilogram and was much higher than the average import price at $1.78 per kilogram in 2012. The reasons for the high export prices in recent years lay in the increase of domestic demand, RMB appreciation, natural disasters and the shortage of Chinese medicinal materials after excessive exploitations.

Figure 2 Average prices of exports and imports of Chines medicinal materials (2000-2012)
2.3 Exports commodity structures of Chinese medicinal materials
Due to the adjustment of HS code, there are differences in the classification methods of Chinese medicinal materials in different years. So Figure 3 only shows the commodity structures of exports of Chinese medicinal materials from 2002 to 2010, based on export values. As can be seen in Figure 3, the commodity structures of exports of Chinese medicinal materials were relatively steady. Unlisted materials, consisting of different kinds of Chinese medicinal materials with low export values, had accounted for about 40% of annual export volume. Ginsengs had been the most valuable export product and taken up about 10% of the export volume of Chinese medicinal materials in most of time. The other Chinese medicinal materials with high export values were Chinese wolfberries, Chinese caterpillar fungi and chrysanthemums, etc.
Table 1 shows the amount of three kinds of imported Chinese medicinal materials with the highest export values in each year and their proportions. American ginsengs had ranked the top from 2001 to 2004. Unlisted materials, consisting of different kinds of Chinese medicinal materials, ranked the first place from 2005 to 2010, followed by spices, acacia gum. Ginsengs and licorices rose rapidly and became the chief imported products in the last two years. The varieties and proportions of the three top Chinese medicinal materials, in general, had changed greatly. It means that the exports of Chinese medicinal materials are more diversified.

Figure 3 Commodity compositions of exports of Chinese medicinal materials (2002-2010)
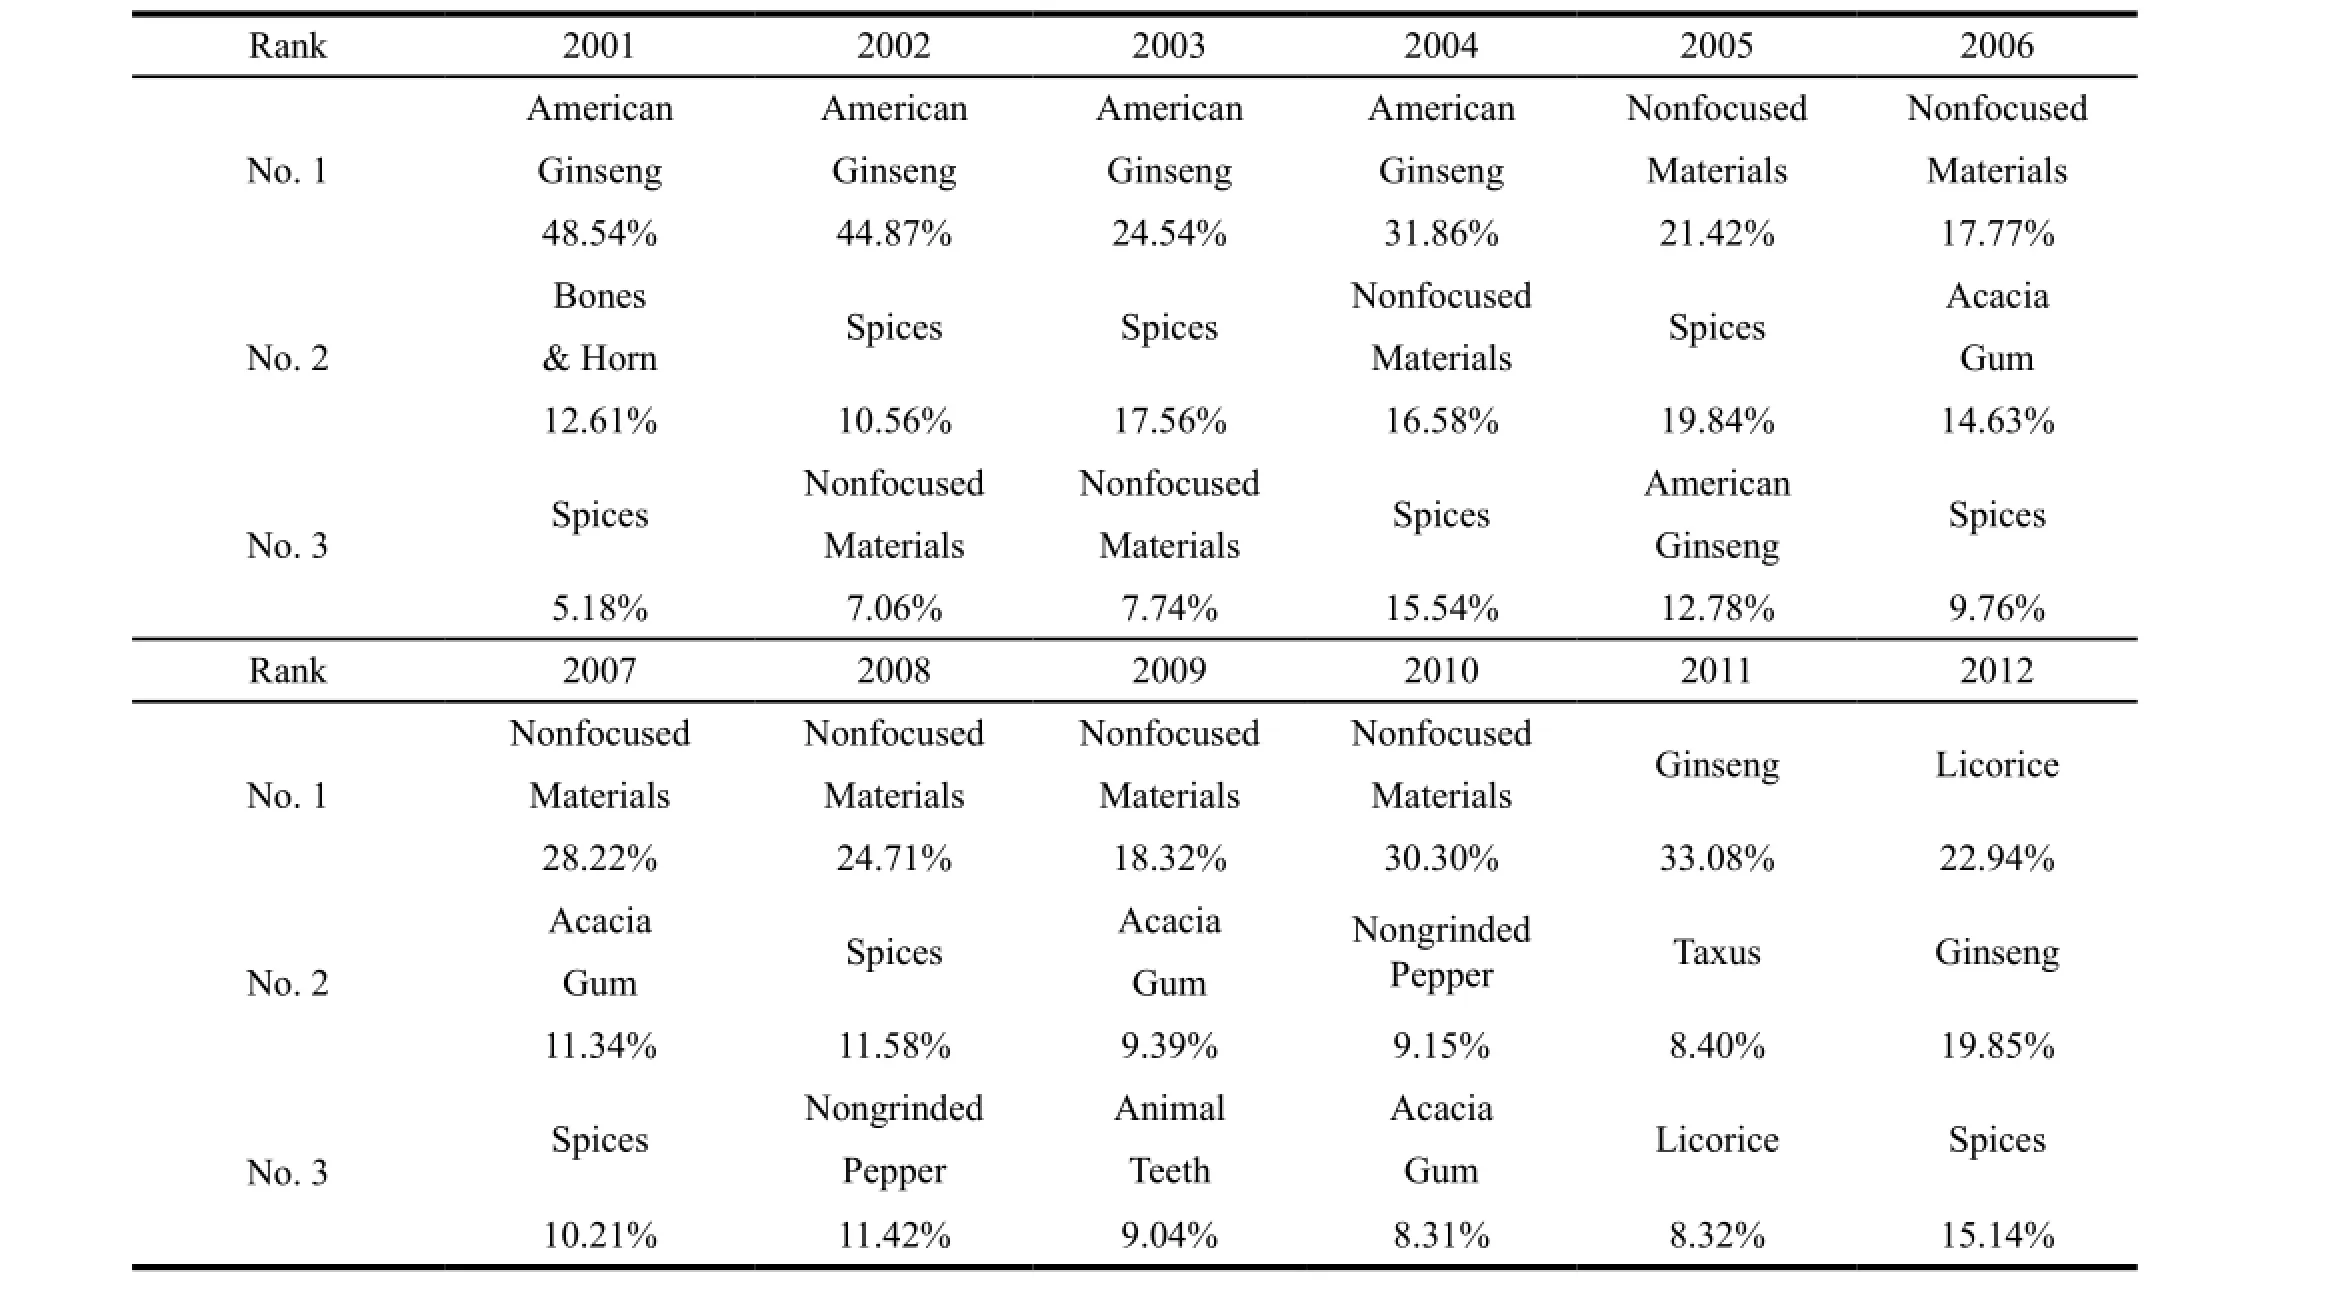
Table 1 High-ranking imported Chinese medicinal materials (2001-2012)
2.4 Export market structures of Chinese medicinal materials
The export market structure of Chinese medicinal materials from 2000 to 2012 is shown in Figure 4. The market could be divided into three parts: Asian, Europe and other continents. As can be seen in Figure 4, the structures were steady and the market was highly concentrated. Most of the exports had flown to Asia. Asia had maintained its place as the largest export market of Chinese medicinal materials to China from 2000 to 2012 and taken up over 80% of China’s export trade volume of Chinese medicinal materials. At the same time, Europe’s market-share fluctuated between 8% and 11% while the other continents’total market-share was fewer than 7%.
Asia was the largest export market for Chinese medicinal materials and its share grew to over 88% in 2012. Figure 5 shows the export market structure of Chinese medicinal materials in Asia in 2012. In Asia, Hong Kong was the largest importer for Chinese medicinal materials, with a 31% market-share in 2012, followed by Japan (29%), ASEAN (21%) and South Korean (13%). The total marketshare of the four regions accounted for more than 95% in Asia and over 84% in the world. The above data also indicate that the export market is highly concentrated and the structure is simple.

Figure 4 Export market structures of Chinese medicinal materials (2000-2012)
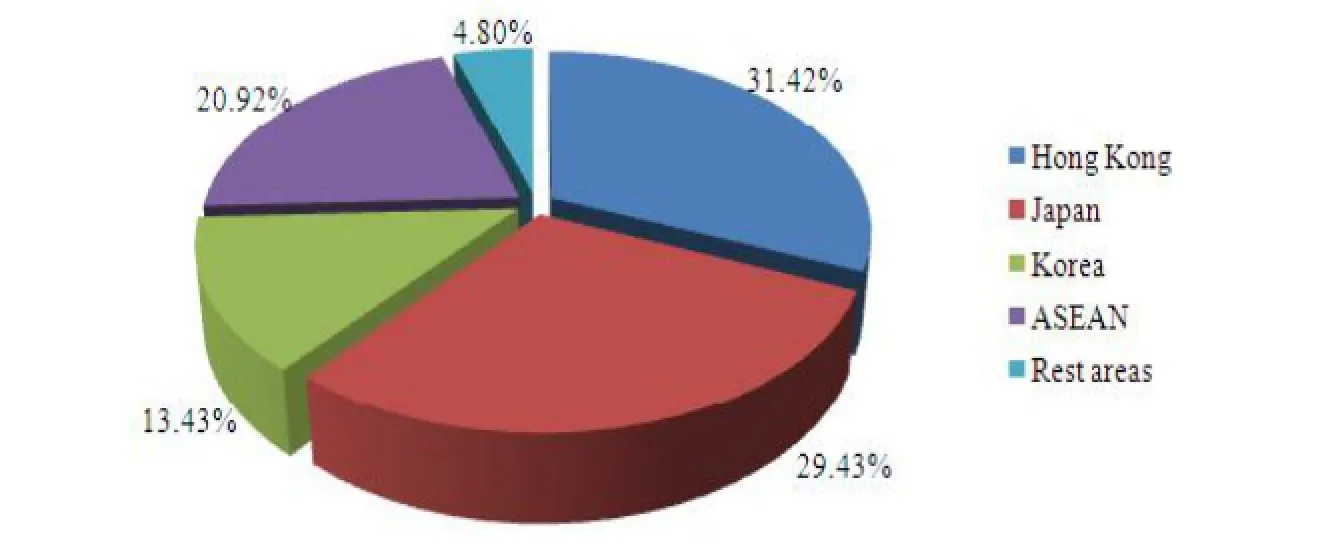
Figure 5 Export market structure of Chinese medicinal materials in Asia in 2012
3 Conclusions
There are some positive trends for China’s international trade of Chinese medicinal materials. First, China’s trade surplus continued to expand and China’s competitiveness was growing substantially. It suggests that, depending on traditional advantages of natural resources and labor forces, exports of Chinese medicinal materials have been increasing quickly over the years. Second, the import prices were relatively stable from 2000 to 2012 while the export prices rose rapidly in the later period. This shows that lower price is not the competitive advantage for China’s exports of Chinese medicinal materials anymore. The exports growth was not based on the increase of traditional inputs of labors and capitals, but on new methods, such as improving the qualities of products, increasing the added value of technology and providing better services to customers. Finally, the commodity structures of exports were relatively steady and the imports were much more diversified. The stable bulk of export is conductive to nurturing brands of Chinese medicinal materials and enhancing the trade competitiveness. And the diversity in imports is helpful to meet different kinds of customer needs.
But there are still some problems in the trade of Chinese medicinal materials. For a long time, most of the exports of Chinese medicinal materials flowed to Asian market. The biggest exporters of Chinese medicinal materials were the neighboring countries who had traditions of consuming Chinese medicinal materials[2]. The export market of Chinese medicinal materials was highly concentrated. This export structure was too weak to to hedge against all possible risks in export processes. Generally speaking, people living in countries with higher gross national income per capita tend to spend more money on natural products. Therefore, we can take these countries, such as North America, Australia and European Union as our major target market. We should be aware that we will face many difficulties when we explore the new market, such as the scarcity of customer identifications, the nonstability of product qualities and the popularity of green trade barriers etc. In order to solve these problems, it is necessary to increase inputs to improve the technology for the producers of Chinese medicinal materials.
[1] MA Tao, LI Bo, FANG Chang-ming, et al. Analysis of Physical Flows in Primary Commodity Trade: A Case Study in China [J]. Resources, Conservation and Recycling, 2006, 47: 73-81.
[2] YI Li-juan, ZHAO Yin-de, ZHANG Li-de. Analysis on Export Competitiveness and Strategy of Chinese Herbal Medicine [J]. Journal of Anhui Agriculture Science, 2010, 38(25):14091-14093.
Author’s information: BI Kai-shun, Professor. Major research area: Pharmaceutical analysis and pharmacy administration. Tel: 024-23986012, E-mail: bikaishun@126.com

- 亚洲社会药学杂志的其它文章
- Evaluation of Subjective Indicators for Medical Consumables Based on Fuzzy Group Decision-Making Methods
- Hospital Outpatient Drug Repercussion: Risks and Countermeasures
- Key Factors on Online Pharmacy Management Based on the Analytic Hierarchy Process in China
- Analysis of Factors Influencing per Capita Healthcare Expenses
-- Based on the Empirical Analysis of Principal Component Regression Model and Regression with ARMA Model - The Safety Monitoring System for Drug Clinical Trials
- Diagnostic Reagent Industry in China: SWOT Analysis and Countermeasures