Discrim ination of Five Citrus Diseased Leaves by FTIR Spectroscopy
Xingxiang ZHAO,Gang LIU,W eixing LI,Xiaohua W ang,Jianm ing HAO,Xiangping ZHOU
School of Physics and Electronic Information,Yunnan Normal University,Kunming650500,China
Citrus is belonging to Rutaceae family,which originates from a mutation of C.Aurantieae.Citrus is one of the major fruit products in the word.Citrus are suitable for planting in sunshine and rainfall areas in Asia,Africa and America.Flavonoid extracted from citrus fruits has been used in medicine and show many biological properties such as anti-viral,anti-cancer,anti-inflammatory,anti-atherogenicity and anti-thrombotic[1].However,the quantity and quality of fruit are affected by diseases during growing and after harvest,and the benefits of farmers are also influenced by the diseases.Moreover,many diseases can not be prevented and controlled so far[2].In fact,because the pathogens can not be detected rapidly and accurately,improper prevention methods and abusing chemicals not only pollute the environment but also go against the purpose of green,efficient and precision agriculture.Therefore,detection of citrus diseases correctly is very important to citrus production and customer.Serology,optical microscope and electron microscope have been used to detect citrus diseases,but these techniques have to go through series complex processes.In recent years,molecular techniques of citrus detection are polymerase chain reaction(PCR)based on specific deoxyribose nucleic acid(DNA)sequences of the pathogen,and enzyme-linked im-munosorbent assay(ELISA)based on proteins produced by the pathogen.The limitations of the molecular techniques are time-consuming,labor-intensive and elaborate[3-4].In recent years,spectroscopic and imaging techniques have been used to monitor citrus diseases with the advantage of speediness,accuracy and reliability.Fluorescence spectroscopy was employed to detect citrus disease stress caused by canker[5].Qin et al.[6]employed hyper spectral reflectance imaging combined with PCA to detect citrus canker.Visible-near infrared and thermal imaging techniques were selected to detect citrus huanglongbing[7].The near infrared spectral technology exhibit am ore merit on the aspect of citrus disease non-destructive detection.FTIR has become one of the most useful techniques applied in biochemistry for studying the second structure of protein,carbohydrates and lipids.FTIR spectroscopy is a practical tool for a large-scale,real-time disease monitoring under field conditions.Cardinali et al.[8]employed FTIR spectroscopy combined with partial least square regression(PLS)to distinguish citrus variegated chlorosis and huanglongbing.Mid-infrared(MIR)spectroscopy combined with quadratic discriminant analysis(QDA)and k-nearest neighbor(kNN)were also applied to identify huan-glongbing and healthy citrus leaves[9].Hawkins et al.[10]compared FTIR spectral differences between citrus huanglongbing and other diseases.Fan reported that carbohydrate levels in huanglongbing-infected leaves with symptoms increased 7.9-fold compared to healthy controls[11].Above reports focused on the discriminant analysis of citrus huanglongbing leaves.There were less reports using FTIR spectroscopy to detect citrus brown spot,canker,fuliginous and Cercospora sp.leaves.
In this paper,citrus brown spot,huanglongbing,canker,fuliginous,Cercospora sp.and healthy leaves were studied using FTIR combined with unsupervised pattern recognition.Huanglong-bing and canker were caused by bacteria,brown spot,fuliginous and Cercospora sp.were caused by fungus.
1 Materials and methods
1.1 SamplesBrown spot,huanglongbing,canker,fuliginous,Cercospora sp.and healthy Leaves were collected from citrus pon-kan in Yunnan of China.All infected trees considered had typical symptoms and were identified by qualified inspectors.The spot of diseased leaves and the corresponding part of health leaves was used for analysis.After grinding,the dried leaf powder was mixed with KBr and compressed into disc.
1.2 FTIR measurementFourier transform infrared spectra were recorded on solid samples in KBr pellet form by means of a Tensor27 FTIR spectrometer(Bruker,Germany)equipped with a deuterated triglycine sulfide(DTGS)detector in the region of 4000-400 cm-1.The FTIR measurements were recorded in transmission mode.Data collection was acquired with a 4 cm-1spectral resolution and 16 scans were accumulated each sample.A total of40 spectra were collected.
1.3 Dataset treatmentTo standardize data and reduce noise,the following operations were carried out:automatic baseline correction;normalization to the value1.0 in relation to the most intensive band.To increase the resolution of obtained spectra,first derivatives and second derivatives(Savitzky-Golay algorithm,5-point smoothing)were calculated.All operations on spectra were performed using original Omnic8.0 software and saved in CSV format,compatible with statistical software.Unsupervised multivariate statistical methods(HCA and PCA)were applied using the statistical packages of the SPSS16.0 software environment.
2 Results and analysis
2.1 Spectral characteristics of citrus leavesFig.1 showed the infrared spectra of citrus brown spot,huanglongbing,canker,fuliginous,Cercospora sp.and healthy leaves.As can be seen from the figure,their spectra are similar representing some functional groups of lipids and carbohydrates.The strongest broad band at about3 400 cm-1was attributed to O-H stretching and contribution of N-H stretching[12].The absorption bands in the 3 000-2 848 cm-1range were those assigned to asymmetric and symmetric methyl and methylene,the CH2 asymmetric stretching mode was positioned at around 2 917 cm-1,while its symmetric stretching modewas positioned at about 2 850 cm-1[13].The absorption band around 1 735 cm-1was correspond to C=O stretching vibration that mainly come from lipids.The mixed vibration absorption of cellulose,hemicellulose and lignin could be found clearly in the 1 700-1 500 cm-1range.The band around 1 610 cm-1was assigned to the C=O stretching vibration of lignin[14].
The absorption bands in the 1 500-1 200 cm-1region was that assigned to the overlapped vibration absorption of fatty acids and polysaccharide[10-11].The absorption band around 1 424 cm-1was assigned to the CH group from scissoring vibration.The peaks in the range of 1 440-1 317 cm-1mainly came from CH3 and CH2 symmetric bending vibration absorption in cellulose and lig-nin affected by oxygen and nitrogen atoms[14-15].The absorption bands in the1 200-700 cm-1region were contribution of polysaccharide and carbohydrate isomers,the peaks near 1 104 and 1 037 cm-1were C-O and C-C stretching vibration of carbohydrate(cellulose and hemicellulose).Moreover,strong and broad absorption bands at 1 148,1 105 and 1 037 cm-1were mainly from the contribution of C=O stretching vibration in cellulose.Moreover,the absorption intensity was stronger gradually.It was showed that the main constitution of citrus leaves was lipids,lignin and polysaccharide.
There were observed tiny differences between diseased and healthy spectra.The absorption peak of lignin of Cercospora sp.was at 1 610 cm-1,the other samples were shift to lower wave number at 1 606 cm-1.The absorption bands of fuliginous observed at2 926 and 2 850 cm-1was stronger than others.The band of healthy leaves at 1 516 cm-1was broad shoulder peak,while others were sharp peak.The strongest absorption intensity of polysaccharide contribution of huanglongbing and healthy leaves were positioned at1 047,1 037 cm-1,respectively.The absorption ratio A1047/A2917 of all huanglongbing samples were larger than 1.423,but the values of all healthy samples were less than 1.173,it suggested that huanglongbing leaves accumulated more carbohydrate than healthy leaves.The result agreed with the study of Fan et al.[11].The ratio A1047/A2917might be as a marker for detecting huanglongbing.

Fig.1 FTIR spectra of healthy and diseased leaves in the range of 4000-400 cm-1
2.2 The differences of second derivative spectraFor a good differentiation of the bands,the second derivative of the spectra was made.Commonly,the second derivatives of infrared spectra can obviously enhance the apparent resolution and amplify small differences in the infrared spectra.These were obtained with the Savitzky-Golay method(second-order polynomial with seven data points)using the Omnic8.0 software.The second derivative spectra of the samples were shown in Fig.2.Some common absorption bands were found at 1 740,1 515,and 1 231 cm-1.From the second derivative FTIR spectra,several differences could be observed.The absorption bands of healthy sample at 1 175,1 032,922 cm-1were stronger than that of the diseased samples.The intensity of the bands at 1 452,1 392 and 1 231 cm-1in brown spot,huanglongbing and canker samples increased comparison to healthy sample,while that of fuligi nous and ercospora sp.samples decreased comparison to healthy sample.The band of healthy sample at1031 cm-1was strong and sharp,but in diseased sample appeared as broad bands.The absorption peak at 1018 cm-1was found only in brown spot sample,while the others were at 1 032 and 1 013 cm-1.Absorption bands of all samples at 922 cm-1were strong except Cercospora sp sample.

Fig.1 Second derivative spectra of healthy and diseased leaves in the range of 1 500-700 cm-1
2.3 Correlation analysisThe dataset in the second derivative spectrum in the range of1 200-700 cm-1were selected to evaluate correlation coefficients.The results showed that the correlation coefficients were larger than 0.928 not only between the healthy leaves,but also between the same diseased leaves.However,correlation coefficients of different diseased leaves and healthy leaves were different.The correlation coefficients of brown spot and healthy leaves ranged from 0.650 to 0.885,while the values of huanglongbing and healthy leaves ranged from 0.850 to 0.915,the correlation coefficients of brown spot,canker and healthy leaves ranged from 0.661 to 0.818.By comparison,the correlation degree between fuliginous and healthy leaves was the lowest,which ranged only from 0.476 to 0.564.The correlation coefficients exhibited differences among different kinds of diseased leaves,which suggested that the biotic stress factor had changed the chemical composition or the relative content of each component in citrus leaves.
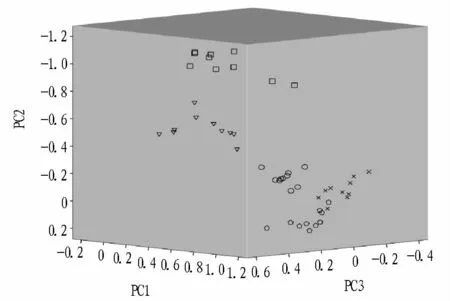
2.4 Principal Component AnalysisPrincipal Component Analysis(PCA)is an unsupervised pattern recognition and is often the first step of exploratory data analysis to detect groups in the measured data.PCA models the directions of maximum variations in a data set by projecting as a swarm of points in a space defined by principal components(PCs).The performance of the overall accuracy of PCA on original and first derivative dataset was60%,87.5%,respectively.Fig.3 showed the PCA performed on the second derivative spectra in the range of 1 200-700 cm-1of all samples that constituted six perfectly distinct groups.The score plots were projected in three-dimensional space.The first three PCs explained respectively 80%,8%and 4%of the spectral variance.In the light of this PCA overview(92%of the spectral variance was explained with only 3 PCs),a good classification of citrus leaves was expected.The samples belonging to brown spot,huanglongbing,canker,fuliginous,and Cercospora sp groups were very close to each other,while the healthy samples had a large dispersion.As a whole,PCA results showed that the highest differentiation was between Cercospora sp and healthy leaves,the lowest between canker and huanglongbing.As seen from Fig.3,all samples were classified into six groups with 92.5%accuracy.

Fig.3 PCA scores plots of healthy and diseased leaves on the second derivative spectra in the range of 1 200-700 cm-1
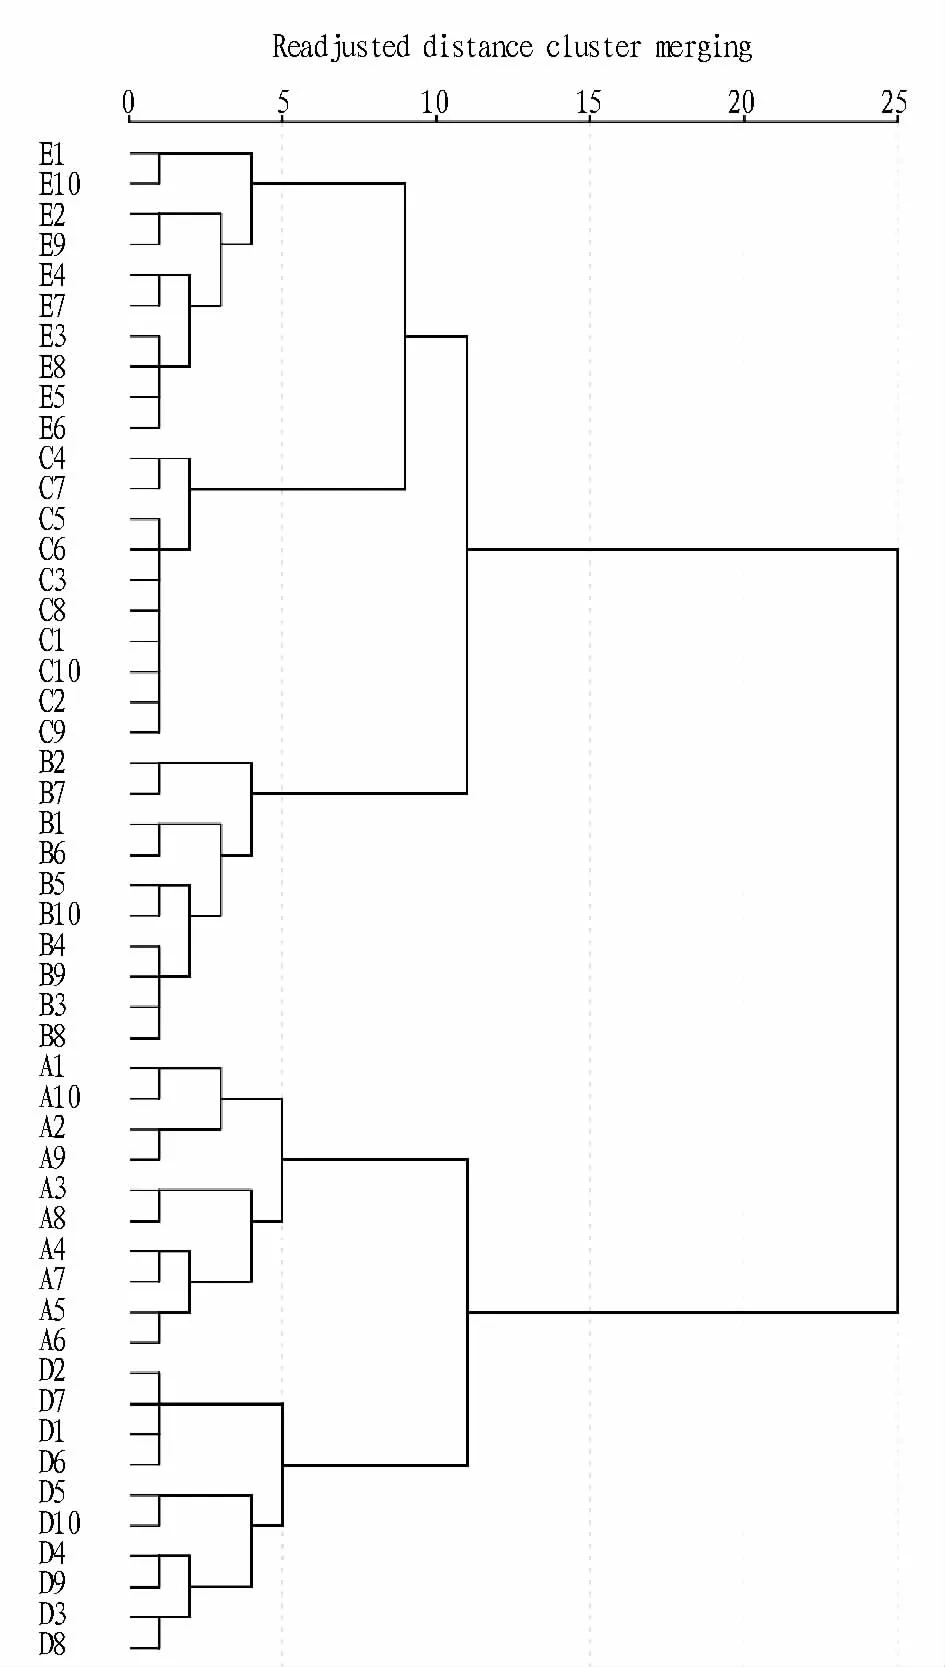
2.5 Cluster analysisCluster analysis was performed using Pearson's product moment correlation coefficient as a measure of similarity between the spectra,and Ward's algorithm to draw the dendrogram.Cluster analysis turned out to be a very useful tool for differentiating citrus diseases,as it revealed relationships among their FTIR spectra.Cluster analysis was evaluated in the first and second derivatives spectra respectively in 1 200-700 cm-1range.The results showed the accuracy of HCA by selecting the original and the first derivative dataset was 52.5%,80%,respectively.The best results were obtained in the case of the second derivative dataset(Fig.4).Sixmajor clusters were formed.Each of the citrus diseased and healthy leaves examined in the study formed a separate group.The shortest distances between spectra of citrus leaves were recorded within fuliginous and Cercospora sp,which indicate their highest similarity(highest homogeneity).These groups also showed the closest correlation.The most isolated clusters were formed by healthy leaves,which showed the lowest correlation with the other groups.However,b1,b3,c3 and a5 could not be classified correctly belonging to their groups,the accuracy of HCA was90%.

Fig.4 Dendrogram from hierarchical cluster analysis results of healthy and diseased leaves on the second derivative spectra in the range of 1 200-700 cm-1
3 Conclusions
Citrus diseased and healthy leaves were explored using Fourier transform infrared spectroscopy combined with multivariate statistical analysis.The correlative coefficients of the second derivative dataset were obviously different,which showed biotic stress had changed the chemical composition and relative content of components.The citrus diseased and healthy leaves could be classified correctly using the principal component analysis and hierarchical cluster analysis by selecting the second derivative spectra in the region of 1 200-700 cm-1.The results showed that FTIR technique was used to detect citrus diseases with rapid,non-destructive,feasible and accurate advantages.Future studies would involve the evaluation of this technique for detecting non-symptomatic citrus diseased leaves infected by microorganism.The ability of FTIR spectroscopy to show the changes in the chemistry of the plant before visible symptoms in many of the samples,along with its ease of use,speed,and relative cost,could lead to its increased use as a predictive method in the future.
[1]BARRECA D,BELLOCCO E,GATTUSO G,et al.Polyphenol composition,vitamin C content and antioxidant capacity of Mauritian citrus fruit pulps[J].Food Chemistry,2011(129):1504-1512.
[2]EHSANIR,MISHRA A,SANKARAN S,etal.A review of advanced techniques for detecting plant diseases[J].Computers and Electronics in Agriculture,2010(72):1-13.
[3]LIWB,LEVY L,HARTUNG JS.Quantitative distribution of‘Candidatus Liberibacter asiaticus'in citrus plants with citrus Huanglongbing[J].Bacteriology,2009(99):139-144.
[4]TEIXEIRA DC,SAILLARDC,COUTUREC,et al.Distribution and quantification of Candidatus Liberibacter americanus,agent of huanglongbing disease of citrus in So Paulo State,Brasil,in leaves of an affected sweetorange tree as determined by PCR[J].Molecular and Cellular Probes,2008(22):139-150.
[5]LINSEC,BELASQUE JJ,MARCASSA LG.Detection of citrus canker in citrus plants using laser induced fluorescence spectroscopy[J].Applied Optics,2008(47):1922-1926.
[6]QIN JW,BURKSTF,KIM MS,et al.Citrus canker detection using hyper spectral reflectance imaging and PCA-based image classification method[J].Sensor and Instrument Food Quality,2008(2):168-177.
[7]SANKARAN S,MAJA JM,BUCHANON S,et al.Huanglongbing(citrus greening)detection using visible,near Infrared and Thermal Imaging Techniques,Sensors,2013(13):2117-2130.
[8]CARDINALIMCDB,BOASA PRV,MILORIDMBP,et al.Infrared spectroscopy:A potential tool in huanglongbing and citrus variegated chlorosis diagnosis[J].Talanta,2012(91):1-6.
[9]SANKARAN S,EHSANIR,ETXEBERRIA E.Mid-infrared spectroscopy for detection of Huanglongbing(greening)in citrus leaves[J].Talanta,2010(83):574-581.
[10]HAWKINSSA,PARK B,POOLEGH,etal.Comparison of FTIR spectra between Huanglongbing(Citrus greening)and other citrus maladies[J].Journal of Agriculture and Food Chemistry,2010(58):6007-6010.
[11]FAN J,CHENC,BRLANSKY RH,etal.Changes in carbohydrate metabolism in Citrus sin en sis infected with‘Candidatus Liberibacter asiaticus’[J].Plant Pathology,2010(59):1037-1043.
[12]GORGULU ST,DOGAN M,SEVERAN F.The Characterization and Differentiation of Higher Plants by Fourier Transform Infrared Spectroscopy[J].Applied Spectroscopy,2007(61):300-308.
[13]MONTIF,ANNA RD,SANSON A,etal.A multivariate statistical analysis approach to highlight molecular processes in plant cell walls through ATR FT-IR microspectroscopy:The role of theα-expansin PhEXPA1 in Petunia hybrida[J].Vibrational Spectroscopy,2013(65):36-43.
[14]ALLISONll GG,MORRIKSC,HODGSON E,et al.Measurement of key compositional parameters in two species of energy grass by Fourier transform infrared spectroscopy[J].Bioresource Technology,2009(100):6428-6433.
[15]YANG HP,YAN R,CHEN HP,et al.Characteristics of hemicellulose,cellulose and lignin pyrolysis[J].Fuel,2007(86):1781-1788.
 Asian Agricultural Research2014年1期
- Asian Agricultural Research的其它文章
- Research on the Peanut Leaf Etiolation Prevention and Film M ulching Effect in Hubei Province
- Reasons for Reverse Flow of Expired Foods and Discussions on Solutions
- Research of the Socio-economic Development in Dalian Chengshantou Nature Reserve
- Research on the Eco-tourism and Environment-friend ly Land Use Patterns in Shangri-La
- Comprehensive Grain Potential Regionalization Study Based on the Farm land Grading Results
- The Evaluation Princip les,Indicator System and Methods for Environment-friendly Utilization of County-level Land Resources
