Genotype × environment interaction effects on early fresh storage root yield and related traits in cassava
Roooni Tumuhimise*,Ro Melis,Pul Shnhn,Roert Kwuki
aAfrican Centre for Crop Improvement,School of Agricultural,Earth and Environmental Sciences,University of KwaZulu-Natal,Private Bag X01,Scottsville,3209 Pietermaritzburg,South Africa
bNational Crops Resources Research Institute,National Agricultural Research Organisation,P.O.Box 7084,Kampala,Uganda
1.Introduction
Cassava (Manihot esculenta Crantz) is one of the most important food crops worldwide.It is a storage root crop grown by most smallholder farmers partly because of its flexibility in harvesting time and ability to perform well in drought-prone and marginal areas under poor management,where other crops fail [1].Despite these advantages,cassava presents substantial differential genotypic responses under varying environmental conditions,a phenomenon termed genotype ×environment interaction(GEI)[1].GEI is a routine occurrence in plant breeding programmes[2].GEI and yield-stability analyses have accordingly become increasingly important for measuring cultivar stability and suitability for cultivation across seasons and ecological zones [3].An understanding of GEI can be helpful in identifying ideal test conditions and in formulating recommendations for areas of optional genotype adaptation.Multi-environment trials have been found to be essential in plant breeding for studying cultivar stability and predicting yield performance of cultivars across environments[4].
The phenotypic expression of an individual is determined by both genotype and environment effects[5].These two effects are not always additive,because of GEI.A GEI results from changes in the magnitude of differences between genotypes in different environments or from changes in the relative ranking of the genotypes[6].It presents limitations in the selection of superior genotypes,and thereby reduces the utility of analyses of means and of inferences that would otherwise be valid [7].To account for GEI effects,breeders evaluate genotypes in several environments in order to identify those with high and stable performance.Genotypes with insignificant GEI are considered to be stable[8].
Stability analysis methods are divided into two main groups:univariate and multivariate [9].Among multivariate methods,the additive main effects and multiplicative interaction(AMMI)analysis is widely used for GEI assessment.This method has been shown to be effective because it captures a large portion of the GEI sum of squares [6].It clearly separates main and interaction effects depending on their statistical significance and presents plant breeders with different kinds of selection opportunities,and the model often provides meaningful interpretation of agronomic data[7].The AMMI analysis is useful in informing important decisions in breeding programmes,such as which genotypes exhibit specific adaptation and the selection of testing environments[6].This is particularly important for new breeding programmes that have not yet optimised their respective genotype testing networks.The results of an AMMI analysis are often presented in a biplot,which displays both the genotype and environment values and their relationships using the singular vector technique [7].Such information,especially on GEI and associated stability,is important in selecting earlyyielding cassava genotypes with improved adaptation to the abiotic stresses that prevail in target environments[10,11].
Selection of early-yielding cassava genotypes has become important in the national cassava breeding programmes in Africa as a result of increasing demand for such genotypes by farmers[10,12,13].They are considered to be important in situations where mounting pressure on land for urban and industrial development compels farmers to intensify production,and in semi-arid regions,where early-yielding genotypes can be harvested after only one cycle of rain[12].Wholey and Cock[14]have proposed that one way of improving the efficiency of cassava production in terms of fresh storage root yield (FSRY) per unit time is by selecting early-yielding genotypes with shortened growth periods.Previous research has shown that early-yielding cassava genotypes are harvested at ≤12 months after planting(MAP) [10,12,15].For the purpose of this study the performance and stability of the genotypes were evaluated for FSRY,defined as early FSRY,and related traits at 9 MAP.In that context,this study was conducted to assess the effect of genotype,environment and GEI on early FSRY and related traits and also to identify stable genotypes for early FSRY and related traits.
2.Materials and methods
2.1.Experimental sites
Trials were conducted at three diverse locations in Uganda: at Namulonge and Jinja National Agricultural Research Institutes and at Nakasongola on private farmland.Namulonge is located at 32°36′E and 0°31′47″N,1134 meters above sea level(m.a.s.l.);Jinja is located at 33°11′E and 0°27′N,1173 m.a.s.l.and Nakasongola is located at 32°27′ E and 1°18′ N,1091 m.a.s.l.From planting to harvesting,mean rainfall and temperature range were respectively 1121 mm and 16.7–28.7 °C at Namulonge,1095 mm and 17.3–29.2 °C at Jinja,and 424 mm and 18.5–29.4 °C at Nakasongola.

Table 1-Cassava genotypes evaluated at three locations and harvested at nine months after planting in Uganda.
2.2.Experimental germplasm
Twelve genotypes(Table 1)were sourced from farmers'fields and from the National Cassava Breeding Programme(NCBP)at the National Crops Resources Research Institute,Namulonge.Genotypes from farmers' fields were landraces,while genotypes from the NCBP were introductions from the International Institute of Tropical Agriculture (IITA) and genotypes developed by crossing cassava lines from the International Centre for Tropical Agriculture(CIAT)with lines from Uganda.Selection of the genotypes was based on their performance for storage root yield,early bulking and relative degrees of field resistance to two diseases prevalent in Uganda: cassava brown streak disease (CBSD) and cassava mosaic disease(CMD).
2.3.Experimental design
The trial at each location was laid out in a randomised complete block design with three replications.Healthy stem cuttings each 25 cm in length were horizontally planted in a flat seedbed at a spacing of 1 m × 1 m giving a population density of 10,000 plants ha-1.Each plot measured 2 m × 6 m,comprising 3 rows of 6 plants each.The first and last rows and the first and last plant within the middle row of each plot were considered as border plants.The plots and blocks were separated by 2.0 m and 2.5 m alleys,to reduce inter-plot and inter-block plant competition,respectively.The trials were conducted without supplemental irrigation and weeded regularly.
2.4.Data collection
Data for the following traits were collected from a net plot of four randomly selected and hand-uprooted plants of each genotype: storage root number (SRN); storage root mass(SRM); FSRY and cassava brown streak disease root necrosis(CBSD-RN).Cassava mosaic disease severity (CMD-S) was assessed during the crop growth at 6 MAP on an increasing scale of 1–5,where: 1 = no symptoms; and 5 = severe mosaic symptoms [16].Storage roots of the four plants were bulked,counted and weighed to obtain SRN and SRM(kg),respectively.The FSRY (t ha-1) per genotype was then estimated from the SRM of the four-plant bulk of storage roots as:

Storage root necrosis due to CBSD (CBSD-RN) was scored on an increasing scale of 1 to 5 where 1 = no visible necrosis,and 5 = severe necrosis[17].
2.5.Data analysis
The data for each location were first analysed independently and then the error variances for the environments were tested for homogeneity using Hartley's Fmaxtest[18].The differences were non-significant,and accordingly an unweighted combined AMMI analysis of variance was conducted across the locations.Correlations among various plant parameters were calculated as Spearman correlation coefficients[19].The AMMI analysis of variance(ANOVA)was performed using the following model:

where: Yij= observed yield of genotypes; μ = grand mean;gi= genotypic main effect; ej= environmental main effect;N = number of PCA axes considered;λn= singular value of the nth PCA axis; αin= scores for the ith genotype on the nth axis; γjn= scores for the jth environment on the nth axis;ρge= residual for IPCAs not fitted;and εij= error term.
Because the Interaction Principal Component Axis 2(IPCA2)mean squares(MS)were non-significant in the AMMI analysis for all traits,the AMMI1 model was adopted and biplots of the IPCA1 scores versus the genotype and environment means were presented for each trait [3,20].The biplots were used to assess the performance and interaction patterns of the genotypes and environments.Based on the biplots,genotypes with broad or specific adaptation to target agro-ecologies or environments for the traits evaluated were identified.
Stability of performance across locations is not the only factor for selection,as the most stable genotypes do not necessarily give the best performance for the traits of interest.Farshadfar [20] developed the genotype selection index (GSI)which simultaneously selects for performance and stability.The GSI for each genotype is calculated as the sum of the corresponding rankings for mean performance and the AMMI stability value (ASV).The ASV is a measure of the stability of a genotype (the lower the value the greater the stability) based on weighted IPCA1 and IPCA2 scores [21].However,given that the IPCA2 axis was non-significant for all the traits in this study,the GSI was modified,with ranking based on ASV replaced by ranking based on IPCA1 scores only as follows:
GSIi=RIPCA1i+RYi;
GSIigenotype stability index for the ith genotype across locations for each trait;
RIPCA1irank of the ith genotype across environments based on IPCA1;and
RYirank of the ith genotype based on mean performance across locations.
A genotype with the lowest GSI for a given trait was considered to have the highest combined performance and stability [20,22].
3.Results
3.1.Variation in traits in response to genotypes and locations
In the combined AMMI ANOVA,the genotype MS were highly significant(P <0.001)for all the traits evaluated(Table 2).The MS for locations were highly significant (P <0.001) for SRN;very significant (P <0.01) for early FSRY; and significant(P <0.05)for CMD-S.Genotype × environment MS were highly significant (P <0.001) for SRN; very significant (P <0.01) for CBSD-RN and CMD-S.
The IPCA1 MS were highly significant (P <0.001) for SRN;and significant (P <0.05)for CBSD-RN and CMD-S.Early FSRY had non-significant IPCA1 MS (in association with a nonsignificant GEI) while the IPCA2 MS were non-significant for all traits.It was evident from the AMMI analysis that the %treatment SS attributed to genotypes was higher than that attributed to environments or to GEI for all the traits evaluated (Table 2).For example,for early FSRY,48.5% of the treatment sum of squares (SS) was attributed to genotypes,27.3%to locations and 24.1%to GEI,and 0.1%to IPCA residual.Although the GEI was non-significant for the trait,it is interesting to note that the IPCA1 and IPCA2 captured 72.4%and 27.6% of the GEI SS,respectively.Unlike for early FSRY,the % treatment SS attributed to GEI was higher than that to environments for CBSD-RN and CMD-S.For FSRY,CBSD-RN and CMD-S,the % GEI SS attributed to IPCA1 was more than twice that attributed to IPCA2.
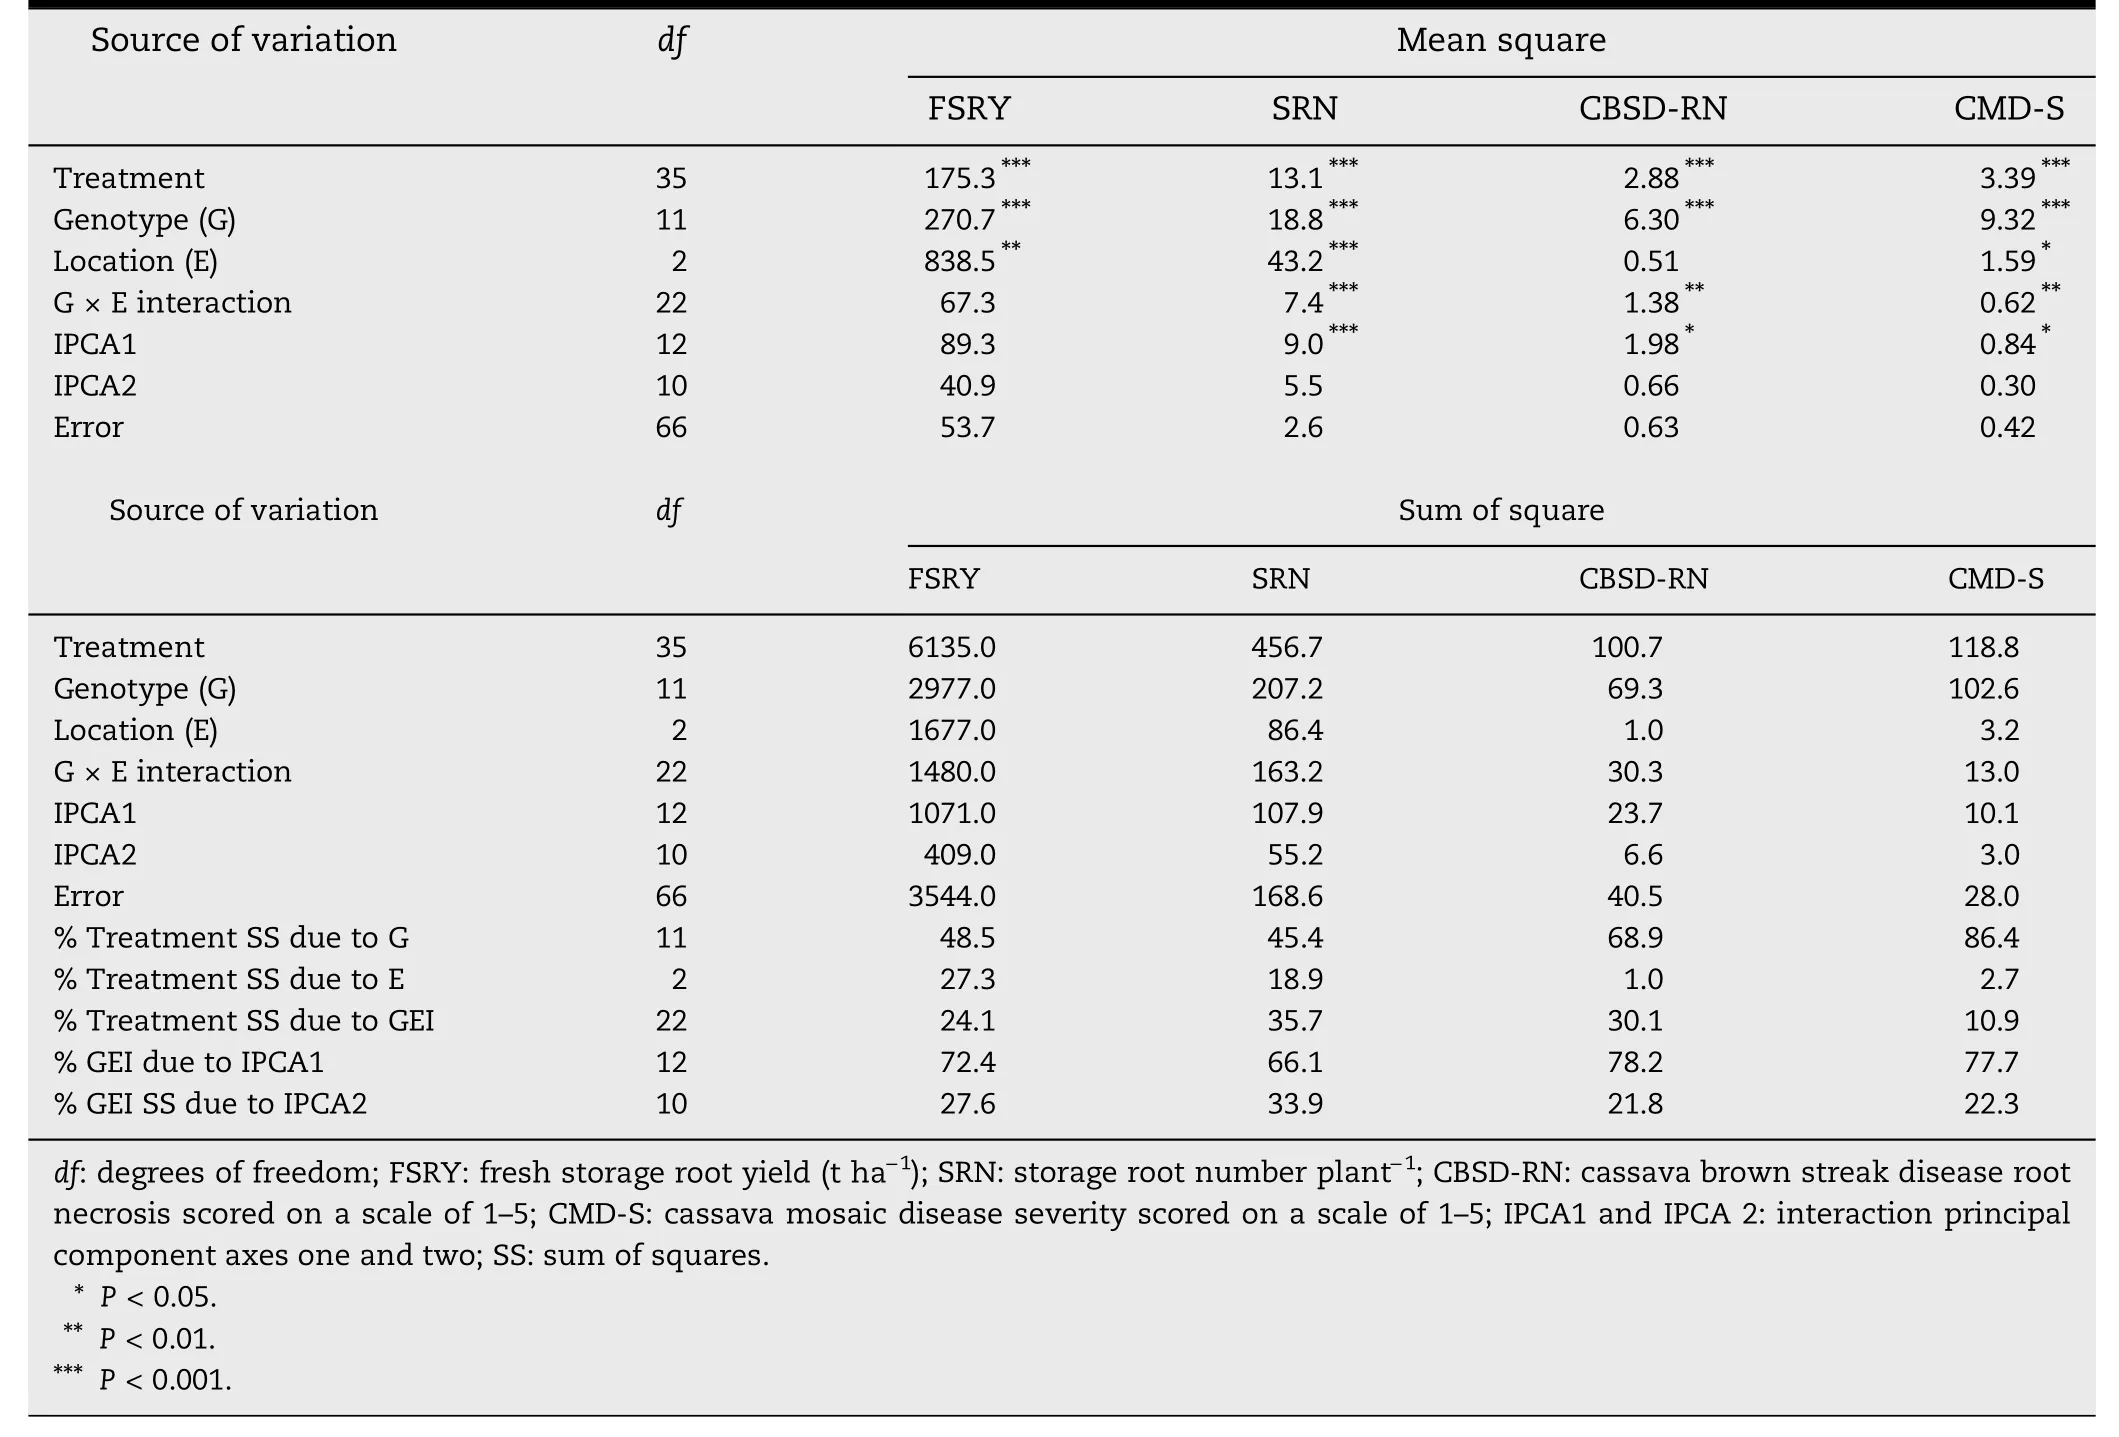
Table 2-AMMI analysis of 12 cassava genotypes evaluated at nine months after planting across three locations in Uganda for early fresh storage root yield and related traits.
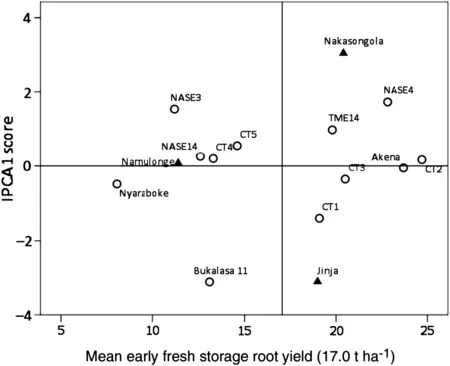
Fig.1-Biplot of mean early fresh storage root yield and IPCA1 scores for 12 cassava genotypes evaluated nine months after planting at three locations in Uganda.
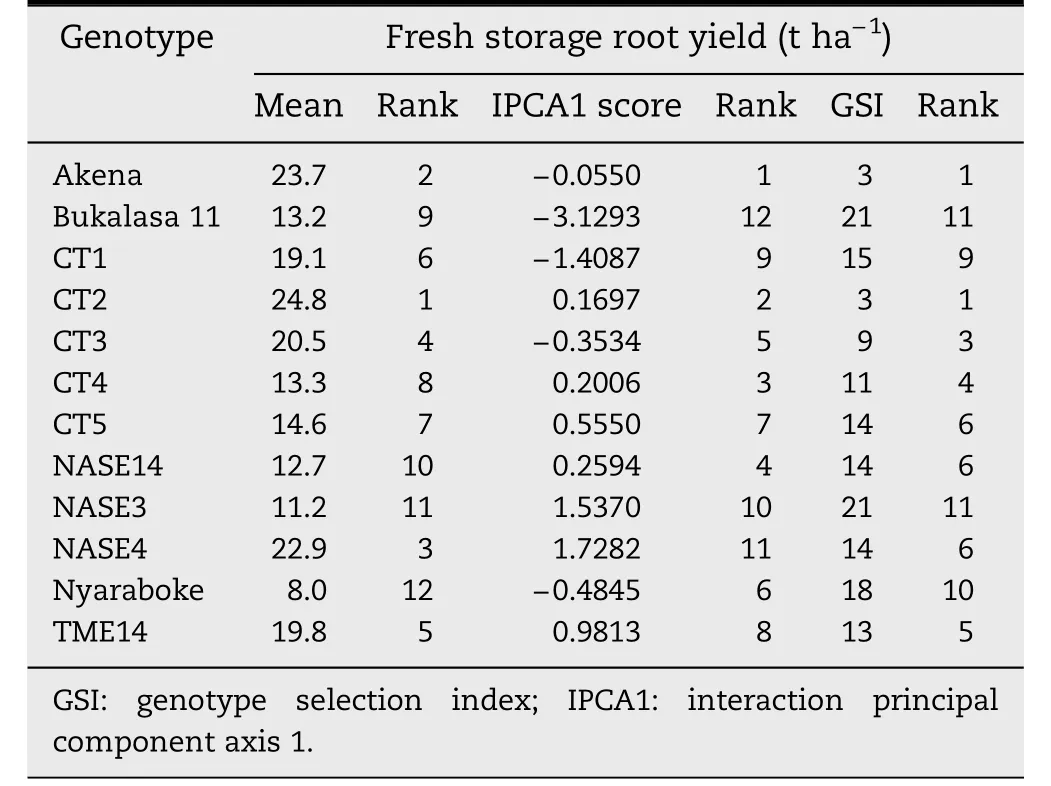
Table 3-Ranking of 12 cassava genotypes by mean performance,IPCA1 scores and genotype selection index for fresh storage root yield evaluated nine months after planting across three locations in Uganda.

Table 4-Ranking of 12 cassava genotypes by mean performance,IPCA1 scores and genotype selection index for storage root number evaluated nine months after planting across three locations in Uganda.
3.2.Mean performance and genotype × location interaction effects for traits across locations
Since the IPCA2 for all four traits was non-significant,the AMMI1 model was adopted and for each trait,the genotype and location IPCA1 scores were plotted against the mean performances of the genotypes and locations.A genotype or location with high IPCA1 scores(negative or positive)indicated high interaction and was considered to be unstable across the respective locations or genotypes,while a genotype or location with low IPCA1 scores near zero indicated low interaction and was considered to be stable.
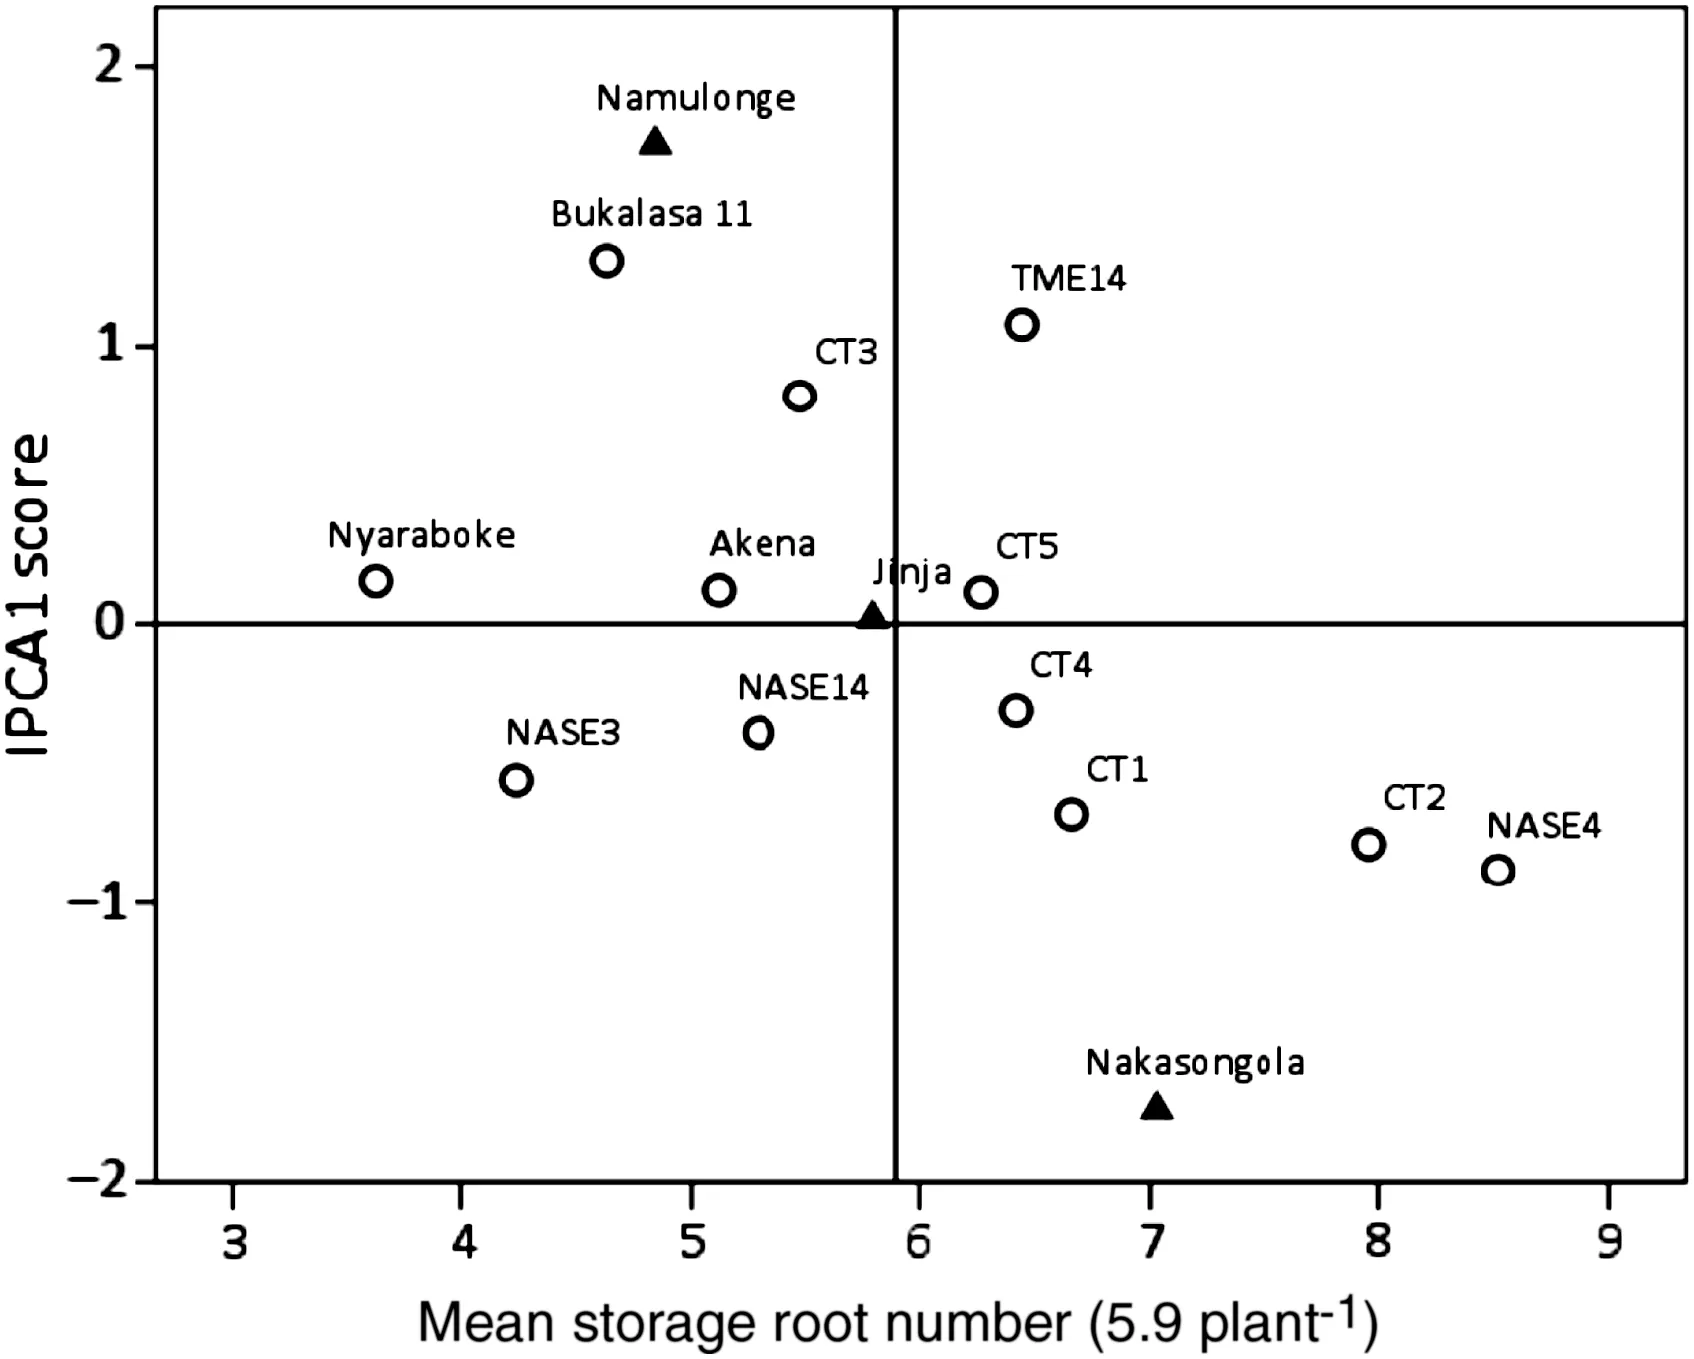
Fig.2-Biplot of mean storage root number and IPCA1 scores for 12 cassava genotypes evaluated nine months after planting at three locations in Uganda.
3.2.1.Early fresh storage root yield
Even though the GEI and associated IPCA1 were non-significant for early FSRY,the apparent performance and interaction patterns were presented in an AMMI1 biplot,given that early FSRY was the focus of this research.Genotypes Akena,CT2,CT4 and NASE14 had low IPCA1 scores for early FSRY and were accordingly the most stable genotypes for this trait (Fig.1).NASE4,NASE3 and CT1 were the least stable,in view of their large IPCA1 scores.Grouping of genotypes according to their mean early FSRY indicated that CT2 was the highest early FSRY performer,followed by Akena,NASE4,and CT3 while Nyaraboke,followed by NASE3,NASE14 and Bukalasa 11 were the lowest early FSRY performers.Ranking of genotypes based on GSI,which incorporates both the IPCA1 and mean performance rankings,identified Akena and CT2 as the best genotypes combining high early FSRY and stability (Table 3).Considering IPCA1 scores alone,67%of the genotypes had IPCA1 scores less than unity,implying that a majority of the genotypes were stable for early FSRY.Namulonge had no interaction effects for this trait with genotypes,indicated by negligible IPCA1 scores.Nakasongola and Jinja had high contrasting interaction effects for early FSRY with genotypes,indicated by high contrasting IPCA1 scores.Nakasongola,though unstable,was the best location for early FSRY,followed by Jinja.

Fig.3-Biplot of mean cassava brown streak disease root necrosis scores(scale of 1-5)and IPCA1 scores for 12 cassava genotypes evaluated nine months after planting at three locations in Uganda.
3.2.2.Storage root number
For SRN,CT5,Akena,Nyaraboke and CT4 had low IPCA1 scores and were the most stable genotypes,whereas Bukalasa 11,TME14,NASE4 and CT3 were the least stable considering their large IPCA1 scores (Fig.2).NASE4 had the highest SRN,followed by CT2,CT1 and TME14.Nyaraboke,followed by NASE3,Bukalasa 11 and Akena had the lowest SRN.With the lowest GSI ranking,CT5 was the overall best genotype combining high SRN and stability,followed by CT4,CT1 and CT2 (Table 4).Jinja showed effectively no interaction with genotype,as indicated by its negligible IPCA1 score,and was considered the most stable location across the genotypes for the trait.As evidenced by their high IPCA1 scores of opposite sign,Namulonge and Jinja showed high and contrasting interactions with genotype.
3.2.3.Cassava brown streak disease root necrosis
Jinja showed relatively low interaction effects with genotype for CBSD-RN,while Namulonge and Nakasongola showed relatively high contrasting interaction effects for the trait(Fig.3).Thus Jinja was relatively stable for CBSD-RN.The most stable genotype for CBSD-RN was TME14,followed by NASE14,CT4 and Akena in that order.The least stable genotypes for the trait were CT5,CT2,NASE3 and CT1.In terms of the mean CBSD-RN scores,the best genotypes were NASE4,NASE3,Nyaraboke and Bukalasa11 and the worst were Akena,CT2,NASE14 and CT5.The GSI ranked TME14 and NASE4 as best genotypes,combining low CBSD-RN and high stability,followed by Bukalasa 11 and Nyaraboke with the same rank of 3 (Table 5).
3.2.4.Cassava mosaic disease severity
The majority of the genotypes were relatively stable for CMD-S,but Bukalasa 11 and Nyaraboke were highly unstable(Fig.4).The most stable genotypes for this trait were Akena,CT3,NASE14,CT1 and NASE4.Nakasongola was the most stable location for CMD-S,considering its low IPCA1 score.With high IPCA1 scores of opposite sign,Namulonge and Jinja had very high contrasting interactions with the genotypes.With GSI rankings of 1 the overall best genotypes combining low CMD-S and high stability were NASE14,TME14 and CT3,followed by Akena with a rank of 4 (Table 6).

Table 5-Ranking of 12 cassava genotypes by mean performance,IPCA1 scores and genotype selection index for cassava brown streak root necrosis evaluated nine months after planting across three locations in Uganda.

Fig.4-Biplot of mean cassava mosaic severity scores(scale of 1-5)and IPCA1 scores for 12 cassava genotypes evaluated six months after planting at three locations in Uganda.
3.3.Phenotypic correlations among storage root yield and disease traits
Early FSRY was positively and highly significantly (P <0.001)correlated with SRN,but negatively and highly significantly(P <0.001) correlated with CMD-S (Table 7).The correlation between early FSRY and CBSD-RN was negative and nonsignificant.Storage root number had a negative and highly significant (P <0.001) correlation with CMD-S and nonsignificant correlation with CBSD-RN.The correlation between CMD-S and CBSD-RN was negative,but non-significant.
4.Discussion
Genotype effects were significantly different for early FSRY and all other traits,indicating significant variation in the performance of the genotypes for early FSRY and the other traits assessed.This variation,in turn,indicated that the genotypes used in this study constituted a pool of germplasm with sufficient genetic variation and that by selecting and hybridising among the constituent genotypes,good progress in the improvement of cassava for early FSRY and related traits should be achieved.Location effects were also significantly different for all traits except CBSD-RN,indicating that the overall mean performances of the genotypes in each location were significantly different for most traits.This variation underlines the need to conduct multi-locational trials in order to identify both generally and specifically adapted genotypes with good performance for the traits.Significant location effects for early FSRY,SRN and CMD-S have been similarly reported elsewhere [23,24].The significant genotype × location interaction effects for SRN,CBSD-RN and CMD-S again indicates a need to test genotypes in multi-location trials in order to identify generally and specifically adapted genotypes.
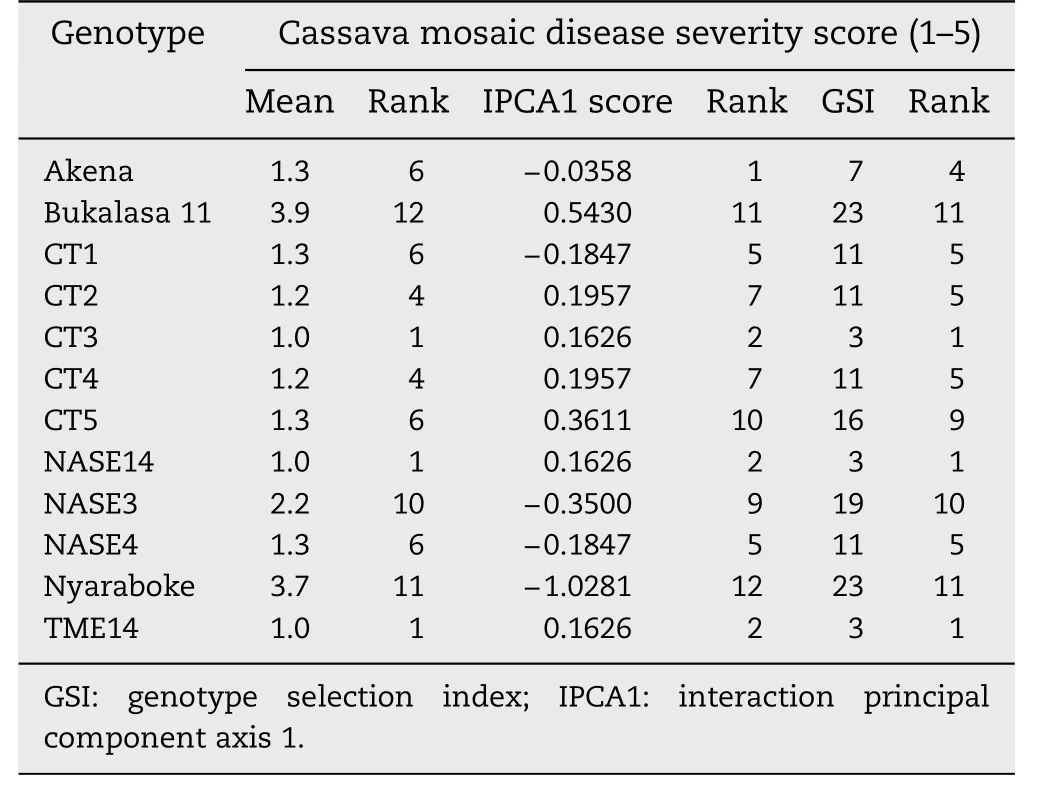
Table 6-Ranking of 12 cassava genotypes by mean performance,IPCA1 scores and genotype selection index for cassava mosaic disease severity evaluated six months after planting across three locations in Uganda.
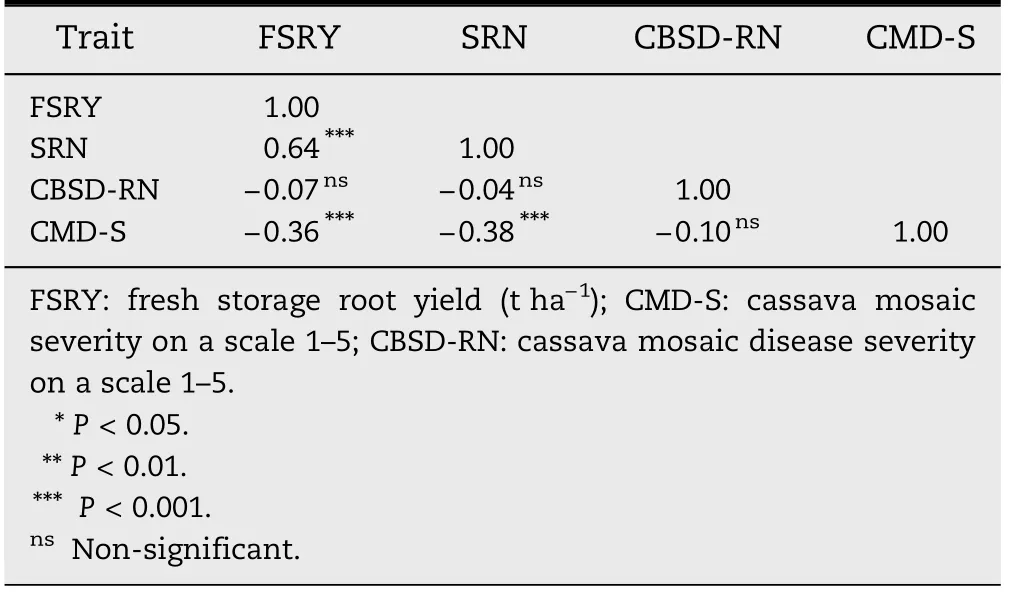
Table 7-Spearman correlation coefficients among four traits for 12 cassava genotypes evaluated at nine months after planting across three locations in Uganda.
Genotype and location effects were highly significant for FSRY,whereas GEI interaction effects were non-significant.This indicated that the response patterns of the genotypes to change in location were non-significantly different,so that the genotypes could be evaluated in terms of their significantly different performances for FSRY at 9 MAP averaged across the three locations.Although the GEI was nonsignificant,it was interesting that in the AMMI ANOVA for FSRY,48.5% of the treatment SS was attributed to genotypes,27.3%to environment and 24.1%to GEI.For all the other traits,genotypes also contributed the greatest percentage of the treatment SS,signifying the predominance of genetic variation among genotypes over variation among the locations and variation due to the interaction between genotypes and locations for all the traits studied.Again,the relatively high variation in the genotypes implies that prospects are good for developing cassava genotypes with improved performance for these traits,with the caveat that the genotypes will present differential responses to production environments that are similar to those evaluated in this study.
In the AMMI ANOVA,IPCA1 accounted for over 50.0%of the GEI%SS in all the traits studied and was also significant for all traits except early FSRY.Subsequently fitted IPCAs contributed less than 50.0% of the GEI SS and were non-significant,indicating that they captured largely random noise.In agreement with this finding,Gauch [7] reported that significant IPCA1 and subsequent axes in AMMI capture interaction exclusively in a monotonic sequence that decreases from the first and largest component to the last and smallest component.Thus the significant IPCA1 scores sufficed for visual assessment of the genotype and location performances and their interactions in the AMMI1 biplots.
Based on AMMI biplots and associated IPCA1 scores,the IITA introductions (Akena,NASE3,NASE4,NASE14 and TME14) and the genotypes developed by hybridising the CIAT and Ugandan germplasm (CT1,CT2,CT3,CT4 and CT5)were the most responsive to location effects.They represented either the best or the poorest performers in locations,corresponding to their placement nearer to or farther from the IPCA1 origin.Nevertheless,different genotypes emerged as the best in different locations.For example,the most stable genotype for early FSRY were Akena,CT2,CT4 and NASE14;for SRN,Akena,Nyaraboke,CT4 and NASE14; for CBSD-RN,CT5,CT2,NASE3,and CT1; and for CMD-S,Akena,CT3,NASE14,CT1 and NASE4.
As would be expected,there was an inverse relationship between early FSRY and both CMD-S and CBSD-RN,as indicated by the negative correlations between them.Namulonge had the lowest early FSRY compared to Nakasongola and Jinja,a result that could be attributed to the high scores for CMD-S and CBSD-RN recorded at Namulonge.Namulonge is in fact well known as a hot spot for both the CMD and CBSD causal viruses,as well as for whiteflies(Bemisia tabaci),which are vectors of both diseases[25].
In conclusion,there was a high degree of genetic variation among genotypes compared to the variation due to location differences and GEI for all traits studied.The GEI was non-significant for early FSRY,indicating that the genotypes had non-significantly different patterns of response to change in location and could be evaluated in terms of their mean response over locations.However,although for FSRY genotypes did not significantly interact with locations,there were apparent changes in rank of the genotypes at each location.The study results suggest that it is possible to make progress in breeding and selection for early storage root yielding cassava genotypes with resistance to CBSD and CMD.However,the presence of significant GEI for all the traits studied except FSRY will complicate selection for early storage root yield genotypes with resistance to CBSD and CMD.
Acknowledgements
The study was carried out with funds from the Alliance for a Green Revolution in Africa through the African Centre for Crop Improvement.We are grateful to the people that were involved in this research.
[1] C.N.Egesi,P.Ilona,F.O.Ogbe,M.Akoroda,A.Dixon,Genetic variation and genotype × environment interaction for yield and other agronomic traits in cassava in Nigeria,Agron.J.99(2007) 1137–1142.
[2] M.S.Kang,Using genotype-by-environment interaction for crop cultivar development,Adv.Agron.62(1998) 199–252.
[3] J.M.K.Mulema,E.Adipala,O.M.Olanya,W.Wagoire,Yield stability analysis of late blight resistant potato selections,Exp.Agric.44(2008) 145–155.
[4] M.O.Osiru,O.M.Olanya,E.Adipala,R.Kapinga,B.Lemaga,Yield stability analysis of Ipomoea batatus L.cultivars in diverse environments,Aust.J.Crop.Sci.3(2009) 213–220.
[5] D.S.Falconer,T.F.C.Mackay,Introduction to Quantitative Genetics,Fourth edition Longman,New York,1996.132–133.
[6] J.S.Ebdon,H.G.Gauch,Additive main effects and multiplicative interaction analysis of national turfgrass performance trials,Crop Sci.42 (2002) 497–506.
[7] H.G.Gauch,Statistical analysis of yield trials by AMMI and GGE,Crop Sci.46(2006) 1488–1500.
[8] G.Ssemakula,A.Dixon,Genotype × environment interaction,stability and agronomic performance of carotenoid-rich cassava clones,Sci.Res.Essays 2(2007)390–399.
[9] C.S.Lin,M.R.Binns,L.P.Lefkovitch,Stability analysis: where do we stand? Crop Sci.26(1986) 894–900.
[10] R.U.Okechukwu,A.G.O.Dixon,Performance of improved cassava genotypes for early bulking,disease resistance,and culinary qualities in an inland valley ecosystem,Agron.J.101(2009) 1258–1265.
[11] G.Suja,K.S.John,J.Sreekumar,T.Srinivas,Short-duration cassava genotypes for crop diversification in the humid tropics: growth dynamics,biomass,yield and quality,J.Sci.Food Agric.90(2009) 188–198.
[12] J.Kamau,R.Melis,M.Laing,J.Derera,P.Shanahan,C.Eliud,K.Ngugi,Farmers' participatory selection for early bulking cassava genotypes in semi-arid Eastern Kenya,J.Plant Breed.Crop Sci.3 (2011) 44–52.
[13] R.Tumuhimbise,R.Melis,P.Shanahan,R.Kawuki,Farmers'perceptions on early storage root bulking in cassava(Manihot esculenta Crantz) in east and central Uganda and their implication for cassava breeding,World J.Agric.Sci.8(2012) 403–408.
[14] D.W.Wholey,J.H.Cock,Onset and rate of root bulking in cassava,Exp.Agric.10 (1974) 193–198.
[15] G.Amenorpe,H.M.Amoatey,A.Darkwa,G.K.Banini,V.W.Elloh,Peak root and starch of ten early bulking cultivars of cassava (Manihot esculenta Crantz) in Ghana,J.Ghana Sci.Assoc.9(2007) 54–60.
[16] IITA,Cassava in Tropical Africa,A Reference Manual,IITA,Ibadan,1990.1–25.
[17] R.J.Hillocks,M.Raya,M.J.Thresh,The association between root necrosis and aboveground symptoms of brown streak virus infection in cassava in southern Tanzania,Int.J.Pest Manag.42(1996) 285–289.
[18] H.O.Hartley,The use of range in analysis of variance,Biometrika 37 (1950) 271–280.
[19] R.W.Payne,S.A.Harding,D.A.Murray,D.M.Soutar,D.B.Baird,A.I.Glaser,S.J.Welham,A.R.Gilmour,R.Thompson,R.Webster,The Guide to GenStat Release 14,part 2: statistics,VSN International,Hemel Hempstead,UK,2011.
[20] E.Farshadfar,Incorporation of AMMI stability value and grain yield in a single non parametric index (GSI) in bread wheat,Pak.J.Biol.Sci.11(2008) 1791–1796.
[21] J.L.Purchase,H.Hatting,S.C.Van Deventer,Genotype × environment interaction of winter wheat(Triticum aestivum L.) in South Africa: II.Stability analysis of yield performance,S.Afr.J.Plant Soil 17(2000) 101–107.
[22] E.Farshadfar,N.Mahamodi,A.Yaghotipoor,AMMI stability value and simultaneous estimation of yield and yield stability in bread wheat (Triticum aestivum L.),Aust.J.Crop.Sci.5(2012) 1837–1844.
[23] O.O.Aina,A.G.O.Dixon,I.Paul,E.A.Akinrinde,G × E interaction effects on yield and yield components of cassava(landraces and improved)genotypes in the savannah regions of Nigeria,Afr.J.Biotechnol.8(2009) 4933–4945.
[24] M.G.Akinwale,B.O.Akinyele,A.C.Odiyi,A.G.O.Dixon,Genotype × environment interaction and yield performance of 43 improved cassava (Manihot esculenta Crantz) genotypes at three agro-climatic zones in Nigeria,Br.Biotechnol.J.1(2011) 68–84.
[25] T.Alicai,C.A.Omongo,M.N.Maruthi,R.J.Hillocks,Y.Baguma,R.Kawuki,A.Bua,G.W.Otim-Nape,J.Colvin,Re-emergence of cassava brown streak disease in Uganda,Plant Dis.91(2007) 24–29.
- The Crop Journal的其它文章
- Productivity,quality and soil health as influenced by lime in ricebean cultivars in foothills of northeastern India
- Identification of QTL for adult-plant resistance to powdery mildew in Chinese wheat landrace Pingyuan 50
- Effect of subsoil tillage depth on nutrient accumulation,root distribution,and grain yield in spring maize
- Isolation and characterization of a novel wall-associated kinase gene TaWAK5 in wheat(Triticum aestivum)
- Exp2 polymorphisms associated with variation for fiber quality properties in cotton(Gossypium spp.)
- The impacts of conservation agriculture on crop yield in China depend on specific practices,crops and cropping regions

