
Reactive and non-reactive transport modelling in partially water saturated argillaceous porous media around the ventilation experiment,Mont Terri
2013-10-19 06:57:50AlxnrBonStvnBnowJmsWilsonAlinMillrShigoNkmMylsEnglishChristophrMDrmottBnoitGritt
Alxnr Bon,Stvn Bnow,Jms Wilson,Alin Millr,Shigo Nkm,Myls English,Christophr MDrmott,Bnoit Gritt
aQuintessa Ltd.,Chadwick House,Birchwood Park,Warrington,Cheshire,WA3 6AE,UK
bCommissariat à l’Energie Atomique,Yvette,France
cJapan Atomic Energy Agency(JAEA),Tokai,Japan
dUniversity of Edinburgh,Edinburgh,UK
eUniversidad Politécnica de Catalunya,Barcelona,Spain
1.Introduction
The safety case for a radioactive waste disposal facility in a deepgeological formation is likely to be supported to a large extent by the ability of the proponent to demonstrate a good fundamental understanding of the evolution of the system under construction,disposal and closure conditions. Among a number of different possible host-rocks, argillites are being investigated by several countries. Demonstration and development of this understanding make heavy use of experimental investigations in the laboratory,field, devoted underground research laboratories (URLs), and on physical models and computer codes that describe and predict the outcomes of such experiments. The Mont Terri URL was opened in1995 in an argillite layer (called ‘Opalinus clay’) in order to characterise and study the geological, hydrogeological, geochemical and geotechnical properties of this clay formation. A large number of instrumented experiments have been designed and installed, thus supplying a significant amount of data which can be further used for model validation. The ventilation experiment (VE) has been carried out at the Mont Terri URL to study the desaturation process which may happen because of the forced ventilation in galleries and drifts, during the construction and operation phases of the repository. In particular, it is expected that the desaturation process will change the hydro-mechanical (HM) properties of the rock, thus influencing the potential performance and safety characteristics of the repository.
A specific task of the international project DECOVALEX-2011(acronym for DEvelopment of COdes and VALidation against EXperiments),relates to predicting the consequences of hydromechanical-chemical(HMC)processes during the micro-tunnel ventilation.A preliminary task considered modelling a laboratory drying test,in order to assess the ability of computer codes and modellers to reproduce the main phenomena involved in the VE,and to identify a first set of hydraulic parameters relevant to the Opalinus clay.The main task then considered the different phases of the VE itself:a first period(‘Phase 0’)following the excavation of the micro-tunnel in 1999,up to the installation of doors that allow controlled ventilation of a portion of the micro-tunnel,and then a single resaturation-drying cycle(‘Phase 1’) finished in January 2004.This was then followed by further desaturation-resaturation cycles to the end of 2010,although data were only available for this analysis(both descriptive and predictive)from May 2003 to April 2007.In this paper,the main attention of the analysis is on the geochemical data focusing on groundwater chloride and sulphate compositions,covering Phases 1 and 2.

Fig.1.Location of the micro-tunnel in Mont Terri.
2.Ventilation experiment
2.1.Brief description
The Mont Terri URL is located adjacent to a security gallery of a motorway tunnel in northern Switzerland(Bossart and Nussbaum,2007).The URL is located at a depth of approximately 400m in the Opalinus clay,a stiff layered Mesozoic clay of marine origin.After the excavation of experimental niches in 1996,a new gallery was excavated in 1998,followed by a micro-tunnel of 1.3m diameter in early 1999.The VE took place in a 10m long section of this microtunnel as illustrated in Fig.1.
After its excavation,the micro-tunnel was left without relative humidity(RH)control for approximately3.4years.After this period doors were installed in order to create a section of 10m length,where the air in flow and the RH could be controlled and monitored(Fig.2).The micro-tunnel was then subjected to two wetting and drying cycles.The first cycle lasted from 8 July 2002 to 29 January 2004(Phase 1).Initially 100%RH in flowing air wetted the micro-tunnel and the nadesaturation period was affected by applying an air in flow at 2%RH.This first cycle was then followed by a second cycle,and a final resaturation which continued until 2010(Phase 2),although data were only made available until April 2007.The corresponding total sequence of prescribed RH is illustrated in Fig.3(curve RH-in,in red).
The micro-tunnel was heavily instrumented with sensors for RH,pore pressure and displacement.Two water pans(Fig.2)were also installed in order to record the evolution of their mass loss due to the ventilation.The variation of the RH with time,at different points along the micro-tunnel,is shown in Fig.3.

Fig.2.Controlled ventilation section in the micro-tunnel,and RH measurement locations.
2.2.Summary of HM behaviour
The HM response of the system was described in detail by Garitte et al.(2013).However,in general terms,the evolution of the system can be described as follows:
(1)A known rate of air with a defined RH is input into the sealed section of the tunnel.
(2)Interaction between the water vapour in the tunnel and the unlined tunnel host-rock results in vapour exchange between the tunnel and the host-rock.Evaporation of liquid water from the tunnel surface may also occur depending on local tunnel RH.
(3)Water vapour leaves the tunnel via a measurement gauge for RH and air rate.The difference between points 1 and 3 mentioned above constitutes the tunnel water balance.
(4)Loss of water from the host-rock to the tunnel as vapour causes a reduction in water pressure and saturation as air invades the formation from the host-rock.
(5)The reduction in liquid pressure and RH around the tunnel causes liquid water and water vapour(where presented)to migrate towards the tunnel.
(6)Desaturation and reduction in fluid pressure cause reduction in pore volume and limited shrinkage of some of the rock skeleton,causing a local net drop in volume of the host-rock.
(7)The volumetric change of the host-rock causes localised stress changes and is coupled with the hydraulic evolution through a reduction in porosity,which creates a coupling with fluid pressures and intrinsic permeability.
The processes described above are illustrated in Fig. 4. The dominant process models and those which have been represented by the modelling teams in DECOVALEX are therefore: vapour diffusion and advection in porous media and engineered volumes;viscous dominated multi-phase flow of air and water in porous media;and poro-mechanical deformation of the host-rock.
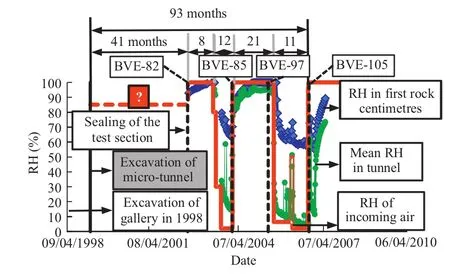
Fig.3.RH history of the test section(from Garitte et al.,2013).(For interpretation of the references to colour in the text,the reader is referred to the web version of this article.)

Fig.4.Schematic conceptual model of the HM system.
3.Data summary and interpretation
3.1.Data summary
The primary discussion of the geochemical analysis was provided by Fernandez et al.(2007a,b),which described the results of four campaigns of data collection.Boreholes were drilled and rockcores were taken for geochemical and whole-rock analysis around the following dates(Table 1).Note that these are a subset of the boreholes drilled during these campaigns.
The pore water analysis was conducted using two techniques.The majority of data were obtained through whole-rock analysis,whereby core samples were crushed and then leached using a solid to liquid ratio of 1:4,and the resulting fluid can be analysed.Some data were also obtained through squeezing and the extracted fluid analysed.In all cases,consistency in the squeezing results and the whole-rock analysis was good, sufficient to give confidence that the obtained results were representative.These two different forms of measurement give rise to two natural,but different ways to describe the concentration of chloride in the porous medium.The whole-rock analysis produces concentration per dry rock mass(mg/kg),while the squeezing analysis tends to give concentration in the water extracted (mg/L or mol/L). Conversion between the two analytical methods requires knowledge of the absolute water content, fluid saturations,total porosity and any geochemical porosity exclusion effects for the species in question.Indeed,the estimation of geochemical porosities for the Opalinus clay,as discussed by Fernandez et al.(2007a,b)in the context of chloride exclusion,can be achieved through the comparison of these different analyses for similar samples
It should be noted that there is considerable uncertainty in the sulphate analysis because of the tendency for additional oxidation of the samples under laboratory conditions.Comments by Fernandez et al.(2007a,b)indicate that this effect was minimised as far as practicable and the results were considered not to be invalidated by this effect.
Fernandez et al.(2007a,b)discussed the analysis and interpretation in full detail,however,the following key points can be established:

Table 1Boreholes used for geochemical analysis and their excavation dates.

Fig.5.Chloride borehole data plotted for all available boreholes and coloured by the four sampling times.
(1)The Opalinus clay water is marine one in origin and has a background salt concentration of 0.3-0.4mol/L.
(2)From supporting work cited in Fernandez et al.(2007b),chloride is expected to be present between 0.62 and 0.55 of the free porosity,termed as the “chloride porosity ratio”,and was assumed to occur primarily from anion exclusion processes.
(3)There is a considerable increase in concentration and the absolute amount of chloride salts close to the tunnel wall(Fig.5).While the boreholes are constructed at different locations in the tunnel,and at each time,the profile of chloride is quite consistent.In Fig.5,the curves show representative behaviour for two selected boreholes.The data are shown as mg/kg(chloride/rock),which are consistent with the measurement technique,and are reproduced from Fernandez et al.(2007a,b).

Fig.6.Br/Cl and SO4/Cl ratios in pore water obtained in boreholes from the VE. BVEboreholes are from the ventilation tunnel with depth from the tunnel wall indicated BWS and BDI boreholes are water saturated and from elsewhere in the URL(from Fernandez et al.,2007b).
(4)There is a significant increase in sulphate that is also close to the tunnel wall.However,because the ratio of sulphate to chloride is constant in water saturated samples at approximately 0.05(the value for seawater),it is clear that the increase in sulphate is in excess of the relative increase observed in chloride concentration(Figs.6 and 7).
3.2.Data interpretation
The conceptual interpretation of the chloride evolution is relatively simple,assuming that chloride can be treated as a fully conservative tracer.Evaporation of water at the tunnel wall and within the pores causes the chloride to become locally concentrated as the solutes do not leave the rock with the water vapour.The desaturation and lower water pressures at the tunnel wall cause more water containing chloride to flow towards the tunnel by advection.This in flowing water causes not only the chloride concentration in pore water to rise through reduction in the volume of water in which the chloride is dissolved,but also the total amount of chloride associated with a given rock mass.The creation of a concentration gradient of chloride in pore water generates back diffusion of solutes into the host-rock away from the tunnel.The two competing processes of advective in flow and diffusive out flow will tend to move the chloride system to a steady state and create the relatively stable profile of concentration seen from the tunnel wall.There is clearly scatter in the data between boreholes at given times,but the relatively few data points are given.For the uncertainties in the measurement techniques and the apparent scatter in each profile,it is difficult to construct an argument for structured heterogeneity in the system on the basis of these results.
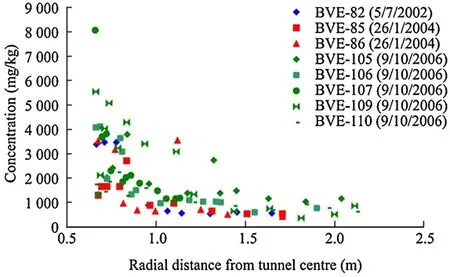
Fig.7.Sulphate concentration expressed as mg/kg(total rock concentration,transcribed from Fernandez et al.,2007b).
For the sulphate system,it is likely that an oxidation reaction is occurring due to the ingress of air into the region around the tunnel,in addition to the advective/diffusion processes seen for chloride.Incoming air induces an oxidation reaction in which the pyrite and gypsum found in the rock mass produce an increase of the sulphate concentration.The geochemical arguments related to this process are discussed in Section 6 and Fernandez et al.(2007b).
In order to progress modelling of the sulphate system,with all the attendant uncertainties in process and parameterisation, it was first necessary to gain confidence in the basic transport processes by understanding and representing the significantly simpler nonreactive system.Hence,the first area of work considered just the chloride system which is independent of the reactive system.
4.Non-reactive conceptual and process model:chloride
4.1.Chloride porosity and migration
The conceptual model for chloride migration was taken directly from the interpreted behaviour described by Fernandez et al.(2007b)and restated in Section 3.However,one area of particular concern was the representation of the so-called chloride porosity.An often reported feature of argillaceous materials is that the water- filled porosity of the system is not the same as the porosity estimated from other methods,most notably geochemical methods(Pearson,1998).The reason for this disparity can come from a number of sources but fall into two general classes.The first is an electrochemical exclusion process whereby charged anions(such as chloride)become excluded from part of the total available water due to the net negative charge on clay surfaces.The second process is related,and comes from the observation that all of the water in a claystone is not presented as free water in open porosity.Instead,depending on the clay,saturation,geochemistry and stress state,water may be presented in the interlayers between clay layers,or may be adsorbed to the surface of the clay.In these alternative physical forms of water,ions may also be excluded.
Fernandez et al.(2007b)gave an Opalinus clay“chloride porosity ratio”ranging between 0.55 and 0.62,the scaling factor applied to the total porosity to estimate the effective geochemical porosity of chloride.Thus,for the Opalinus clay and other claystones,a conceptual evaluation must be made and reflected in the mathematical representation of charged species migration through advection and diffusion.Consistent with Fernandez et al.(2007a,b),concentrations of chloride in groundwater are calculated using the non-excluded water volume,rather than the total water volume.
4.2.Mathematical model
The mathematical model comprises two processes:advection and diffusion.In addition to the HM model,which may be found in Garitte et al.(2013),the equations governing the basic model are

where gdiff,iis the diffusive flux of species i(mol/s),gadv,iis the advective flux of species i(mol/s),Ciis the concentration of species i in water(mol/m3),DEff,iis the effective diffusion coefficient(m2/s),A is the total area of porous medium transfer(m2),qliquid wateris the volumetric flux of liquid water(m3/s),θ is the available porosity(including any geochemical porosity effects),τ is the tortuosity,Swis the water saturation,and Dw,iis the free water diffusivity of species i(m2/s).
The principal uncertainty in the formulation is in the specification of the correct liquid water flow rate with regard to the potential conceptual importance of multiple types of porosity.Because the chloride exclusion porosity implicitly includes a number of different processes,including having water bound by interaction with swelling clays and anion exclusion,the effective advective water flux for chloride transport could be:
(1)Non-chloride water bound,physical partitioning dominates:advective water transport takes water from only the chloride porosity.This model assumes that the water not associated with chloride is physically bound to the rock matrix,dominantly as interlayer water(as one might expect in a fully saturated bentonite).Therefore,in this model,all the advective migration of water is associated with the chloride transport,leading to proportionally higher transport velocities.
(2)Non-chloride water free,electro-chemical partitioning dominates:all water is advected,and hence the flux of water calculated is applied to all water,not just the chloride associated water.This model assumes the partitioning is essentially an electro-chemical process related to chloride and does not involve any differing physical forms of water.Therefore,in this model,the advective migration of water is proportionally partitioned between the water associated with the chloride and non-chloride porosity,leading to slower transport velocities than physical exclusion model,i.e.the conventional velocity v=qliquid water/(θA)calculated using the total available porosity.(3)Combination model:some interpolation between the two endmembers above using some form of mixed dual porosity model.
The working assumption,given the available information presented by Fernandez et al.(2007a,b),was that the anion exclusion process would dominate the observed chloride porosity. Therefore,for a starting point the electro-chemical exclusion model should be the reference assumption and other models should be investigated as process sensitivities.It should be noted that when considering only concentrations of chloride in groundwater as the principal output from the analysis (rather than mass of chloride per unit rock mass,for example),and when using the electro-chemical exclusion model,the chloride porosity scales out of Eq.(1)and can be neglected.
Some consideration was given to the potential for water transport through osmotic effects(Bader and Kooi,2005).However,through simple hand calculations of potential water flux rates versus those seen in the HM modelling,it showed that osmotic water fluxes would only contribute significantly less than 1%of the HM flow rates for the concentration contrasts observed.For this reason,the osmotic water fluxes were not considered and hence any coupling between the chloride concentration and water migration could also be neglected.

Table 2Input parameters for the Quintessa QPAC chloride model.
4.3.Numerical implementations
The equations given in Eq.(1)were already available in the codes used for the HM analysis,and hence calculations were relatively simple to perform for all teams.Two general approaches were adopted for implementation:
(1)Direct addition of the tracer transport process model to the HM formulation.
(2)Re-use of the same grid as used for the HM calculations,but simply transposing the liquid water fluxes and water saturations from the HM calculations as input to the tracer transport model.
Given there is little opportunity for coupling between the process models,both methods are functionally equivalent provided the flux transposition for the second method is at sufficiently fine intervals.
5.Summary of main chloride results
Chloride results were calculated by all the teams participating in the task.For ease of discussion,a single representative set of results is presented and variations from this will be discussed subsequently.
5.1.Representative inputs and results
The model parameterisation and results for the Quintessa one dimensional(1D)cylindrical model in QPAC(Maul,2010),which included an explicit representation of the tunnel,are presented here as a reference point,having already been demonstrated to give a good predictive mass balance and representation of tunnel RH across Phases 1 and 2 of the VE(Bond et al.,in press).The QPAC model used a monolithic approach in this case and appended the tracer transport module to the existing 1D multiphase flow(MPF)and mechanical calculations,using the liquid water flows and water saturations from the MPF directly.As discussed in Bond et al.(in press),the model contained 39 finite volume compartments in the cylindrical representation of the host-rock,down to sub-centimetres scales close to the tunnel,increasing approximately geometrically to tens of metres at the outer radial boundary.The input parameters are listed in Table 2.
Boundary conditions were purely advective on the outer cylindrical boundary of the model(with no- flow in the axial direction,consistent with the hydraulic model)and no-flow across the tunnel boundary,assuming that no chloride was lost through evaporation.
The results at the time of the four drilling campaigns are compared with the equivalent experimental results in Fig.8.The consistency between the numerical results and the experimental data is clearly very good,and it is encouraging that features such as the localised peak seen on 9 October 2006(compare Figs.5 and 8d)are replicated by the model.This result lends considerable support to the HM results, and provides a high degree of confidence that the process representations are well captured by the numerical tool.

Fig.8.Comparison of calculated chloride rock mass concentrations versus the experimental data at different dates.
5.2. Consistency in results, process models and parameterisation
In addition to the results presented above, calculations were also conducted using the CAST3M finite element code(Verpeaux et al.,1989;CEA,2008),THAMES finite element code(hydro-mechanics)coupled with Dtransu(transport)and OpenGeoSys(University of Edinburgh and Helmholtz Centre for Environmental Research,http://www.rock flow.net).As discussed in Garitte et al.(2013),the general hydraulic behaviour was found to be consistent across the modelling approaches and hence the primary inputs to the transport calculations of modelled porosities and groundwater flow velocities were expected to be coherent across codes and teams.The primary difference in formulation between teams came in the treatment of the effective chloride porosity.Most teams simply neglected the effective porosity component in their calculations,hence implicitly assuming anion exclusion dominance in the chloride porosity.The exception was the QPAC model which explicitly included the chloride porosity and enabled the process conceptual model uncertainty to be explored.With the exception of the chloride porosity, the selection of parametric input was consistent with that given in Table 2 for porosity and the free diffusion coefficient.However,it appears that the THAMES and CAST3M models used a tortuosity of 1 rather than 3.6,effectively increasing the diffusivity of the system for these two models.
Characteristic example results between the four teams are shown in Fig.9,with the measured chloride water concentration data for the appropriate time period.As discussed previously,note that chloride concentrations were not measured directly but inferred from whole-rock analysis and assumptions concerning effective chloride porosities and estimated water saturations(Fernandez et al.,2007a,b).
The profile produced by all teams is broadly similar,showing chloride elevation out to just beyond 1.1m from the tunnel centre(0.45m from the tunnel wall)with molar concentrations between 0.5 and 0.8mol/L at the tunnel wall,with the CAST3M results showing the largest zone of chloride elevation.The numerical results effectively bracket the experimentally derived values.Unlike the CAST3M and Open Geo Sys results, the QPAC and THAMES results show an increase equivalent to approximately 0.05mol/L consistent with the different interpreted background concentrations for the model as a whole and that derived from the whole rock analysis for these three boreholes(other boreholes have different derived background concentrations).Neglecting this offset,the QPAC results would show a similar level of fit shown in Fig.8c,although the THAMES results would fall below the experimental profiles.The differences in observed concentrations appear to be a combination of differing diffusivity models and the differences in the HM formulations(Garitte et al.,2013).Overall the results are reasonably coherent,given the known differences in hydraulic and transport parameterisation and process models,and in general all replicate the major features of the experimental observations.

Fig.9.Comparison of calculated chloride water concentrations on 2 May 2005.
5.3.Key sensitivities and assumptions
A series of sensitivity and uncertainty analyses were performed both for individual codes and across the task participants. The main areas of investigation were:
(1)Higher dimensionality:2D or 3D models.
(2)Alternative conceptual treatment of the chloride porosity.(3)General parameter sensitivity.
(4)Sensitivity to hydraulic changes.
The general results of the analyses can be summarised as follows:
(1) The primary parameter sensitivity was to the effective diffusion coefficient, primarily through the assumed free water diffusion coefficient and the tortuosity (Eq. (1)). Increasing the effective diffusivity tended to spread the zone of increased chloride while reducing the peak value at, or adjacent to the tunnel wall.This result is consistent with the differences in results between models (Fig. 9) and the related minor parameterisation differences.
(2)In cases where the hydraulic system was changed,provided that the basic water balance was kept broadly consistent with the experimental measurements,the chloride response remained consistent.This illustrates the importance of the advective component of water flow concentrating chloride at the tunnel wall.The differences shown in Fig.9 appear largely due to the small differences in the HM models as discussed by Garitte et al.(2013)and Bond et al.(in press).
(3) Changing the conceptual model to the “bound water” model for the chloride porosity gave the expected result. This process model effectively increases the advective velocity for the chloride transport. This tends to narrow the chloride peak close to the tunnel wall and create higher bulk rock and dissolved water concentrations by a factor of 1.25 greater than those seen in the QPAC reference results (Fig. 9). This is not a major change and within the bounds of conceptual and parametric uncertainty arising from tortuosity in the diffusion model, for example.
(4)Higher dimensionality models were run,looking at the likely
variation along the axis of the tunnel and spatially around the tunnel perimeter,to consider whether we would expect to see a structured variation in the concentration data.The conclusion of such analyses was that while structural variation could clearly be induced in the models.The magnitude of expected variation was relative small(a factor of about 1.5 in peak rock mass concentrations at the tunnel at most,Fig.10),most obviously along the axial direction of the tunnel and much less for water chloride concentrations(Fig.11).It would be difficult to distinguish such a trend in the available data,given the observed “scatter”through various uncertainties in the analysis approach and the relatively small amount of data available,especially at early times.

Fig.10.Comparison of calculated chloride rock mass concentrations at 1,5 and 9m along the long axis of the tunnel using a 2D(radial,axial)representation of the system in QPAC.

Fig.11.Comparison of calculated chloride water concentrations at 1,5 and 9m along the long axis of the tunnel using a 2D(radial,axial)representation of the system in QPAC.
5.4.Non-reactive transport summary
Using the available data,it has been relatively straight-forward to produce a transport model that reflects the available data for all the teams involved in the task.This indicates that the basic hydraulic model and chloride conceptual model are robust and add confidence to the overall performance of the model.The results do indicate that in general it is largely insensitive to the major parameters,being more influenced in the underpinning hydraulic model.
Such a result gives sufficient confidence in the non-reactive transport calculation to attempt the significantly more complex and less well constrained reactive transport analysis.
6.Reactive conceptual and process model:sulphate
Of the teams that participated in modelling the VE for DECOVALEX,only Quintessa attempted the full reactive transport modelling component(some initial geochemical models were developed by JAEA using the THAMES code,but full results were not available at the time of writing),thus all following discussions relate purely to this model.The model developed was a reconnaissance or prototype model using QPAC(Maul,2010),designed to investigate the plausibility of a redox-pyrite-gypsum model in describing the observed evolution of the sulphate.
6.1.Approach
As was noted previously,for these initial calculations it is assumed that the feedback of the chemical processes on the hydraulic calculations is weak.In particular,it is assumed that the rate at which oxygen is dissolved into the water and takes part in redox reactions is not sufficient to significantly alter the O2partial pressure in the pores due to a relatively rapid re-supply of O2through the connected gas(air)body to the tunnel(which is assumed to homogenise quickly compared to other processes in the system).Since there is no assumed coupling back to the hydraulic calculations,the reactive transport calculations can simply use the reported fluxes,air pressures and saturations from pre-existing runs as input(similarly to the chloride calculations),with oxygen partial pressures calculated assumed 21%O2in the gas phase.
The geochemical sub-system is deliberately kept simple for these prototype calculations.The key process of interest is the pyrite oxidation(FeS2),since this is likely to exert the strongest control over O2concentrations in the pore water.The pyrite oxidation reaction can be represented as

Pyrite oxidation will release sulphate to the pore water and reduce pH value.Sulphate concentrations in the pore water will vary according to the rate at which sulphate is supplied from oxidation of pyrite and the rate at which it is transported through the system.Transport is a consequence of advection by the bulk movement of water through the pore space and diffusion in the bulk water.Sulphate concentrations will be expected to be highest where oxygen is abundant,leading to the greatest amounts of dissolution of pyrite,and so are expected near the tunnel wall where there is a strongly connected gas phase.Concentrations will also become more elevated as a consequence of evaporation at the tunnel wall,although this process is not represented in the prototype model.
Dissolved O2concentrations will be transported similarly but are also subjected to a source of oxygen from dissolution wherever free gas is present in the pore space.Dissolution is represented as a kinetic process that attempts to achieve a target equilibrium activity of dissolved O2in the pore water that is calculated from the O2fugacity.
In addition to pyrite,calcite(CaCO3(s)),quartz(SiO2(s))and albite(NaAlSi3O8)are included in the model to represent the solids presented in the host rock.All minerals are modelled kinetically.Calcite will tend to buffer pH value in the model by dissolving.Quartz and albite are expected to be relatively inert.
Although the intention is to keep the geochemical system simple,in order to properly represent the redox system,several aqueous species are included in the model.12 basis species are included in the model together with 31 complex and redox species,resulting in around 50 geochemical species per compartment.
The reactive transport module in QPAC has been designed to enable interactions of groundwater and other subsurface fluids with rocks and man-made materials to be modelled.In an open system(i.e.systems other than “closed-box”batch-type systems)the interactions in the water-rock system are represented by nonlinear reactive transport equations,which couple the fluid flow and transport equations to equations representing the geochemical reactions between the pore water components and the solid materials.The model is fully coupled(rather than being implemented as a two-step process as in some other modelling codes)and allows alteration processes in the rock and man-made materials feed back into the fluid flow equations through variations in porosity and other material properties such as permeability and tortuosity(although this option is not used in the current calculations).
Effects on other rock properties can be inferred,such as the loss in the swelling capacity of bentonite clays as monovalent sodium ions are replaced by divalent calcium ions.
The module includes models for both homogeneous reactions within the fluid and heterogeneous interactions between the fluid and minerals.In fluids the following processes are simulated:
(1)Aqueous complexation:the process by which significant fractions of the dissolved species can occur as complex aqueous species.These reactions are faster compared to fluid flow,and are represented by equilibrium equations expressing laws of mass action.
(2)Activity of species:the module incorporates models for low
activity solutions(for example,the Davies equation(Zhu and Anderson,2002))as well as the Pitzervirial equations for higher concentration solutions(Harvie et al.,1984)which augment the standard Debye-Hückel activity model(Zhu and Anderson,2002)with the addition of terms that describe the interaction between individual ion pairs and triples.
The model includes several potential fluid-rock interaction processes, including solid solutions, ion-exchange, surface complexation and precursor cannibalisation. However, in the simple simulations considered here, the only relevant processes are mineral dissolution and precipitation reactions, which are simulated in the model using kinetics. In each case, a kinetic rate is defined as a function of the in situ pore water conditions, typically depending on the saturation of the mineral (a measure of its tendency to dissolve or precipitate at the in situ conditions), activities of key species(e.g.H+,OH-or O2(aq))and a rate constant.The precise treatment of the kinetics in this modelling study is discussed in Section 6.2.3.As minerals precipitate/dissolve,corresponding amounts of their component aqueous species are removed or introduced to the pore water to conserve the total mass.
Aqueous species are free to diffuse in the pore water and be transported by advection and dispersion when the water is flowing.In this study,Darcy pore water fluxes are obtained from the HM flow modelling,and use the same flows for the chloride calculations.
6.2.Geochemical model and parameterisation
6.2.1.Pore chemistry
For the purposes of this simple model,the Opalinus clay is assumed to be composed of albite(71%),quartz(14%),calcite(13%)and pyrite(2%).As previously mentioned,albite and quartz are expected to be relatively inert. The initial pore water composition in the model was calculated in a separate PHREEQC calculation using the llnl.dat thermodynamic database assuming calcite and pyrite equilibrium,with Na and Cl concentrations reported by Fernandez et al.(2007b,BVE-102)with charge being balance on pH value.The composition is given in Table 3 and is consistent with the previous PHREEQC modelling reported by Fernandez et al.(2007b),which itself is consistent with the available groundwater composition data.
6.2.2.Subsystem couplings domain and boundary conditions
As stated earlier,couplings between the hydraulic subsystem,in which the MPF module calculates flows,and the reactive geochemical subsystem,in which the reactive transport(RT)module simulates geochemical reactions and solute transport, are assumed to be one way with chemical reactions and alteration having no direct feedback on hydraulic properties in this preliminary version of the model.The key couplings are that:
(1)Pore water fluxes calculated by MPF model are used by RT model in its solute advection formulation.
(2)Air pressures calculated by MPF model are used to derive O2(g)fugacities and hence dissolved O2(aq)activities,which are then used as targets for dissolution processes.
(3)Air saturations calculated by MPF model are used to identify regions with negligible gas in the pores(dissolution processes are not simulated in regions with air saturations less than0.01).The implementation of these relationships is as follows.The diffusive-advective transport flux in the RT module is given by


.noitisopmo cretaweropyalc 3s u el nil baa pT O
where ρwis the pore water density(kg/m3),D is the diffusion coefficient(m2/s),qRTis the Darcy velocity(m/s),and ciis the molality of the solute species(mol/kg)for each solute species i in the geochemical subsystem.The RT Darcy velocity can be related to the MPF water fluxes,qMPF,w(r,t)(kg/year),by

where A(r) is the transport area in the discretisation,which is given by the area of the common interface over which the flux applies.O2fugacity is derived from the MPF air pressure using an ideal gas assumption:

where PMPF,g(r,t)is the MPF gas(air)phase pressure in bars.The target dissolved O2(aq)molality that is implied by the MPF gas phase pressure is

where KO2(g)is the O2(g)equilibrium constant at the in situ temperature(taken to be 25°C due to availability of thermodynamic data for Fe species).The introduction of O2into the pore water is represented by a source term for O2(aq)in the geochemical subsystem driven by the difference between the target and actual in situ O2(aq)molality,given by

where kdissolveis the dissolution rate(year-1),sMPF,g(r,t)is the MPF gassaturation,and f[sMPF,g(r,t)]is a“cut-off function”that is used to disable dissolution in regions where the gas saturation is lower than 1%.Since there are trace quantities of gas present at all locations in the multiphase flow formulation in MPF,that would not contribute towards a genuine source of dissolved gas.
To fully couple the RT and MPF processes,all that would be necessary would be to insert a sink term into the MPF model corresponding to the RT source term and to implement a coupling to represent loss of solvent in the RT module due to evaporation.That would reflect the rise in concentrations as evaporation occurs near the tunnel wall.These couplings would be relatively simple to introduce into a future version of the model,should it be desirable.Evaporation processes have been implemented in a bespoke models in previous applications of the RT module(Savage et al.,2010).
The modelling domain was the same as 1D cylindrical domain of 39 compartments used for the chloride calculations.Reactive transport boundary conditions at the tunnel wall assume a zero solute concentration gradient in the pore water.This means that all transport out through the tunnel wall is purely advective,i.e.solutes are carried out through the tunnel wall in any(liquid)water that leaves the system via that route,which in the current parameterisation is zero,i.e.all water exchange with the tunnel is through evaporation/precipitation and water vapour migration processes.
At the boundary in the host rock(60m into the rock,Fig.4),a fixed Opalinus clay pore water composition is applied,leading to an advective boundary condition when MPF water flows are inwards and a diffusive flux when the boundary solute concentrations differ from the solute concentrations in the adjacent cells in the model.The fixed pore water composition was calculated in a separate PHREEQC calculation using the llnl.dat thermodynamic database(Johnson et al.,2000),assuming calcite and pyrite equilibrium with Na and Cl concentrations reported by Fernandez et al.(2007b,BVE-102)and charge balance on pH value.The computed composition is shown in Table 3.This composition was also used as the initial pore water composition in the rock at the start of the calculations.6.2.3.Reference parameterisation

Table 4Mineral reactions and equilibrium constants.
The model includes mineral reactions for pyrite,calcite,quartz and albite as shown in Table 4.The aqueous species included in the pore water chemistry model are listed in Table 5.log10Kdata for all aqueous and mineral species were taken from the database(Johnsonetal.,2000).A temperature of 25°C was assumed throughout to ensure availability of thermodynamic data,noting that this temperature is not very different from the 15°C observed at the tunnel wall,and in the context of all the other uncertainties regarding the geochemical system,this is a relatively minor issue.
The aqueous reaction subsystem was modelled assuming instantaneous equilibrium in the aqueous phase for all species.Mineral evolution was simulated with kinetics.For pyrite,the rate law of Williamson and Rimstidt(1994)was used:

wherekis the rate constant andk=10-8.19mol/(m-2s),miis the molality of the subscripted species,andA(t)is the time-dependent reactive surface area of pyrite(m2).The fit of this model for pyrite oxidation to measured data,and the variation of the rate with O2and H+in the pore water are shown in Fig.12.
Calcite dissolution and precipitation are modelled using a reaction based on departure from equilibrium from Busenberg and Plummer(1986):

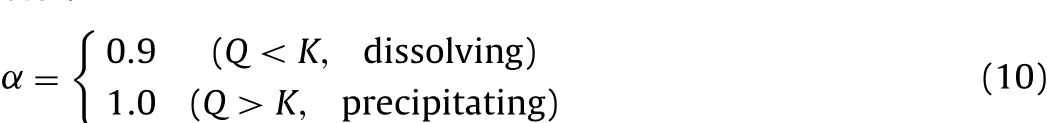
where the rate constantk=10-5.2mol/(m-2s)and α is the parameter:
Quartz and albite are both simulated using transition state theory(TST)based reactions with pH-dependent dissolution and precipitation rates:


Table 5Aqueous species included in the model.Basis species are shown in bold text,redox species are shown in bold italic text.logK data for all redox and complex species are taken from thermo.com.V8.R6.230(Johnson et al.,2000)at 25°C.

Fig.12.Pyrite oxidation model fit to measured data(top)and variation with pore water O2and H+(bottom)(from Williamson and Rimstidt,1994).Selected model fit shown with the solid line.See Refs(Mckibben,1984;Moses and Herman,1991;Nicholson et al.,1988;Smith et al.,1970).
where the subscriptirefers to the mineral(albite or quartz)with the values of the terms as given in Table 6.The rates are a fit to various experimental datasets,as shown in Fig.12.
Effective diffusion coefficients(m-2s-1)for all aqueous species were set to be

where θ is the in situ evolving porosity,which is within 10%of the model used for the chloride calculations.
Note that in the default model as a simplifying assumption, there is no concept of a chloride porosity or other geochemical porosity,so the full porosity is available for reactive transport.
6.3.Numerical implementation
In this study, aqueous activities are represented using the Davies model,in which the activity coefficient γiof speciesiis given by


Table 6Coefficients in the reaction rate expression for albite and quartz.
where A is the Debye-Hückel constant(see for example Zhu and Anderson,2002),ziis the charge of species i,and the ionic strength I is defined as

where liis the molality(mol/kg)of species i.The activity aiof species i is then given by

Equilibrium conditions between the pore water species are represented by laws of mass action.These relate the equilibrium constant Kjof the j-th species to the activities by

where αijis the stoichiometry of species i in the equation for species j.For this study,equilibrium constants have been taken from the thermodynamic database thermo.com.V8.R6.230(Johnson et al.,2000).
The aqueous species are organised in the thermodynamic database so that reactions for all redox species can be expressed in terms of a collection of aqueous “basis”species,and reactions for all aqueous complex species and minerals can be expressed in terms of only basis and redox species.With sequences B1,...,BNB,R1,...,RNRand C1,...,CNCused to index the basis,redox and complex species respectively,the mass action equations for the redox and complex species become

The activities of the redox and complex species appear with power(-1)in Eqs.(17)and(18)because the reactions are written so that the redox and complex species always have stoichiometry 1 in their de fining reactions.The model includes several potential fluid-rock interaction processes,including solid solutions,ionexchange,surface complexation and precursor cannibalisation.However,in this study,the only relevant fluid-rock processes are mineral dissolution and precipitation reactions,which are simulated in the model using kinetics.A kinetic rate Gj(molm-3year-1)for the rate of change of the concentration mj(mol/m3of total volume)of the j-th mineral in the system is specified for j=1,...,NM.Then

Gjcan be de fined as a function of the in situ pore water conditions,typically depending on the saturation of the mineral(a measure of its tendency to dissolve or precipitate at the in situ conditions),activities of key species(e.g.H+,OH-orO2(aq))and arateconstant.Hence,Gjtypically varies with time.The precise treatment of the kinetics in this modelling study is discussed in Section 6.2.2.
For each aqueous species i,the rate of change of the molality of the pore water species is coupled to the kinetic change in the abundance of the j-th mineral by a source/sink termSij(molkg-1year-1)with magnitude:

where μijis the stoichiometry of the i-th aqueous species in the j-th mineral species,and θ is the total porosity of rock.
If we now distinguish the molalities of the aqueous basis,redox and complex species by bj(bj=lBj),cj(cj=lCj)and rj(rj=lRj),respectively,then the mass conservation equations for the aqueous basis,redox and complex species can be written as

where the terms T*jare transport operators for the basis,redox and complexspecies(molm-3year-1),which will be discussed shortly;and the terms˜G∗jdenote the rates of reaction of the redox and complex species(molm-3year-1).As noted above,aqueous pore water reactions are assumed to be in equilibrium at all times,so these rates are effectively in finite.They can be eliminated from the mass conservation Eqs.(21)-(23)to give the following mass conservation equation for basis species j:
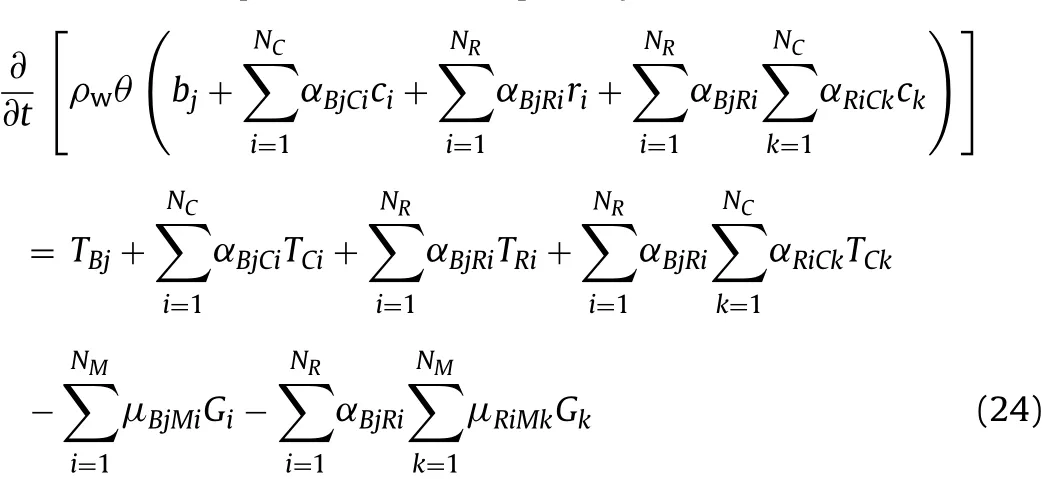
The system of Eqs.(17)-(19)and(24)provide NC+NRequations(from Eqs.(17)and(18)),NMequations(from Eq.(19))and NBequations(from Eq.(24)),which are suf ficient to characterise the system.
The transport terms Tjare of the form:

where Fjis the diffusive-dispersive-advective fluxes(molm-2year-1),and we have

where D(eff)jis the effective diffusion coefficient of the j-th aqueousspecies(m2/year),˜Djisthe(longitudinal)dispersion coefficient(m),and q is the Darcy velocity of the fluid(m/s).
For the purposes of this study,dispersion coefficients are assumed to be zero for all species, effective diffusion coefficients are assumed equal for all species and Darcy fluxes are obtained from the multiphase flow calculations(as described in Section 4).If different effective diffusion coefficients are chosen for each species,the additional electrochemical flux terms are required to ensure charge balance.
7.Summary of main reactive transport results
O2dissolution takes place in the model as the gas saturation(from the MPF calculations)migrates into the host-rock.The progress of the gas saturation front is mirrored in the evolving O2(aq)concentration,which is plotted against time in Fig.13.O2dissolution is only assumed to take place at gas saturations above 1%.The location of the free gas front equates to the position of the sharp front in the O2(aq)curves,since dissolution is assumed to be rapid.By the end of 2006, a sharp front has migrated approximately 1.25m into the rock(1.9m from the tunnel centre).The smoother low concentration front beyond the sharp front is a consequence of diffusion of small quantities of the dissolved O2(aq)beyond the free gas front.

Fig.13.Progress of the O2(aq)front from dissolution of the free gas phase.

Fig.14.Pyrite concentration,pH value and calcite concentration profiles.

Fig.15.Sulphate concentration expressed as mg/kg rock(total rock concentration)at various dates:comparison against numerical results.
Pyrite dissolution takes place in the model wherever the O2(aq)concentration is elevated(Fig.14a).Hence by late2006,somepy rite dissolution is seen at distances up to 1.25m in the rock.Adjacent to the tunnel boundary,where O2dissolution takes place for the longest duration,approximately 10%of the initial pyrite inventory is dissolved.
Pyrite dissolution leads to a reduction in pH value in the pore water(Fig.14b).By late2006,the pH value falls to around4.75over short distances adjacent to the tunnel wall and to 5-5.5 over the first 1.1m of rock.A relatively small amount of calcite dissolution takes place to buffer pH at these levels(Fig.14c).Around 1.5%of the calcite is lost over the first 0.35m of rock.In the compartment immediately adjacent to the tunnel,there is a small amount of calcite precipitation.This is most likely an artefact of the choice of the zero gradient boundary conditions.There is no significant alteration of albite and quartz over the timescales that are simulated.
The key output of interest is the sulphate content in the pore water,since this can be directly compared to measured data from Fernandez et al.(2007b).Measured and simulated sulphate concentrations are shown in Fig.15.Given the scatter in the measured data,the fit provided by the numerical model is reasonably good and is well within the range of the measured data.There are few datapoints on 5 July 2002 with the simulated sulphate content underestimating concentrations at the tunnel boundary but matching reasonably well in the 0.3-0.8m range. On 26 January 2004, the model over-predicts concentrations with respect to the bulk of the datapoints in the 0.2-0.9m range, but falls about mid-way between the measurements in the first 0-0.2m.
On 9 October 2006,the spread in the measured data is significant.The simulated results fall approximately in the middle of the envelope of datapoints,although the majority of the datapoints lie below the simulated values,and although the simulated concentrations near the tunnel boundary fit closer to the larger of the measured datapoints in this range.
The reasonable fit despite ignoring the concept of a reduced geochemical porosity may lead to the conclusion that multicomponent transport processes are occurring,with different aqueous species being advected at different rates.However,sulphate concentrations are likely to be affected mostly by mineral interactions(notably pyrite dissolution) with transport being a secondary effect.This can be seen in the concentration profiles in Fig.15,where the hump in the profile is mostly a consequence of localised pyrite dissolution (and mirrors the pyrite dissolution profiles in Fig.14a)with the localised peak near the tunnel boundary being primarily a consequence of advective transport.If a similar sulphate porosity assumption was made,it would be likely to most markedly affect results where advection processes dominate,i.e.near the tunnel boundary.It would have the effect of reducing the local peak, which might lead to a better fit to the non-peak sulphate concentrations that were measured,but would not be expected to have a large effect on the main sulphate peak close to the tunnel wall.
Hence a single porosity scaling(for anions and cations to ensure charge balance)may be adequate to improve the advection model for all aqueous species and improve both the sulphate fit near the tunnel walls and the chloride fit in general. ‘Fine-tuning’of the pyrite dissolution kinetics (such as surface area term)may lead to a better fit in the next 1m of rock. These factors could be investigated in any future updates to the models.
8.Conclusions
The work presented in this paper builds on,and reinforces the previous HM interpretation and modelling summarised in Garitte et al.(2013)and Bond et al.(in press),by successfully modelling simple conservative tracer transport of chloride and more reactive transport of a pyrite-sulphate system under strongly variable redox conditions,all within the context of multi-phase flow in porous media.
The comparison of simulated dissolved chloride concentrations data to measured values is especially encouraging,given the simplification of the system,and this gives additional confidence in the underpinning HM modelling approach.While satisfying,the primary value of this analysis gives a strong basis for more complex and conceptually uncertain reactive transport aspect of the modelling work,by providing confidence that the basic model for transport of dissolved species under MPF conditions is appropriate for this case.
Building on the chloride analysis,a relatively simple representation of the key geochemical properties that are likely to have operated has been developed,namely,kinetic treatments of pyrite dissolution(releasing dissolved sulphate and reducing pH),calcite dissolution(pH buffering),and solute transport of reactive and nonreactive species.The model includes a simplified representation of mineralogy and pore water compositions and a relatively simple treatment of reactive mineral surface area.However,based on the comparison of measured with simulated data,the models provide a good representation of key processes.
The mutual cross-consistency of the HMC process system gives a high degree of confidence that most aspects of the evolution of the VE that were of direct interest at the inception of the experiment,can be adequately understood,modelled and predicted.
Acknowledgements
The work described in this paper was conducted within the context of the international DECOVALEX Project(DE monstration of COupled models and their VALidation against EXperiments).The authors are grateful to the funding organisations who supported the work.Quintessa Ltd.and University of Edinburgh were supported by the Nuclear Decommissioning Authority(NDA),UK;CEA was supported by Institut de Radioprotection et de Sûreté Nucléaire(IRSN).The Japan Atomic Energy Agency(JAEA)and the Institute of Rock and Soil Mechanics,Chinese Academy of Sciences(CAS)funded DECOVALEX and participated in the work.The views expressed in the paper are,however,those of the authors and are not necessarily those of the funding organisations.The data used in this work were obtained in the framework of the EC project NF-PRO (Contract number FI6W-CT-2003-02389) under the coordination of ENRESA(Empresa Nacional de Residuos Radiactivos).
Bader S,Kooi H.Modelling of solute and water transport in semi-permeable clay membranes:comparison with experiments.Advances in Water Resources 2005;28(3):203-14.
Bond A,English M,Millard A,Nakama S,Chengyuan Z,Garitte B.Approaches for representing hydro-mechanical coupling between sub-surface excavations and argillaceous porous media at the Ventilation Experiment,Mont Terri.Journal of Rock Mechanics and Geotechnical Engineering 2013;5(2),in press.
Bossart P,Nussbaum C.Mont Terri project—heater experiment,engineered barrier emplacement and ventilation experiment.Wabern:Federal Office of Topography Swisstopo;2007.
Busenberg E,Plummer LN.A comparative study of the dissolution and crystal growth kinetics of calcite and aragonite.In:Mumpton F,editor.Studies in diagenesis.Washington:U.S.Geological Survey Bulletin;1986.p.139-68.
Commissariat à l’Energie Atomique(CEA).Cast3M. <http://www-cast3m.cea.fr/cast3m/index.jsp>;2008[accessed 10.02.12].
Fernandez AM,Melon AM,Villar MV,Turrero MJ.Geochemical characterisation of the rock samples for the VE-test before a second cycle of drying.Ventilation test phase II.NF-PRO Deliverable D 4.3.5,Marid,Spain;2007.
Fernandez AM,Villar MV,Melon AM.Geochemical characterisation of the rock samples for the VE-test after a second cycle of drying.NF-PRO Deliverable D4.3.26.Marid,Spain;2007.
Garitte B,Bond A,Millard A,Zhang C,Mcdermott C,Nakama S,Gens A.Analysis of hydromechanical processes in a ventilated tunnel in an argillaceous rock on the basis of different modelling approaches.Journal of Rock Mechanics and Geotechnical Engineering 2013;5(1):1-17.
Harvie CE,Mφller N,Weare JH.The prediction of mineral solubilities in natural waters:the Na-K-Mg-Ca-H-Cl-SO4-OH-HCO3-CO3-CO2-H2O system to high ionic strengths at 25°C.Geochimica et Cosmochimica Acta 1984;48(4):723-51.Johnson J,Anderson G,Parkhurst D.Database “thermo.com.V8.R6.230”.Rev.1.11.Livermore,CA:Lawrence Livermore National Laboratory;2000.
Maul PR.The Quintessa multiphysics general-purpose code QPAC.Quintessa Report QRS-QPAC-11,Warrington,UK;2010.
McKibben MA.Kinetics of aqueous oxidation of pyrite by ferric iron,oxygen and hydrogen peroxide from pH 1-4 and 20-40°C.Dissertation,Pennsylvania State University;1984.
Moses CO,Herman JS.Pyrite oxidation at circum-neutral pH.Geochimica et Cosmochimica Acta 1991;55:471-82.
Nicholson RV,Gillham RW,Reardon EJ.Pyrite oxidation in carbonate-buffered solution:I.Experimental kinetics.Geochimica et Cosmochimica Acta 1988;52:1077-85.
Pearson FJ.Geochemical and other porosity types in clay-rich rocks.In:Arehart GB,Huston JR,editors.Water-rock interaction.Rotterdam:A.A.Balkema;1998.p.259-62.
Savage D,Benbow S,Watson C,Takase H,Ono K,Oda C,et al.Natural systems evidence for the alteration of clay under alkaline conditions:an example from Searles Lake,California.Applied Clay Science 2010;47(1/2):72-81.
Smith EE,Shumate KS.Sul fide to sulfate reaction mechanism.Water Qual.Admin.Water Poll.Contrl.Res.Study#14010-FPS-02-70;1970.
Verpeaux P,Millard A,Charras T,Combescure A.Hadjian H,editor.A modern approach of large computer codes for structural analysis.Los Angeles,USA:AASMiRT;1989.p.75-85.
Williamson MA,Rimstidt JD.The kinetics and electrochemical rate-determining step of aqueous pyrite oxidation.Geochimicaet Cosmochimica Acta 1994;58(24):5443-54.
Zhu C,Anderson G.Environmental applications of geochemical modelling.Cambridge,UK:Cambridge University Press;2002.