The Distribution and Variability of Simulated Chlorophyll Concentration over the Tropical Indian Ocean from Five CMIP5 Models
LIU Lin*, FENG Lin, YU Weidong, WANG Huiwu, LIU Yanliang, and SUN Shuangwen
The Distribution and Variability of Simulated Chlorophyll Concentration over the Tropical Indian Ocean from Five CMIP5 Models
LIU Lin, FENG Lin, YU Weidong, WANG Huiwu, LIU Yanliang, and SUN Shuangwen
,,,266061,
Performances of 5 models from the Coupled Model Intercomparison Project Phase 5 (CMIP5) in simulating the chlorophyll concentration over the tropical Indian Ocean are evaluated. Results show that these models are able to capture the dominant spatial distribution of observed chlorophyll concentration and reproduce the maximum chlorophyll concentration over the western part of the Arabian Sea, around the tip of the Indian subcontinent, and in the southeast tropical Indian Ocean. The seasonal evolution of chlorophyll concentration over these regions is also reproduced with significant amplitude diversity among models. All of 5 models is able to simulate the interannual variability of chlorophyll concentration. The maximum interannual variation occurs at the same regions where the maximum climatological chlorophyll concentration is located. Further analysis also reveals that the Indian Ocean Dipole events have great impact on chlorophyll concentration in the tropical Indian Ocean. In the general successful simulation of chlorophyll concentration, most of the CMIP5 models present higher than normal chlorophyll concentration in the eastern equatorial Indian Ocean.
Indian Ocean; chlorophyll concentration; climatology; seasonal variability; interannual variability
1 Introduction
Primary production is an important part of the carbon cycle in the Earth system. However, it is difficult to quantify primary production at this scale because of the variety of habitats and the impact of weather conditions on the earth. Oceans occupy over 2/3 of the Earth’s surface and play an important role in climate (Li, 2006; Wang, 2009, 2012; Wang and Wang, 2012). In the ocean, the physical, chemical, and biological processes are closely linked (Tang, 2002; Xiu and Liu, 2006), which greatly influences ocean dynamics and air-sea interaction. Marine primary production can be assessed directly using field flux measurements. However, it can be costly to carry out these measurements. As an alternative, sea surface chlorophyll is often used in models of photosynthesis to study the marine primary production because of its easy accessibility from the world ocean database. Examples include a number of chlorophyll studies in the tropical Indian Ocean (Tang, 2002; Dey and Singh, 2003; Vinayachandran, 2004; Susanto and Marra, 2005; Sarma, 2006; Lévy, 2007; Sarangi, 2008; Liu, 2012; Li, 2012).
Similar to the Pacific Ocean, the Indian Ocean possesses strong interannual variability. The Indian Ocean Dipole (IOD) is a basin-scale ocean–atmosphere coupled mode in the interannual time scale, characterized by a zonal contrast of a positive and a negative sea surface temperature anomaly (SSTA) along the equatorial Indian Ocean and a zonal wind anomaly over the central equatorial Indian Ocean (Saji, 1999; Webster, 1999; Hu and Liu, 2005; Yu, 2005; Sun, 2010; Liu, 2011). A number of studies show that the convection associated with IOD exert great impact on the climate variability in Africa, South Asia, East Asia, and other remote regions (Saji and Yamagata, 2003a, b; Ashok, 2004; Behera, 2005; Matthew, 2006; Wang, 2006). IOD events are a key to understand the underlying mechanisms responsible for climate change as well as biochemical processes in the tropical Indian Ocean. Sarma (2006) pointed out the close relationships between chlorophyll and SSTA, and between chlorophyll and sea surface height anomaly in the Arabian Sea during IOD events. Rahul Chand Reddy and Salvekar (2008) and Wiggert(2009) demonstrated the close relationships between chlorophyll concentration in the southeast, tropical Indian Ocean and IOD events respectively.
Although many researches have focused on chlorophyll in the tropical Indian Ocean via direct observations as well as remote sensing outputs, numerical simulations of chlorophyll is lagging behind. The CMIP5 models have the capability in generating bio-chemical parameters, providing a good chance to assess the numerical models’ performances on simulating chlorophyll concentration. By using 5 of CMIP5 models this study evaluates the simulated chlorophyll in the tropical Indian Ocean.
2 Data
The primary datasets used for this study are the output from five CMIP5 models (HadGEM2-CC, HadGEM2-ES, MPI-ESM-LR, IPSL-CM5A-MR, CanESM2). The model variables include sea surface temperature and chlorophyll concentration under the Climate of the Twentieth-Century Experiment (20c3M, a historical run). The forcings of this experiment include greenhouse gases (CO, CH, NO, and CFCs), sulfate aerosol direct effects, volcanoes, and solar forcing (Taylor, 2012; http://cmip-pcmdi.llnl. gov/cmip5/). The simulated chlorophyll concentration be- tween January 1998 and December 2005 is used to compare with observations. And the climatological annual cycle is calculated based on this period. A longer period from January 1850 to December 2005 is also chosen for the interannual variability analysis and the interannual anomalies are obtained by subtracting the monthly mean variables from their respective climatological annual cycles.
For comparison with observations, ocean color data are applied. Surface chlorophyll concentration is derived from the measurements by the Sea-viewing Wide Field-of-view Sensor (SeaWiFS) (McClain, 1998, 2004). In the present research, the 9km resolution 8-day mean data are downloaded from the Earth Sciences Data and Information Services Center (http://disc.sci.gsfc.nasa.gov/giovanni/overview/index.html) to calculate the monthly mean data between January 1998 and December 2005.
3 Mean State and Seasonal Variation
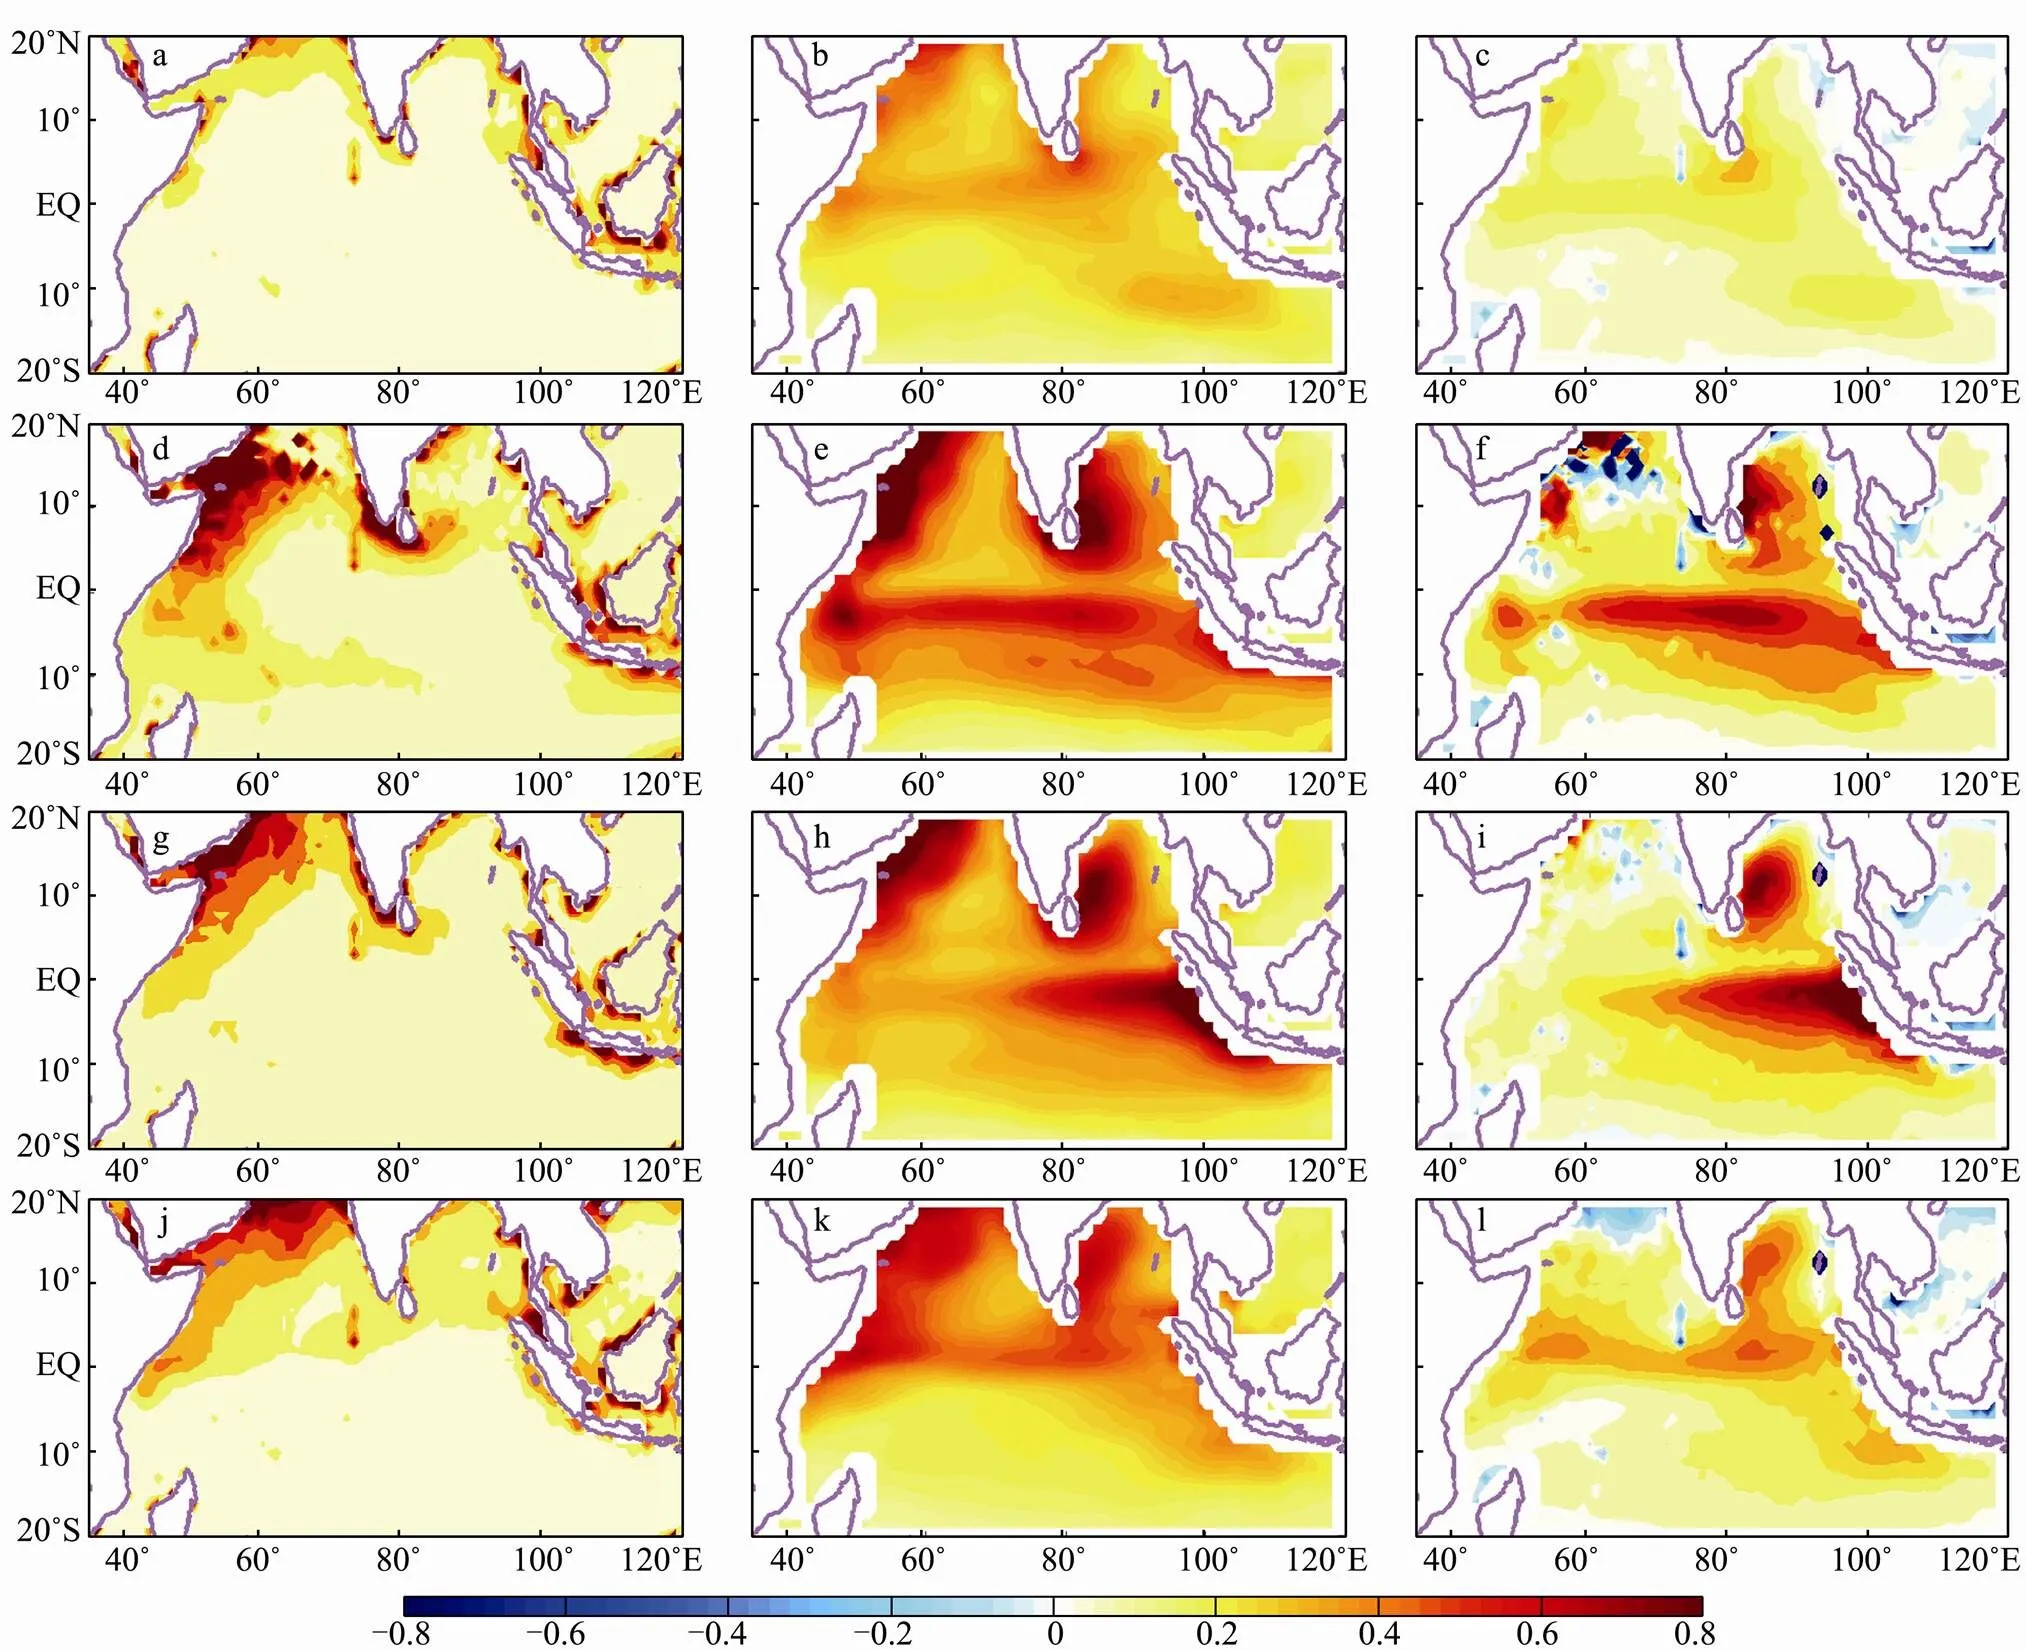
Fig.1 shows the annual mean chlorophyll distribution from the observations and the CMIP5 models and their difference. The pattern correlation coefficient between them is 0.46, which is significant at the 99% confidence level. It is obvious that the CMIP5 ensemble mean over-estimates chlorophyll concentration in most part of the tropical Indian Ocean. Compared with the observations, the chlorophyll concentration simulated in the eastern part of the tropical Indian Ocean is higher than that in the western part, especially in the western part of the Bay of Bengal, where the ensemble mean maximum value reaches 0.6mgm. The area with the maximum value expands from the western part of the Bay of Bengal into the southeast Indian Ocean. It is also observed that the chlorophyll concentration in the central Arabian Sea is lower than the observations. Anyhow, the CMIP5 simulations reproduce the peak chlorophyll concentrations around the coastal area of the west Arabian Sea (50˚E–60˚E, 10˚N–20˚N), the tip of the Indian subcontinent (75˚E–85˚E, 5˚N–10˚N), and the southeast Indian Ocean off Sumatra (90˚E–110˚E, 1˚S–10˚S). Regardless of the different simulated annual mean intensity, all the CMIP5 models exhibit a common character, that is, the ensemble mean seasonal distribution of chlorophyll concentration is able to capture the major features of the observations except for the higher values in most of the tropical Indian Ocean (Fig.2). The pattern correlation coefficient between observations and the CMIP5 ensemble mean is 0.11, 0.49, 0.38, and 0.46 for boreal spring, summer, fall, and winter, respectively, which are all significant at the 99% confidence level. In boreal summer and fall, the ensemble mean chlorophyll concentration is much higher than the observations in the equatorial Indian Ocean as well as the western part of the Bay of Bengal. The maximum value of the ensemble mean chlorophyll concentration is around 0.8mgm. During boreal spring and winter, with moderately higher chlorophyll concentration in the equatorial Indian Ocean, the simulated chlorophyll is in a better agreement with the observations generally.
The seasonal variations of chlorophyll concentration in the three regions,, the coastal area of the west Arabian Sea, the tip of the Indian subcontinent, and the southeast Indian Ocean off Sumatra, show that the phase-locking phenomenon can be well captured by the CMIP5 models, regardless of the lower simulated chlorophyll concentration in the Arabian Sea and around the tip of the Indian subcontinent, and the higher simulated concentration in the southeast Indian Ocean (Fig.3). The peak chlorophyll concentration of 3mgmoccurs during boreal summer in the Arabian Sea. Except for MPI-ESM-LR, which simulates rather higher chlorophyll concentration with the peak value over 6mgm, the other four models all show lower chlorophyll concentration, especially IPSL-CM5A-LR, which simulates the minimum value around 0.4mgm. Similar to that in the Arabian Sea, the simulated peak chlorophyll concentration around the tip of the Indian subcontinent also occurs in summer. However, their performances are not so good considering the evolution of chlorophyll concentration in each model. MPI-ESM-LR shows too strong peak value and variability, while other four models show too weak peak value, with IPSL-CM5A-LR presenting nearly no variability. Moreover, the peak times are not precise enough, with the result that none of them can reproduce the observed high chlorophyll concentration in July and August. The boreal summer is the prevailing season for the Asian summer monsoon, which flows from the southern to northern hemisphere and favors upwelling along the coast of the west Arabian Sea and around the tip of the Indian subcontinent. The upwelling carries nutrients from the deep ocean to the sea surface and results in the increasing of surface chlorophyll concentration.

Fig.1 The annual mean chlorophyll concentration distribution obtained from (a) observations, (b) CMIP5 ensemble mean, and (c) the difference between them. The unit is mgm-3.

Fig.2 Seasonal mean (from top to bottom, for spring, summer, autumn and winter) chlorophyll concentration distribution obtained from observations (left column), CMIP5 ensemble mean (middle column), and the differences between them (right column). The unit is mgm-3.

Fig.3 Temporal evolution of chlorophyll concentration from observations (black), CMIP5 ensemble mean (dash), and each individual model around (a) the western part of the Arabian Sea, (b) the tip of the Indian subcontinent, and (c) the southeast Indian Ocean.
As is different from other regions in the Indian Ocean, the peak chlorophyll concentration in the southeast Indian Ocean occurs during the boreal fall. Similar features can be found from the CMIP5 models. CanESM2 and IPSL-CM5A-LR simulate lower and the other three models higher chlorophyll concentration than the observed in this region.
4 Interannual Variability
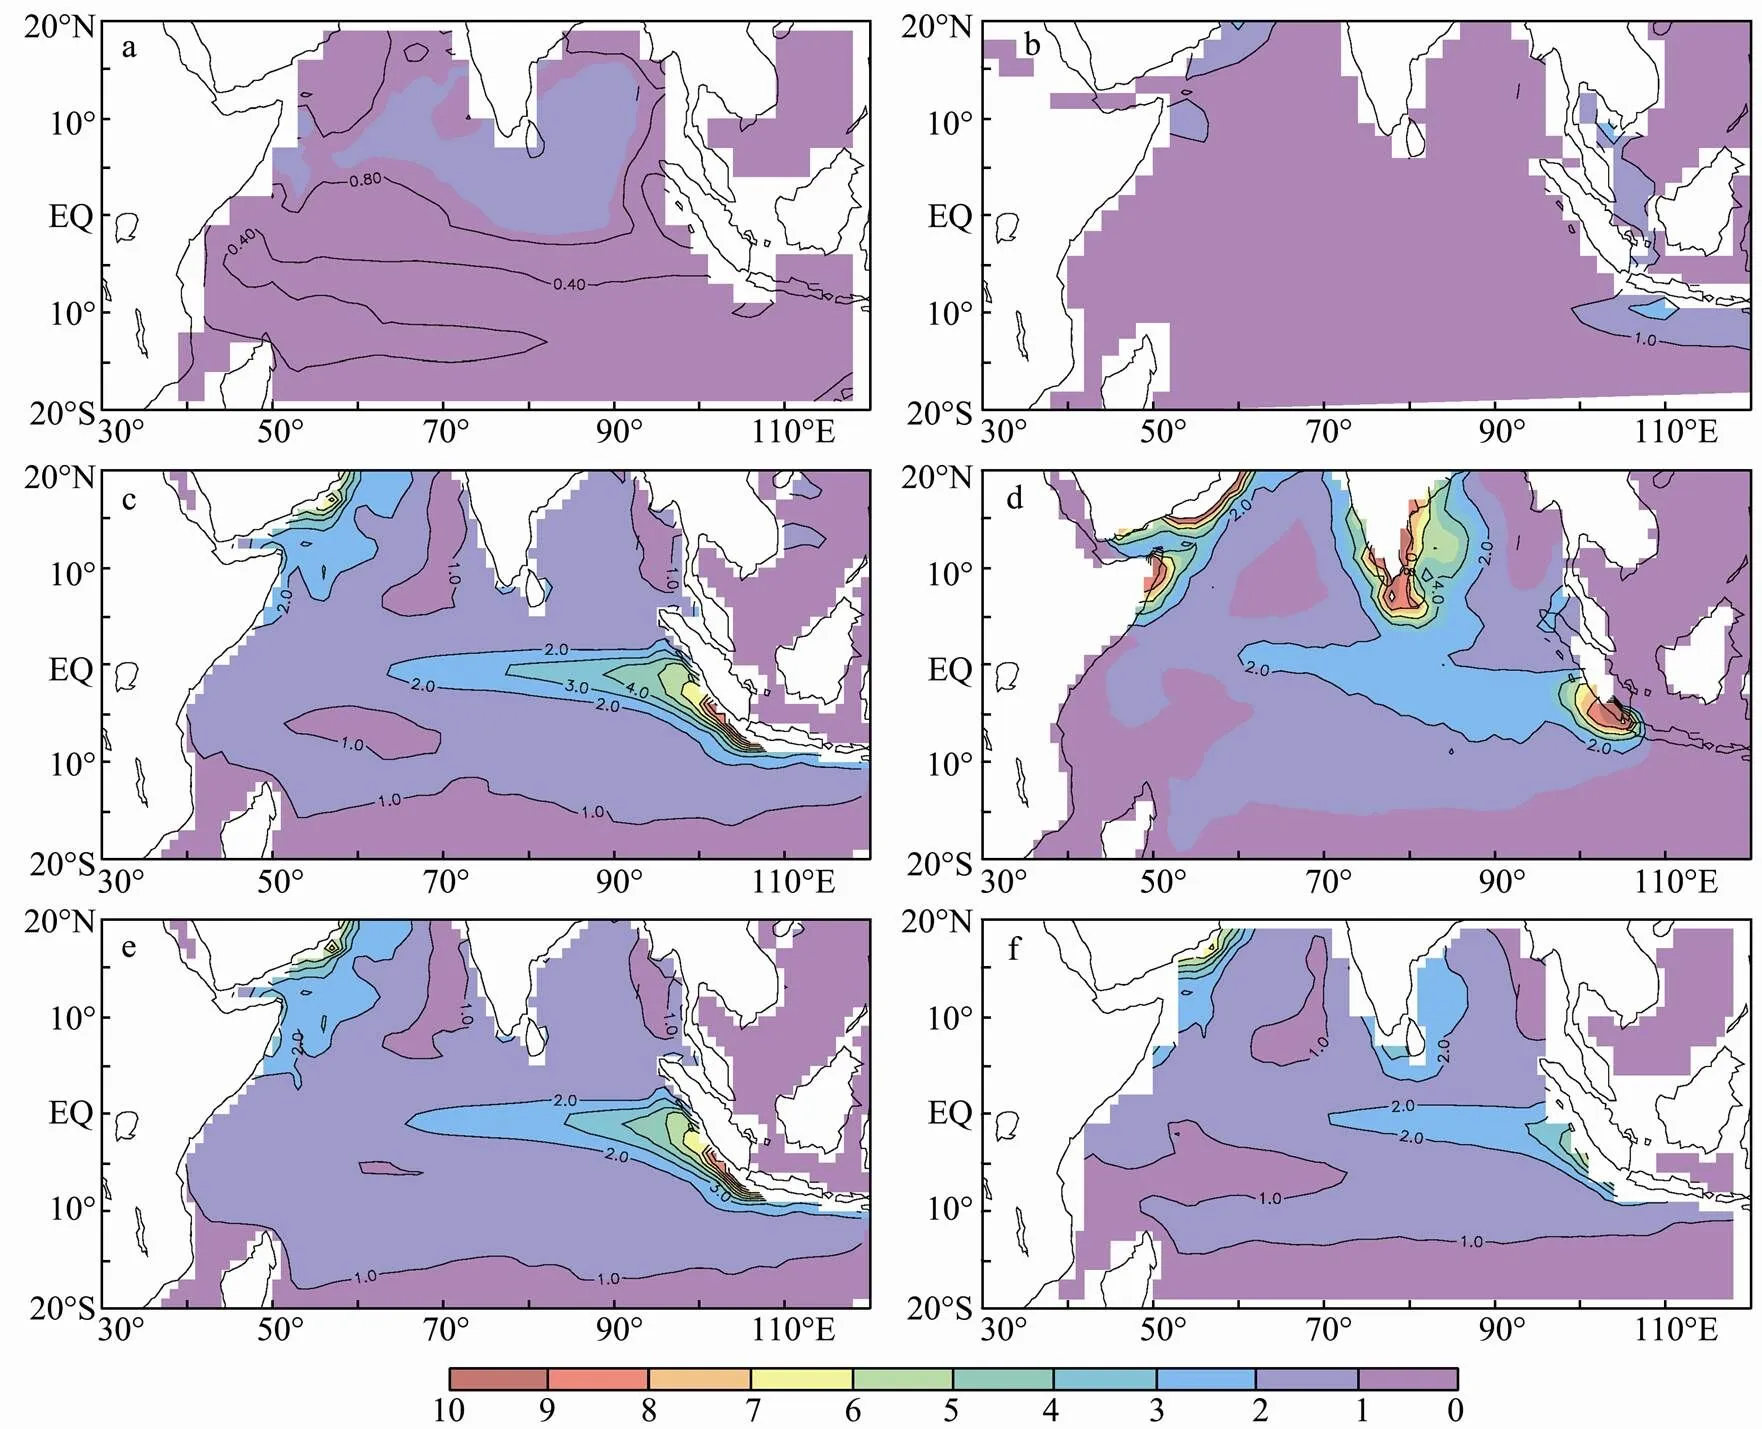
Fig.4 shows the standard deviation of chlorophyll concentration anomalies in the tropical Indian Ocean at the interannual time scale. Spatial distributions of the chlorophyll concentration anomalies are quite different. The ensemble mean results show that strong variability occurs in the western part of the Arabian Sea, around the tip of the Indian subcontinent and in the southeast Indian Ocean. The large chlorophyll variability in the south hemisphere extends from the east equatorial region to the north of Madagascar. Except IPSL-CM5A-MR, the other four CMIP5 models all display three regions with the maximum chlorophyll concentration variations mentioned previously, which illustrates that both seasonal and interannual variability of chlorophyll concentration occurs strong in those regions.

Fig.4 Standard deviation of chlorophyll concentration in the tropical Indian Ocean for (a) CanESM2, (b) HadGEM2-CC, (c) HadGEM2-ES, (d) IPSL-CM5A-MR, (e) MPI-ESM-LR, and (f) ensemble mean. The unit is mgm-3.
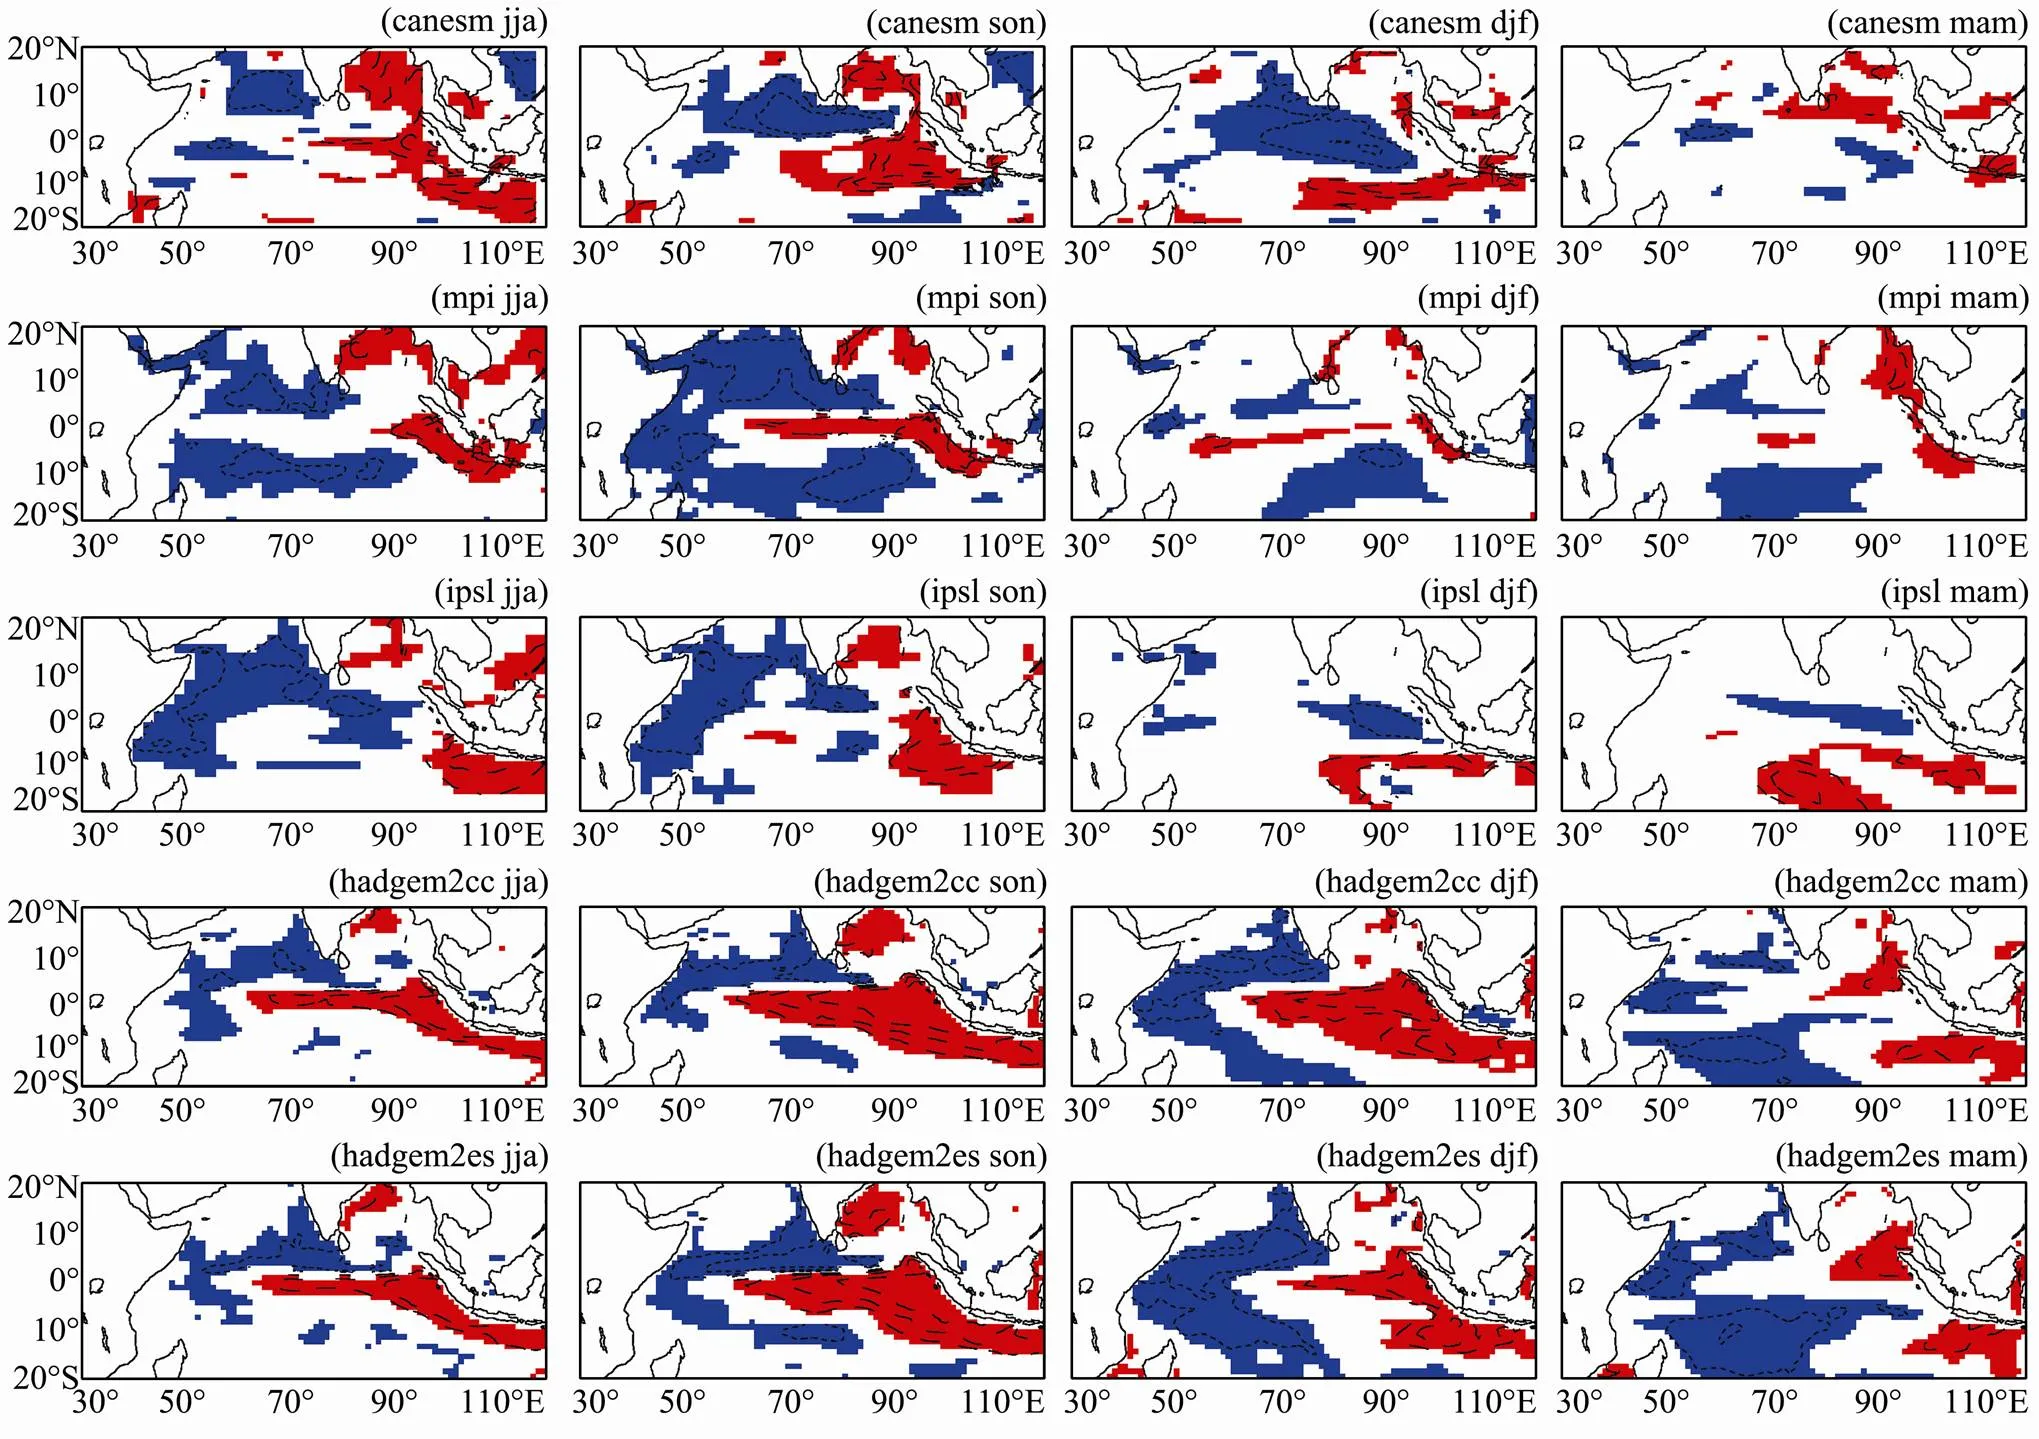
The IOD events show the most significant interannual variability in the tropical Indian Ocean during boreal summer and fall. Through adjusting the ocean upwelling and the relevant sea surface conditions, the IOD events can influence the chlorophyll distribution in the large area of the Indian Ocean (Susanto, 2006). Therefore, it is necessary to check the relationship between IOD and interannual variations of chlorophyll concentration simulated by the CMIP5 models. In Fig.5 are the lead-lag correlation diagrams between the chlorophyll concentration and simulated IOD index defined as the SSTA gradient between the western and eastern part of the Indian Ocean (Saji, 1999). It is found that the five CMIP5 models present significant relationship between chlorophyll concentration and IOD events in boreal summer and fall seasons. During a positive IOD event, with negative SSTA in the southeast Indian Ocean, the higher (lower) chlorophyll concentration appears in the eastern (western) part of the tropical Indian Ocean. Since IOD events peak in fall and decay in winter, the significant correlation lasts into winter as seen in the HadGEM2CC and HadGEM- 2ES results; the other models did not capture this feature.

Fig.5 Lead-lag correlation between the IOD index in boreal fall and the chlorophyll concentration in boreal summer, fall, winter and the subsequent spring (from left to right) for each individual model (from top to bottom). Shaded areas indicate the correlation with a confidence level more than 95%.
5 Summary
In the tropical ocean where solar radiation is not a limiting factor, chlorophyll-concentration reflects the strength of nutrient flux into the mixed layer by the equatorial upwelling (Longhurst, 1993). During the southeast monsoon season (April to October), the southeast wind from Australia generates upwelling and brings cooler water and nutrients to the surface along the southern coasts of Java and Sumatra. Conditions are reversed during the northwest monsoon season (October to April). Coastally trapped Kelvin waves, generated along the equatorial Indian Ocean during the monsoon transitions (April and October), also affect upwelling and downwelling processes (Arief and Murray, 1996; Clarke and Liu, 1993; Sprintall, 2000).
In this study, the performances of simulated chlorophyll from five state-of-art CMIP5 models are assessed. The ensemble mean demonstrates that the coupled models are able to reproduce the dominant features of the observed chlorophyll in the tropical Indian Ocean, with maximum chlorophyll concentrations occurring in the western part of the Arabian Sea, around the tip of the Indian subcontinent, and in the southeast Indian Ocean. Except IPSL-CM5A-MR, the other models all present higher than observed chlorophyll concentration all around the year. The phase-locking feature in the maximum chlorophyll regions and the seasonal variations are also well simulated by the CMIP5 models, though the simulated chlorophyll concentration from each individual model is quite different. Besides, the models work fairly well in reproducing the chlorophyll concentration in regions such as the equatorial Indian Ocean (70˚E–90˚E, 5˚N–10˚S) and the western Bay of Bengal (80˚E–90˚E, 10˚N–20˚N) (Fig.6). However, the simulated chlorophyll concentration shows significant differences in the interannual variability. The model results indicate that there is a significant correlation between IOD events and chlorophyll distribution in boreal summer and fall. This finding implicates the potential role played by the subsurface upwelling process, and shows that the state-of-art coupled models can be a useful tool for the future oceanographic biochemical research in the tropical Indian Ocean. Future studies would focus on further investigating the relationship between chlorophyll concentration variation and upwelling process.
Acknowledgements
We thank the Working Group on Coupled Modeling of the World Climate Research Program for sponsoring CMIP and the climate modeling group for producing and making the model output available for us. The U.S. Department of Energy’s Program for Climate Model Diagnosis and Intercomparison in partnership with the Global Organization for Earth System Science Portals provides coordinating support and lead development of software infrastructure. We also wish to thank L. X. Xu for data preparation. This work was supported by the National Basic Re- search Program of China (2012CB955601, 2010CB950304) and SOA Science Fund for Young Scholars (Grant No. 2011244).
Arief, D., and Murray, S. P., 1996. Low-frequency fluctuations in the Indonesian throughflow through Lombok Strait., 101: 12455-12464.
Ashok, K., Guan, Z., Saji, N. H., and Yamagata, T., 2004. Individual and combined influences of ENSO and Indian Ocean Dipole on the Indian summer monsoon., 17: 3141-3155.
Behera, S. K., Luo, J. J., Masson, S., Delecluse, P., Gualdi, S., and Navarra, A., 2005. Paramount impact of the Indian Ocean Dipole on the east African short rains: A CGCM study., 18: 4514-4530.
Clarke, A. J., and Liu, X., 1993. Observations and dynamics of semiannual and annual sea levels near the eastern Indian Ocean boundary., 23: 386-399.
Dey, S., and Singh, R. P., 2003. Comparison of chlorophyll distributions in the northeastern Arabian Sea and southern Bay of Bengal using IRS-P4 Ocean Color Monitor data., 85: 424-428.
Hu, R. J., and Liu, Q. Y., 2005. A heat budget study on the mechanism of SST variations for the regions of the Indian Ocean Dipole., 4 (4): 167-175.
Lévy, M., Shankar, D., André, J. M., Shenoi, S. S. C., Durand, F., and de Boyer Montégut, C., 2007. Basin-wide seasonal evolution of the Indian Ocean’s phytoplankton blooms., 112, C12014, DOI: 10.1029/2007JC004090.
Li, C. Y., Zhou, W., Jia, X. L., and Wang, X., 2006. Decadal/interdecadal variations of ocean temperature and its impacts on climate., 23: 964-981.
Li, G., Lin, Q., and Ni, G., 2012. Vertical patterns of early summer chlorophyll a concentration in the Indian Ocean with special reference to the variation of deep chlorophyll maximum., 2012, DOI: 10.1155/2012/801248.
Liu, L., Yu, W. D., and Li, T., 2011. Dynamic and thermodynamic air–sea coupling associated with the Indian Ocean Dipole diagnosed from 23 WCRP CMIP3 Models., 24: 4941-4958.
Liu, X., Wang, J., Cheng, X., and Du, Y., 2012. Abnormal upwelling and chlorophyll-concentration off South Vietnam in summer 2007., 117, C07021, DOI: 10.1029/2012JC008052.
Longhurst, A., 1993. Seasonal cooling and blooming in the tropical oceans., 40: 2145-2165.
Matthew, H. E., Caroline, C. U., and Santoso, A., 2006. Interannual rainfall extremes over Southwest Western Australia linked to Indian Ocean climate variability., 19: 1948-1969.
McClain, C. R., Cleave, M. L., Feldman, G. C., Gregg, W. W., Hooker, S. B., and Kuring, N., 1998. Science quality SeaWiFSdata for global biospheric research., 39: 10-16.
McClain, C. R., Feldman, G. C., and Hooker, S. B., 2004. An overview of the SeaWiFS project and strategies for producing a climate research quality global ocean bio-optical time series., 51: 5-42.
Rahul Chand Reddy, P., and Salvekar, P. S., 2008. Phytoplankton blooms induced/sustained by cyclonic eddies during the Indian Ocean Dipole event of 1997 along the southern coasts of Java and Sumatra., 5: 3905-3918, DOI: 10.5194/bgd-5-3905-2008.
Saji, N. H., and Yamagata, T., 2003a. Possible impacts of Indian Ocean Dipole mode events on global climate,25: 151-169.
Saji, N. H., and Yamagata, T., 2003b. Structure of SST and surface wind variability during Indian Ocean Dipole mode years: COADS observations.,16: 2735-2751.
Saji, N. H., Goswami, B. N., Vinayachandran, P. N., and Yamagata, T., 1999. A dipole mode in the tropical Indian Ocean.,401: 360-363.
Sarangi, R. K., Nayak, S., and Panigraphy, R. C., 2008. Monthly variability of chlorophyll and associated physical parameters in the southwest Bay of Bengal water using remote sensing data., 37 (3): 256-266.
Sarma, V. V. S. S., 2006. The influence of Indian Ocean Dipole (IOD) on biogeochemistry of carbon in the Arabian Sea during 1997–1998., 115 (4): 433-450.
Sprintall, J., Gordon, A., Murtugudde, L. R., and Susanto, R. D., 2000. A semi-annual Indian Ocean forced Kelvin waves observed in the Indonesian Seas., 105: 17217-17230.
Sun, S. W., Lan, J., and Wang, Y., 2010. Variations of SST and thermocline depth in the Tropical Indian Ocean during Indian Ocean Dipole events., 2: 120-127.
Susanto, R. D., and Marra, J., 2005. Effect of the 1997/98 El Niño on chlorophyll a variability along the southern coasts of Java and Sumatra., 18 (4): 124-127.
Susanto, R. D., Moore II, T. S., and Marra, J., 2006. Ocean color variability in the Indonesian Seas during the SeaWiFS era.,,, 7, Q05021, DOI: 10.1029/2005GC001009.
Tang, D. L., Kawamura, H., and Luis, J. A., 2002. Short-term variability of phytoplankton blooms associated with a cold eddy on the North-western Arabian Sea., 81 (1): 82-89.
Taylor, K. E., Stouffer, R. J., and Meehl, G. A., 2012. An overview of CMIP5 and the experiment design., 93: 485-498.
Vinayachandran, P. N., Chauhan, P., and Nayak, S. R., 2004. Biological response of the sea around Sri Lanka to summer monsoon., 31, L01302, DOI: 10.1029/2003GL018533.
Wang, C., and Wang, X., 2012. El Niño Modoki I and II classifying by different impacts on rainfall in Southern China and typhoon tracks., DOI: 10.1175/JCLI-D-12-00107.1.
Wang, X., Li, C. Y., and Zhou, W., 2006. Interdecadal variation of the relationship between Indian rainfall and SSTA modes in the Indian Ocean., 26: 595-606.
Wang, X., Wang, D. X., and Zhou, W., 2009. Decadal variability of twentieth century El Niño and La Niña occurrence from observations and IPCC AR4 coupled models., 36, L11701, DOI: 10.1029/2009GL037929.
Wang, X., Wang, D. X., Zhou, W., and Li, C. Y., 2012. Interdecadal modulation of the influence of La Niña events on mei-yu rainfall over the Yangtze River Valley., 29 (1): 157-168, DOI: 10.1007/s00376-011-1021-8.
Webster, P. J., Moore, A. M., Loschnigg, J. P., and Leben, R. R., 1999. Coupled ocean–atmosphere dynamics in the Indian Ocean during 1997–98., 401:356-360.
Wiggert, J. D., Vialard, J., and Behrenfeld, M. J., 2009. Basin-wide modification of dynamical and biogeochemical processes by the positive phase of the Indian Ocean Dipole during the SeaWiFS era.,, Wiggert, J. D., eds., AGU, Washington, D. C., 385-407, DOI: 10.1029/2008GM000776.
Xiu, P., and Liu, Y., 2006. Study on the correlation between chlorophyll maximum and remote sensing data., 5 (3): 213-218.
Yu, W., Xiang, B., Liu, L., and Liu, N., 2005. Understanding the origins of interannual thermocline variations in the tropical Indian Ocean., 32, L24706, DOI: 10.1029/2005GL024327.
(Edited by Xie Jun)
10.1007/s11802-013-2168-y
ISSN 1672-5182, 2013 12 (2): 253-259
. Tel: 0086-532-88961173 E-mail: liul@fio.org.cn
(October 9, 2012; revised November 12, 2012; accepted February 22, 2013)
© Ocean University of China, Science Press and Springer-Verlag Berlin Heidelberg 2013
 Journal of Ocean University of China2013年2期
- Journal of Ocean University of China的其它文章
- Relationships of Interannual Variability Between the Equatorial Pacific and Tropical Indian Ocean in 17 CMIP5 Models
- Influence of Summer Monsoon on Asymmetric Bimodal Pattern of Tropical Cyclogenesis Frequency over the Bay of Bengal
- Formation Mechanism for the Anomalous Anticyclonic Circulation over Northeast Asia and the Japan Sea in Boreal Winter 1997/98 and the Spring of 1998
- Recent Changes of Northern Indian Ocean Summer Rainfall Based on CMIP5 Multi-Model
- Asymmetric Response of the South China Sea SST to El Niño and La Niña
- Southern Ocean SST Variability and Its Relationship with ENSO on Inter-Decadal Time Scales
