Indian Ocean Dipole Response to Global Warming: A Multi-Member Study with CCSM4
ZHOU Zhen-Qiang1), XIE Shang-Ping1), 2), ZHENG Xiao-Tong1), *, and LIU Qinyu1)
Indian Ocean Dipole Response to Global Warming: A Multi-Member Study with CCSM4
ZHOU Zhen-Qiang, XIE Shang-Ping, ZHENG Xiao-Tong, and LIU Qinyu
1),,266100,2),,92093-0230,
Based on a coupled ocean–atmosphere model, the response of the Indian Ocean Dipole (IOD) mode to global warming is investigated with a six member ensemble of simulations for the period 1850–2100. The model can simulate the IOD features realistically, including the east-west dipole pattern and the phase locking in boreal autumn. The ensemble analysis suppresses internal variability and isolates the radiative forced response. In response to increasing greenhouse gases, a weakening of the Walker circulation leads to the easterly wind anomalies in the equatorial Indian Ocean and the shoaling thermocline in the eastern equatorial Indian Ocean (EEIO), and sea surface temperature and precipitation changes show an IOD-like pattern in the equatorial Indian Ocean. Although the thermocline feedback intensifies with shoaling, the interannual variability of the IOD mode surprisingly weakens under global warming. The zonal wind feedback of IOD is found to weaken as well, due to decreased precipitation in the EEIO. Therefore, the atmospheric feedback decreases much more than the oceanic feedback increases, causing the decreased IOD variance in this model.
Indian Ocean Dipole (IOD); multi-member ensemble analysis; global warming; ocean-atmospheric interaction; CCSM4
1 Introduction
The Indian Ocean Dipole (IOD), involving ocean and atmosphere interactions, is a zonal mode of interannual variability in the tropical Indian Ocean (Saji, 1999; Webster, 1999; Murtugudde, 2000). During a positive IOD event, sea surface temperature (SST) is colder than normal in the southeast equatorial Indian Ocean, with weak warm anomalies in the western basin. The dipole events are seasonally phase locked: a positive event starts in May–June, matures in boreal autumn, and decays in boreal winter. The IOD has great influence on climate both locally and remotelyatmospheric teleconnections (Guan and Yamagata, 2003; Yang, 2010; Zheng, 2012).
Although the largest SST anomalies and the most active ocean–atmosphere coupling occur in the eastern part of the Indian Ocean basin, an often-used IOD index measures the east-west SST contrast in the Indian Ocean (Saji, 1999). In response to greenhouse gas (GHG) forcing, climate change could influence IOD properties such as the amplitude and frequency of occurrence. Specifically, the thermocline shoals in the EEIO from limited observations for the past about 50 years (Alory, 2007; Tokinaga, 2012), a thermocline depth change associated with the weakened Walker circulation and reproduced in global warming model simulations (Du and Xie, 2008). By using a coupled model simulation, Zheng(2010, 2013) suggested that this shoaling thermocline leads to an enhanced thermocline feedback, which is counteracted by a reduced zonal wind feedback. Therefore, the IOD variance remains unchanged under global warming.
Previous studies use single-model or multi-models with one-member run (Zheng, 2013). Because the IOD exhibits variability on decadal and multidecadal time scales in addition to its interannual variances (Ihara, 2008), a single run contains pronounced natural modulations of IOD, making it hard to detect GHG-induced changes. The present study examines the IOD variance change under global warming from a coupled model used in the fifth phase of the Coupled Model Intercomparison Project (CMIP5). The six-member simulations during the period of 1850–2100 are analyzed to suppress internal variability. The ensemble mean results show an intensification of thermocline feedback, but an even more reduction of atmospheric feedback. As a result, the IOD variance decreases slightly under global warming.
This paper is organized as follows. Section 2 describes the model and methods. Section 3 analyzes the IOD simulations. Section 4 examines changes in the ocean-atmosphere system in the Indian Ocean under global warming and investigates why the IOD activity does not intensify in a warmer climate. Section 5 is a summary.
2 Model and Methods
This study uses the output of the Community Climate System Model version 4.0 (CCSM4), a global climate model that includes the atmosphere, land, ocean, and sea ice modules. Each of these modules has been improved since the previous release (CCSM3), and detailed information of CCSM4 can be found in Gent(2011). The atmospheric component of CCSM4 is the Community Atmosphere Model, version 4 (CAM4). This component uses the Lin-Rood finite-volume dynamical core (Lin, 2004), with a horizontal resolution of 0.9375˚ latitude×1.25˚ longitude and 26 levels in the vertical. The oceanic component is based on the Parallel Ocean Program, version 2 (POP2; Smith, 2010; Danabasoglu, 2012). The CCSM4 simulations analyzed here include six-member ensemble of historical (1850–2005, referred to as twentieth century) and future (2006–2100, referred to as twenty-first century) simulations. The six-member ensemble is obtained from CMIP5, which was organized by World Climate Research Programme (WCRP) Climate Variability and Predictability (CLIVAR) Working Group Coupled Models (WGCM) Climate Simulation Panel. CMIP5 collected global coupled atmosphere–ocean general circulation model experiments targeted to the twentieth and twenty-first century climate simulations, as well as climate change experiments investigated in the Intergovernmental Panel on Climate Change (IPCC) Fifth Assessment Report (AR5). The twentieth century simulation is described and assessed in Gent(2011) and the representative concentration projection 8.5 (RCP8.5) (Moss, 2010) is used for the twenty-first century simulation. Both simulations are combined to form a six-member ensemble, a 251-year long ‘global warming run’, and the IOD response to global warming is examined. The model simulation is evaluated using the historical run.
This study focuses on changes due to global warming and the ensemble mean to suppress internal variability is calculated. To focus on interannual variability, a nine-year running average is performed to reduce decadal and longer variations and a three-month running mean is calculated to remove intraseasonal variability. Interannual variance is calculated in 50-year sliding windows (, years 1–50, 2–51, and so on) to examine multidecadal modulations of the interannual IOD variability. The regression analysis method is used to evaluate ocean-atmospheric feedback.
3 IOD Simulations
First, an empirical orthogonal function (EOF) analysis is conducted to examine the IOD simulations. Fig.1 shows the leading modes of interannual SST variability over the tropical Indian Ocean (TIO) based on the 156-year-long historical run. In this model, the first and second modes contribute 28% and 24% of variance, respectively. The first EOF mode exhibits a basin-wide warming. The correlation between the basin mode and the Niño-3.4 SST index peaks during the simulations, while the basin mode lags the Niño-3.4 SST index by 4 months. Klein(1999), Du(2009), and Chowdary(2012) indicated that the first EOF mode is forced by ENSO. Xie(2002) also reported that the enhanced warming in the southwest TIO is due to ocean Rossby wave propagation over the thermocline ridge. The second EOF mode exhibits an east-west dipole pattern with easterly wind anomalies along the equator. During June–October, the maximum negative SST anomalies appear along the Java-Sumatra coast where the wind-forced upwelling occurs. The EOF results are comparable with the observations. SST anomalies in the EEIO are highly correlated with the time series of the second EOF mode at 0.9. Here the standard deviation of SST anomalies in the EEIO during September–November (SON;()) is used to represent the IOD intensity.
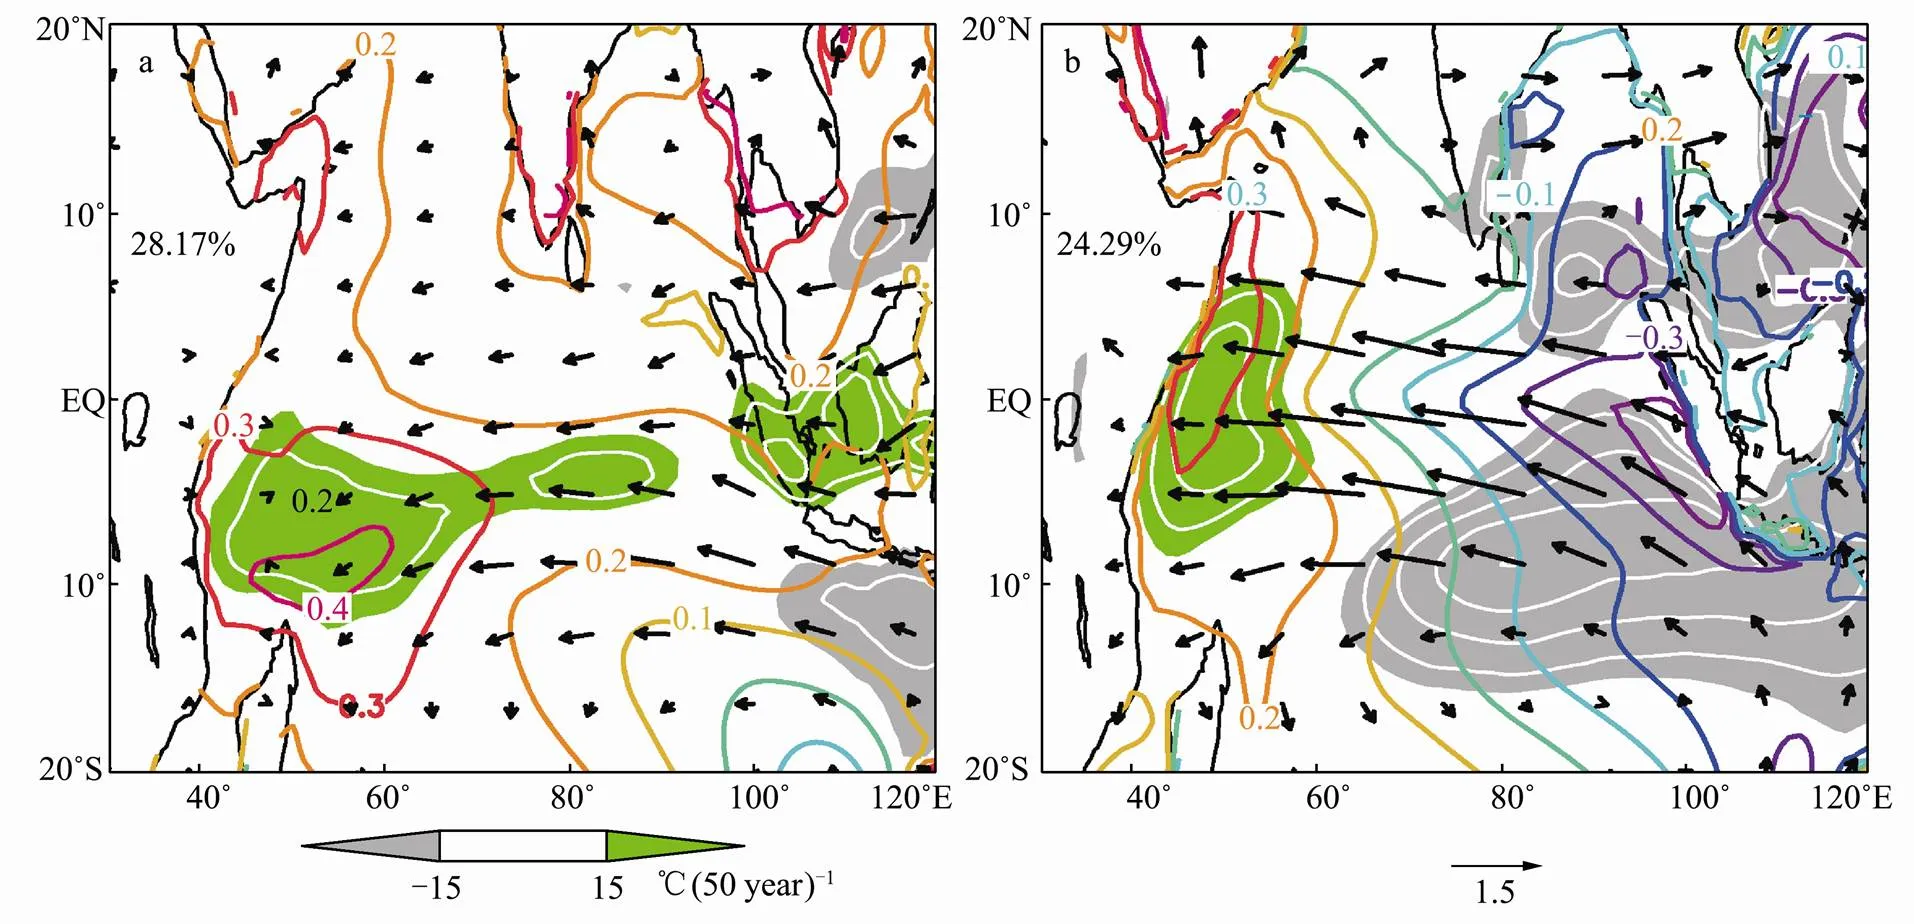
Fig.1(a) 1st and (b) 2nd EOF modes of SST variability in the tropical Indian Ocean (contour internal (CI) 0.1℃), superimposed with the regression of surface wind velocity (ms) and precipitation (green/gray shade and white contours, CI 10mmmon).
In addition to the spatial pattern, the model captures the IOD phase-locking feature very well. Fig.2 shows monthly standard deviations of SST, precipitation, and sea surface height (SSH) in the EEIO, all displaying pronounced seasonality. SST variance is strong from August to October, occurring one month earlier than that in the observations. Precipitation variance is strong from September to November, consistent with the observations. The peak of SSH variance, appearing in October–November, lags SST variance by 2–3 months, a time delay due to the equatorial wave propagation (Yuan and Han, 2006).
The positive phase of IOD is associated with easterly wind anomalies in the central basin and SST cooling in the EEIO. Fig.3 shows the scatter diagram of SST and SSH in the EEIO during SON for the six ensemble members. The SST/SSH slope is very close between negative and positive anomalies. The standard deviation of SON-mean SST in EEIO is 0.17 (0.16) for negative (positive) anomalies. The negative extreme is a little higher than −1.5℃ (only in some extreme years, not significant) and the positive one is lower than 1.5℃ for the 101-year (1900–2000) historical run. Therefore the IOD skewness calculated in this model is not very obvious. Previous studies suggested that the asymmetry of IOD is related to the relatively deep thermocline in the EEIO region (Zheng, 2010, 2013; Ogata, 2012). Here it is suspected that a very shallow thermocline in EEIO may be the reason for the weak asymmetry.
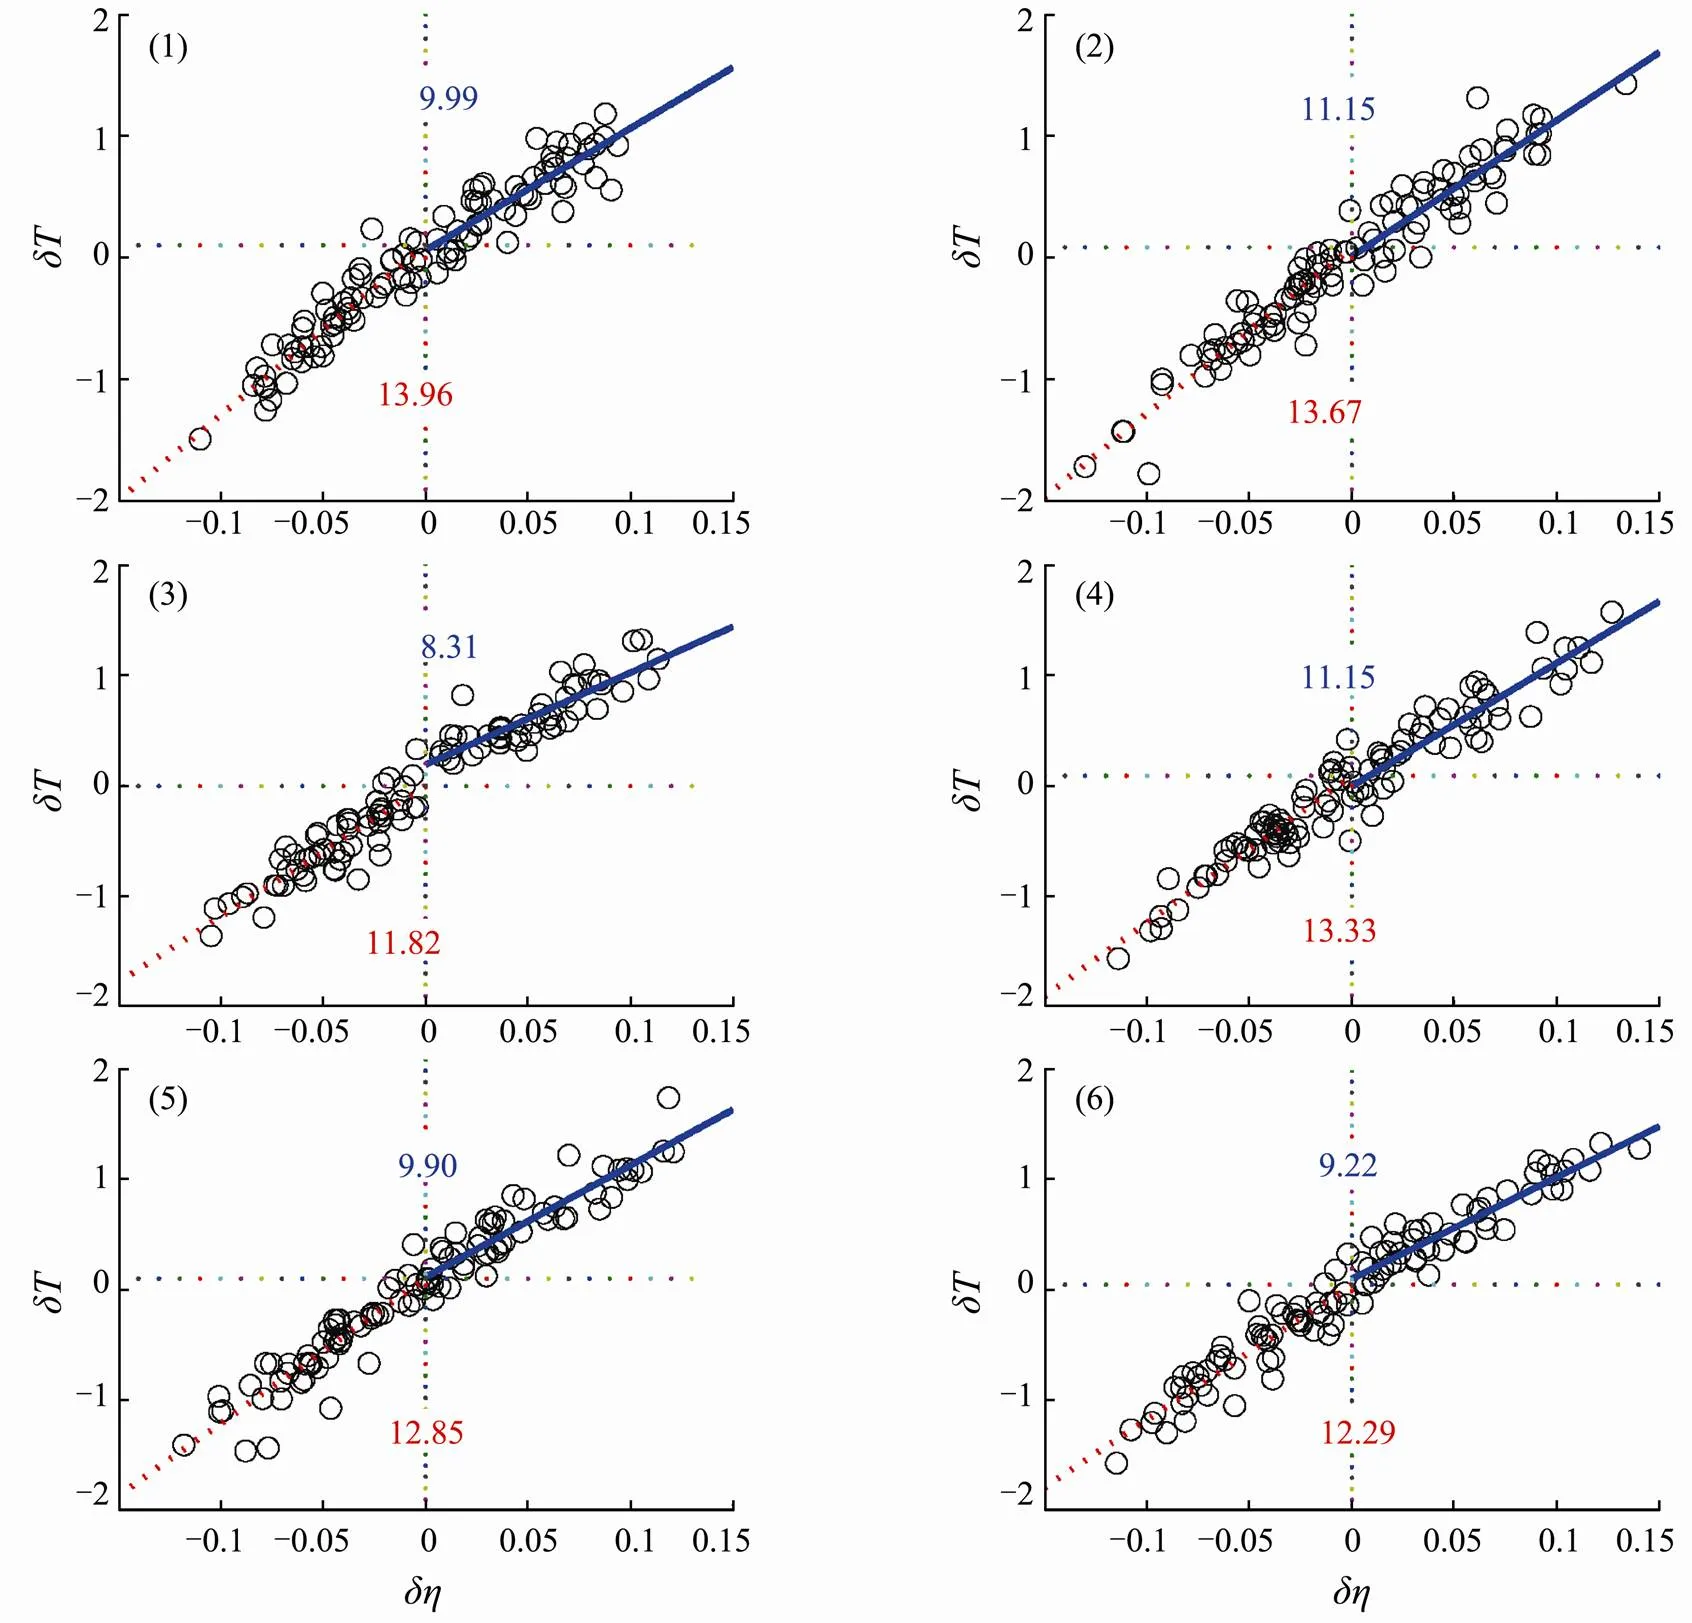
Fig.3 Scatter diagram of interannual SSH (η, m) and SST (℃) anomalies in the EEIO for SON during 1900–2000. The solid (blue) and dashed (red) lines denote the linear regressions for positive and negative SSH anomalies of six model runs, respectively.
4 IOD Changes Under Global Warming
This section examines IOD variability under global warming based on a six-member CCSM4 analysis. The ensemble mean is calculated to remove the natural low-frequency variability and the IOD response to global warming is extracted.
4.1 Mean State Change
Fig.4 shows the change in the TIO climatology between the 20th and 21st centuries for SON. The climate warming results in a SST increase of 2.2℃off the Indo-nesian coast, whereas the increase is 3℃ in the northwest TIO. Associated with this SST warming pattern is a dipole of precipitation with negative (positive) in the southeast (northwest) basin. The SST-precipitation relationship is consistent with the hypothesis of Xie(2010) that the SST change relative to the tropical mean warming determines changes in convective instability and tropical rainfall. Surface wind changes are consistent with those in precipitation, SST, the weakened Walker circulation, and strong southeasterly wind anomalies (>2ms) on the equator. The easterly wind shoals the thermocline in the east on the equator, and cools SST there via upwelling. The pattern of ocean-atmospheric changes is indicative of the Bjerknes feedback.
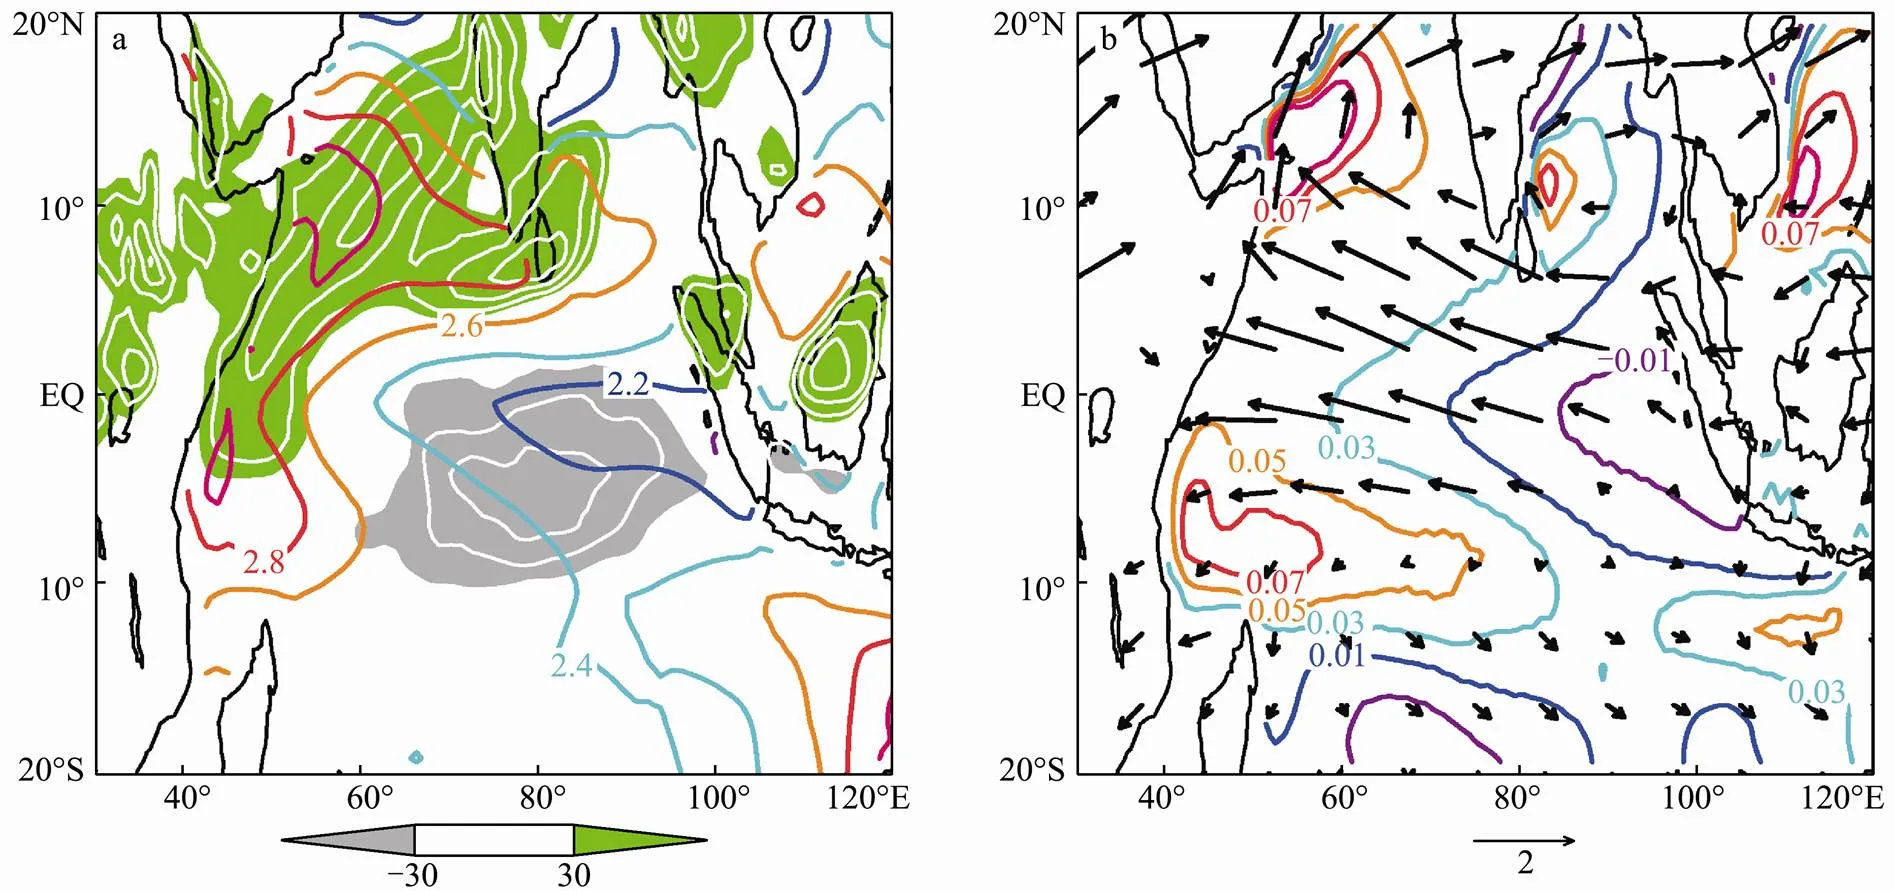
Fig.4 The ensemble mean differences between the 21st and the 20th century in CCSM4 for SON: (a) SST (CI 0.2℃) and precipitation (green/gray shade and white contours at CI 20mmmon-1 for positive and 10mmmon-1 for negative) and (b) sea surface height (CI 0.02m) and surface wind velocity (ms-1).
4.2 Change of IOD Strength
Fig.5 shows the standard deviations of EEIO, DMI and Nino3.4 in 50-year sliding windows for SON. The standard deviation of DMI decreases by about 9% from about 0.8℃ in the 20th century to about 0.73℃ in the 21st century. The standard deviation of Niño-3.4 decreases by about 10% from about 1℃ in the 20th century to about 0.9℃ in the 21st century. The inter-member variability (gray shading) of DMI indicates that the IOD variance decrease is significant as the minimum value in the 20th century is larger than the maximum value in the 21st century, while the ENSO change under global warming is not significant. Therefore, the IOD change is not simply a passive response to the ENSO change. Change in the standard deviation of EEIO is consistent with that of DMI. Therefore, the east pole of IOD contributes to a large part of the DMI variation, and a small part of which is also associated with mean state change as shown in Fig.4.
Fig.6 shows the regressions and correlations between DMI and Niño-3.4 for six members in 50-year sliding windows during SON. IOD is highly correlated with ENSO during this period. The mean correlation coefficient between DMI and Niño-3.4 SST varies from 0.6 to 0.7. Both regression and correlation coefficients remain unchanged under global warming compared to their inter-member variability. Nevertheless, the IOD variance significantly decreases from 1980 to 2030 (Fig.5b). The above results indicate that, on the global warming time scale, the IOD change is not determined by ENSO only. The variance in inter-member variability also shows the importance of internal feedback in TIO. In particular, the inter-member variability is low for ENSO but high for IOD in the 21st century. Saji(2006) suggested that the thermocline feedback is strong as the thermocline layer becomes shallow in the EEIO, and the IOD does not entirely depend on the ENSO teleconnective forcing.
4.3 Oceanic and Atmospheric Feedback
To understand the cause of IOD changes, the Bjerknes feedback, consisting of both atmospheric and oceanic feedback, is examined and the thermocline and zonal wind feedback are calculated as oceanic and atmospheric feedback, respectively. Correlation between SST and thermocline anomalies is high off the Sumatra-Java coast and in the southwest TIO (Xie, 2002), clearly indi- cating the thermocline feedback. During a positive IOD year, easterly wind anomalies act as a positive feedback with the shoaling of the thermocline and the intensification of the SST cooling in the EEIO. Here the strength of thermocline feedback is measured quantitatively using the SST() regression upon SSH() ((,)) in the EEIO during the period of September–November. The regression of zonal wind anomalies upon SST anomalies in the EEIO in the central equatorial Indian Ocean (, CEIO, 5˚S–5˚N, 70˚E–90˚E),(,), is conducted to obtain the zonal wind feedback parameter. Fig.7 shows the regressions of SST(EEIO) upon SSH(EEIO) ((,)) and zonal wind in the CEIO upon SST in the EEIO ((,)) for six members in 50-year sliding windows during the SON period. Thermocline feedback increases by about 8% from about 11.5–12℃min the 20th century to about 12.5–13℃min the 21st century (Fig.7a), likely in response to a shoaling thermocline. Although the thermocline feedback intensifies, the IOD variability decreases under global warming. Atmospheric feedback decreases by about 15% from about 3.7–3.9 (ms)/℃ in the 20th century to about 3.2–3.4 (ms)/℃ in the 21st century (Fig.7b). From their inter-member variabilities (gray shadings) it is found that changes in both feedback parameters are significant under global warming. Therefore, the weakened zonal wind feedback counteracts the effect of increased thermocline feedback. In another model, Zheng(2010, 2013) indicated that IOD remains unchanged under global warming as the variations of increased(,) and weakened(,) are very close. The results of this study show that(,) decreases more than(,) increases, indicating the decrease of the IOD variance under global warming.

Fig.5 The standard deviations of (a) EEIO, (b) DMI, and (c) Niño3.4 of six model runs for SON in 50-year sliding windows. The thick blue line indicates the ensemble mean and the gray shade indicates the inter-member standard deviation.
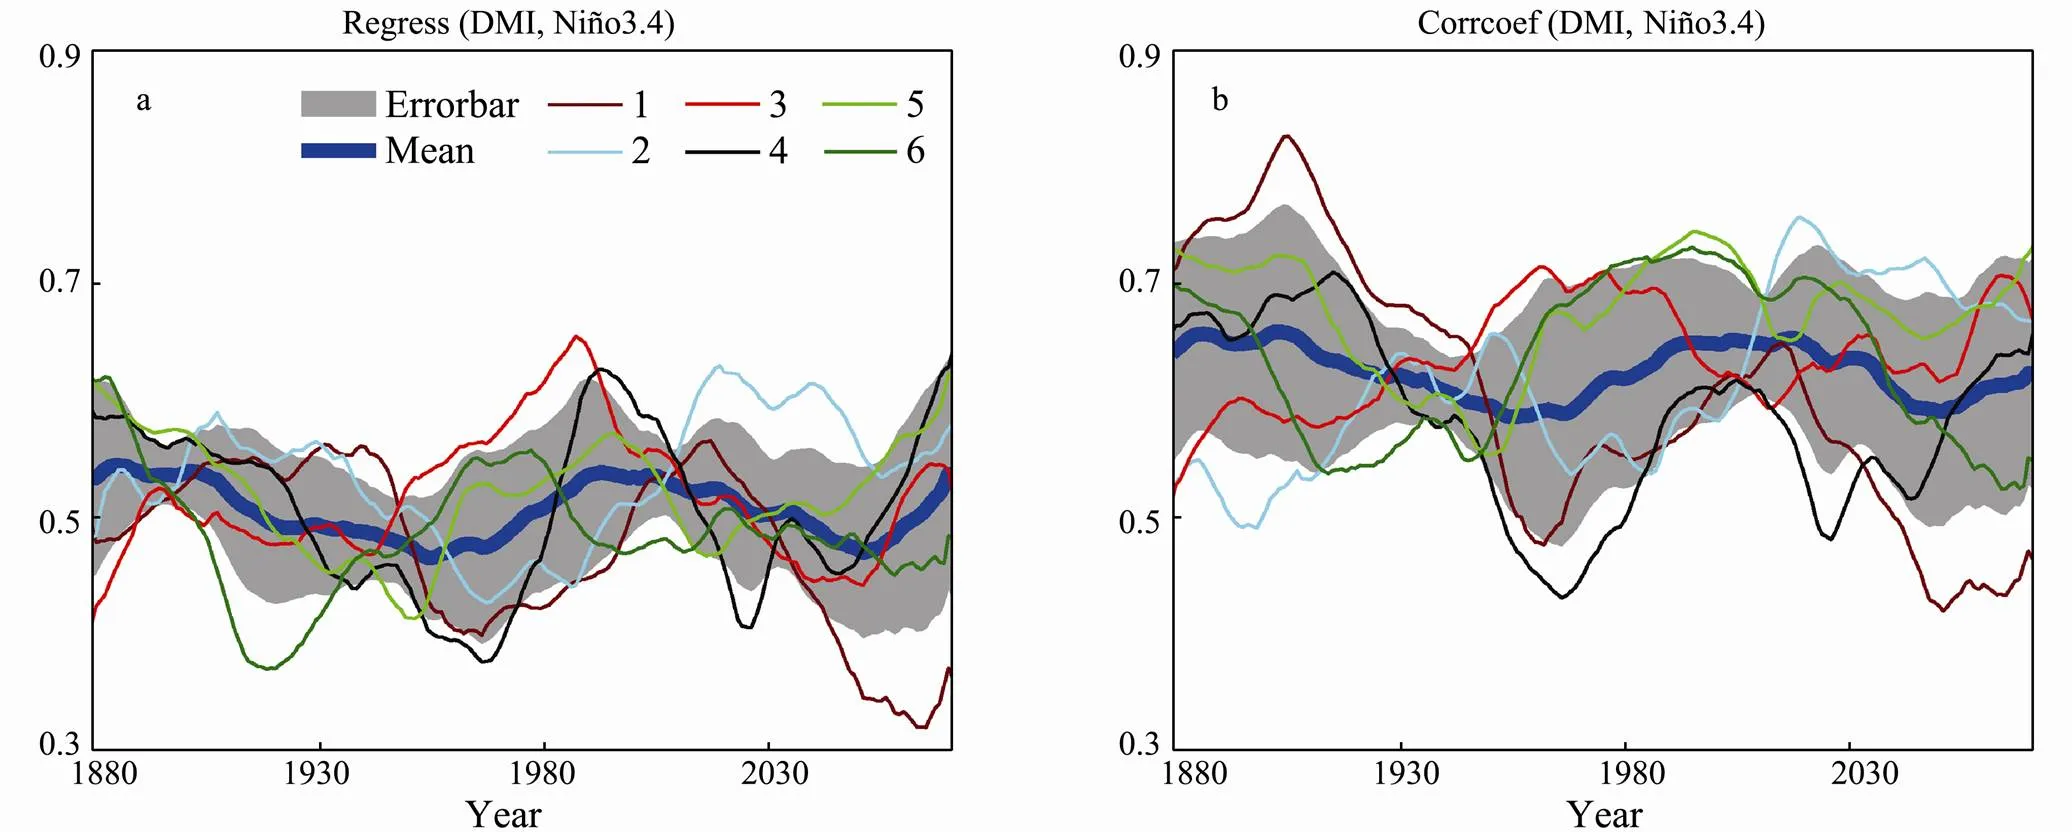
Fig.6 (a) Regression and (b) correlation between DMI and Niño3.4 of six model runs for SON in 50-year sliding windows. The thick blue line indicates the ensemble mean and the gray shade indicates the inter-member standard deviation.
Previous studies suggested that the decrease of zonal wind feedback, reflected by the weakened circulation response to SST anomalies, is due to the increased tropospheric stability (Knutson and Manabe, 1995; Zheng, 2010). The regressions of zonal wind in the CEIO upon precipitation in the EEIO (Fig.8a,(,)) and precipitation upon SST in the EEIO (Fig.8b,(,)) are calculated for six members in 50-year sliding windows during SON, respectively.Both regressions decrease, but compared to the inter-member variability,(,) only has a very slight decrease while(,) decreases significantly under global warming. The CCSM4 results show that both(,) and(,) contribute to the reduced zonal wind feedback, which is consistent with the multi-model simulations (Zheng, 2013).

Fig.7 Regression (a) between SST (EEIO) and SSH (EEIO), and (b) between UAS (CEIO) and SST (EEIO) of six model runs for SON in 50-year sliding windows. The thick blue line indicates the ensemble mean and the gray shade indicates the inter-member standard deviation.
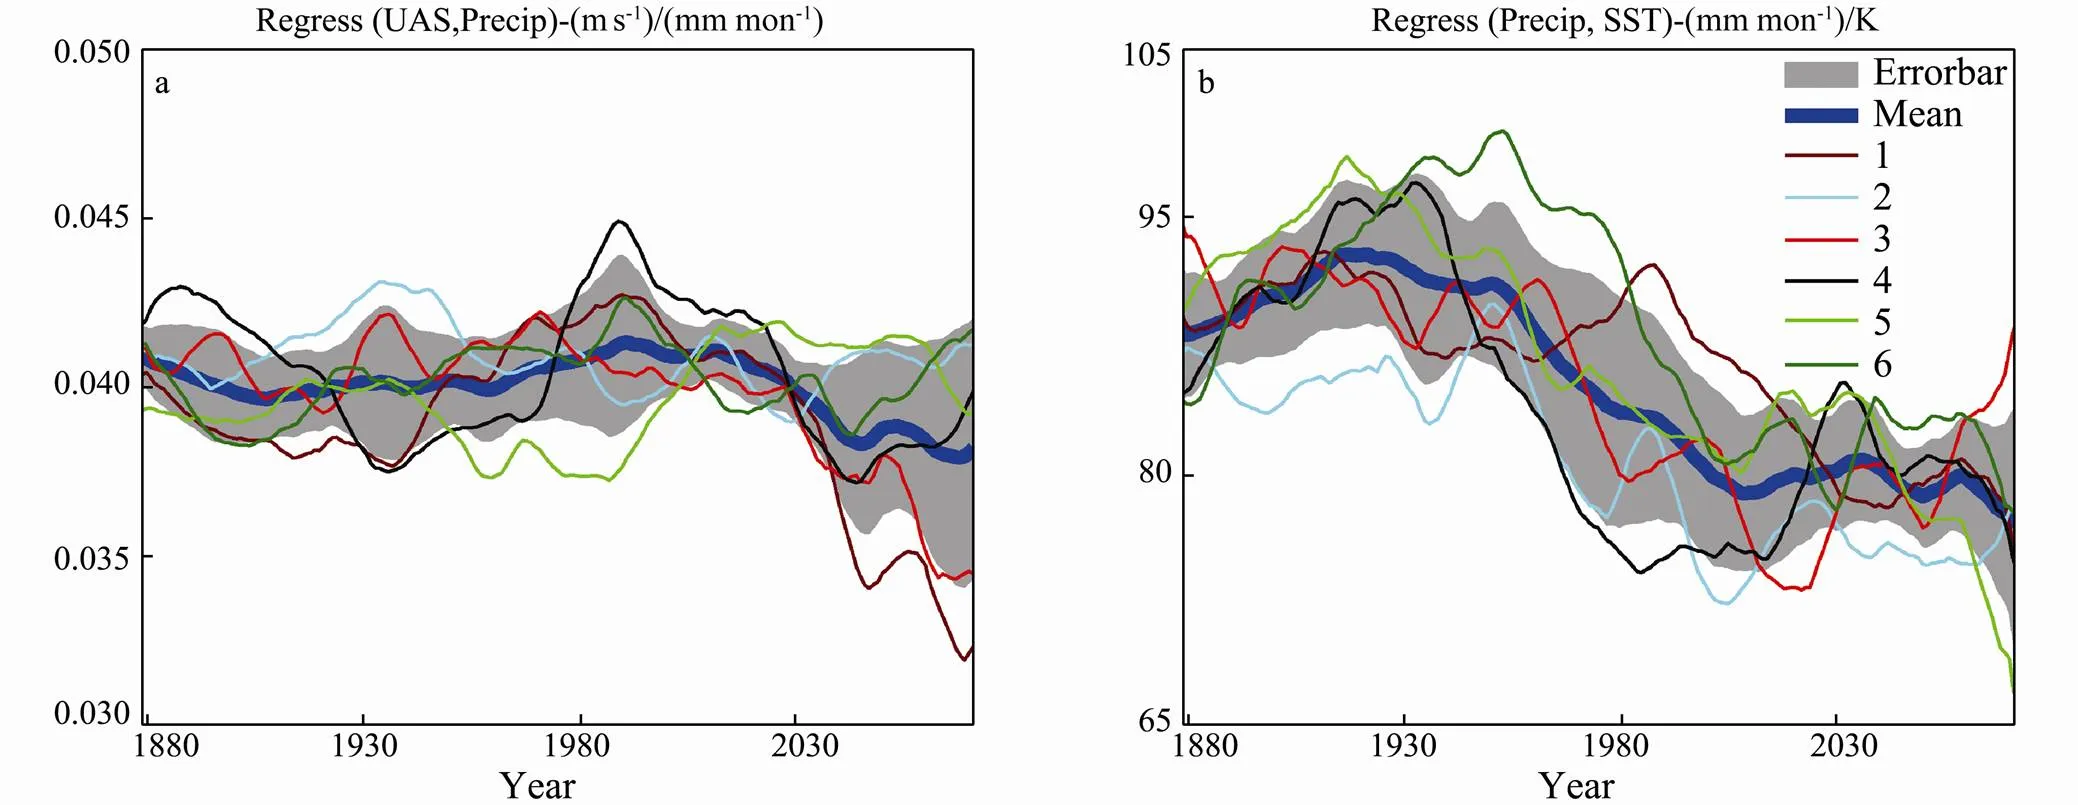
Fig.8 Regression (a) between UAS (CEIO) and Precipitation (EEIO), and (b) between Precipitation (EEIO) and SST (EEIO) of six model runs for SON in 50-year sliding windows. The thick blue line indicates the ensemble mean and the gray shade indicates the inter-member standard deviation.
5 Summary
The changes in the IOD mode are investigated based on the analysis of a multi-member simulation ensemble with CCSM4. Measured by the IOD index, the strength of IOD decreases slightly under global warming. A regression method is used to measure atmospheric and oceanic feedback. In the EEIO, thermocline feedback increases, but atmosphere feedback decreases under global warming, and, as a result, the IOD variance decreases.
In global warming simulations, oceanic feedback increases by about 8%, and the IOD variance decreases by about 9%. This study reveals that the zonal wind response to the SST anomalies of IOD weakens by about 15%. The weakened atmospheric feedback can be seen through reduced zonal wind variance in the central equatorial Indian Ocean and decreased subsurface temperature variance. Thus the reduced zonal wind feedback accompanied with the increased thermocline feedback will lead to a net decrease in the IOD variance under global warming.
To understand the contributions of the ENSO change to the IOD change, this study examines the changes in internal ocean–atmospheric feedback in the TIO using a multi-member analysis and it is found that the weakened atmospheric feedback counteracts the increased oceanic feedback and causes the IOD variance to decrease under global warming.
Acknowledgements
We acknowledge the Working Group on Coupled Modeling of the World Climate Research Programme for producing and making their model output available. We thank the U.S. Department of Energy’s Program for Climate Model Diagnosis and Intercomparison for providing the coordinating support and leading the development of software infrastructure in partnership with the Global Organization for Earth System Science Portals. This work is supported by the National Basic Research Program of China (2012CB955603), the Natural Science Foundation of China (41106010, 41176006), the 111 Project (B07036), and the Qianren Program.
Alory, G., Wijffels, S., and Meyers, G., 2007. Observed temperature trends in the Indian Ocean over 1960–1999 and associated mechanisms., 34, L02606, DOI: 10.1029/2006GL028044.
Chowdary, J. S., Xie, S. P., Tokinaga, H., Okumura, Y. M., Ku- bota, H., Johnson, N. C., and Zheng, X.-T., 2012. Inter-decadal variations in ENSO teleconnection to the Indo-western Pacific for 1870–2007., 25: 1722-1744.
Danabasoglu, G., Bates, S., Briegleb, B. P., Jayne, S. R., Jochum, M., Large, W. G., Peacock, S., and Yeager, S. G., 2012. The CCSM4 ocean component., 25: 1361-1389.
Du, Y., and Xie, S. P., 2008. Role of atmospheric adjustments in the tropical Indian Ocean warming during the 20th century in climate models., 35, L08712, DOI: 10.1029/2008GL033631.
Du, Y., Xie, S. P., Huang, G., and Hu, K., 2009. Role of air-sea interaction in the long persistence of El Niño-induced north Indian Ocean warming., 22: 2023-2038.
Ihara, C., Kushnir, Y., and Cane, M. A., 2008. Warming trend of the Indian Ocean SST and Indian Ocean Dipole from 1880 to 2004., 21: 2035-2046.
Gent, P. R., Danabasoglu, G., Donner, L. J., Holland, M. M., Hunke, E. C., Jayne, S. R., Lawrence, D. M., Neale, R. B., Rasch, P. J., Vertenstein, M., Worley, P. H., Yang, Z. L., and Zhang, M., 2011. The community climate system model, version 4., 24: 4973-4991.
Guan, Z., and Yamagata, T., 2003. The unusual summer of 1994 in East Asia: IOD teleconnections., 30 (10), 1544, DOI: 10.1029/2002GL016831.
Klein, S. A., Soden, B. J., and Lau, N. C., 1999. Remote sea surface temperature variations during ENSO: Evidence for a tropical atmospheric bridge., 12: 917-932.
Knutson, T. R., and Manabe, S., 1995. Time-mean response over the tropical Pacific to increased COin a coupled ocean-atmosphere model., 8: 2181-2199.
Lin, S. J., 2004. A ‘vertically lagrangian’ finite-volume dynamical core for global models., 132: 2293-2307.
Moss, R. H., Edmonds, J. A., Hibbard, K. A., Manning, M. R., Rose, S. K., van Vuuren, D. P., Carter, T. R., Emori, S., Kainuma, M., Kram, T., Meehl, G. A., Mitchell, J. F. B., Nakicenovic, N., Riahi, K., Smith, S. J., Stouffer, R. J., Thomson, A. M., Weyant, J. P., and Wilbanks, T. J., 2010. The next generation of scenarios for climate change research and assessment., 463: 747-756.
Murtugudde, R., McCreary, J. P., and Busalacchi, A. J., 2000. Oceanic processes associated with anomalous events in the Indian Ocean with relevance to 1997–1998., 105: 3295-3306.
Ogata, T., Xie, S. P., Lan, J., and Zheng, X. T., 2012. Importance of ocean dynamics for the skewness of the Indian Ocean Dipole mode.,26: 2145-2159.
Saji, N. H., Goswami, B. N., Vinayachandran, P. N., and Yamagata, T., 1999. A dipole mode in the tropical Indian Ocean., 401: 360-363.
Saji, N. H., Xie, S. P., and Yamagata, T., 2006. Tropical Indian Ocean variability in the IPCC twentieth-century climate simulations., 19: 4397-4417.
Smith, R., Jones, P., Briegleb, B., Bryan, F., Danabasoglu, G., Dennis, J., Dukowicz, J., Eden, C., Fox-Kemper, B., Gent, P., Hecht, M., Jayne, S., Jochum, M., Large, W., Lindsay, K., Maltrud, M., Norton, N., Peacock, S., Vertenstein, M., and Yeager, S., 2010.., LAUR-10-01853, 141pp.
Tokinaga, H., Xie, S. P., Deser, C., Kosaka, Y., and Okumura, Y. M., 2012. Slowdown of the Walker circulation driven by tropical Indo-Pacific warming., 491: 439-443, DOI: 10.1038/nature11576.
Webster, P. J., Moore, A. M., Loschnigg, J. P., and Leben, R. R., 1999. Coupled ocean-atmosphere dynamics in the Indian Ocean during 1997–98., 401: 356-360.
Xie, S. P., Annamalai, H., Schott, F. A., and McCreary, J. P., 2002. Structure and mechanisms of south Indian Ocean climate variability., 15: 864-878.
Xie, S. P., Deser, C., Vecchi, G. A., Ma, J., Teng, H., and Wittenberg, A. T., 2010. Global warming pattern formation: Sea surface temperature and rainfall., 23: 966-986.
Yang, J., Liu, Q., and Liu, Z., 2010. Linking observations of the Asian monsoon to the Indian Ocean SST: Possible roles of Indian Ocean basin mode and dipole mode., 23: 5889-5902.
Yuan, D., and Han, W., 2006. Roles of equatorial waves and western boundary reflection in the seasonal circulation of the equatorial Indian Ocean., 36: 930-944.
Zheng, J., Liu, Q., Wang, C., and Zheng, X. T., 2012. Impact of heating anomalies associated with rainfall variations over the Indo-Western Pacific on Asian atmospheric circulation in winter., DOI: 10.1007/s00382-012-1478-x.
Zheng, X. T., Xie, S. P., Du, Y., Liu, L., Huang, G., and Liu, Q., 2013. Indian Ocean Dipole response to global warming in the CMIP5 multi-model ensemble., DOI: 10.1175/JCLI-D-12-00638.1, in press.
Zheng, X. T., Xie, S. P., Vecchi, G. A., Liu, Q., and Hafner, J., 2010. Indian Ocean Dipole response to global warming: Analysis of ocean-atmospheric feedbacks in a coupled model., 23: 1240-1253.
(Edited by Xie Jun)
10.1007/s11802-013-2200-2
ISSN 1672-5182, 2013 12 (2): 209-215
. Tel: 0086-532-66781305 E-mail: zhengxt@ouc.edu.cn
(November 1, 2012; revised January 15, 2013; accepted February 26, 2013)
© Ocean University of China, Science Press and Springer-Verlag Berlin Heidelberg 2013
 Journal of Ocean University of China2013年2期
- Journal of Ocean University of China的其它文章
- Relationships of Interannual Variability Between the Equatorial Pacific and Tropical Indian Ocean in 17 CMIP5 Models
- Influence of Summer Monsoon on Asymmetric Bimodal Pattern of Tropical Cyclogenesis Frequency over the Bay of Bengal
- Formation Mechanism for the Anomalous Anticyclonic Circulation over Northeast Asia and the Japan Sea in Boreal Winter 1997/98 and the Spring of 1998
- Recent Changes of Northern Indian Ocean Summer Rainfall Based on CMIP5 Multi-Model
- Asymmetric Response of the South China Sea SST to El Niño and La Niña
- Southern Ocean SST Variability and Its Relationship with ENSO on Inter-Decadal Time Scales
