
MULTIVARIATE ABSOLUTE DEGREE OF GREY INCIDENCE BASED ON DISTRIBUTION CHARACTERISTICSOF POINTS
2012-10-08 12:10:32ZhangKeWangYanXinJianghuiXuYejun
Zhang Ke,Wang Yan,Xin Jianghui,Xu Yejun
(1.Business School,HoHai University,Nanjing,211100,P.R.China;2.Department of Vehicle Engineering,Nanjing University of Technology,Nanjing,211167,P.R.China)
INTRODUCTION
Grey relational analysis is not only an important part of grey system theory,but also the cornerstone of the grey system analysis,modeling, prediction, and decision-making[1].With the advantage of few sample requirement and low calculation,grey incidence analysis has been successfully applied to economy,industry,aerospace,and many other fields[2-4].But grey incidence models such as:Deng-si degree of grey incidence,absolutedegree of grey incidence,type B,type C,type T degrees of grey incidence and slope grey incidence,can only be applied to time series.With the development of science and technology,the systems which human needs to study become more and more complex.A large number of system variables appear in the form of multivariate time series. At present, the multivariate grey incidence analysis model becomes a new research hotspot.For example,Tan Xuerui extended the Deng-si degree of grey incidences,and established a multivariate grey incidence model for medical statistical analysis[5].Wang Zhengxin constructed three-dimensional grey incidence degree which can be applicable to dynamic multiple attribute decision-making[6].Zhang Ke developed the grey absolute incidence degree, and proposed a multivariate grey incidence model for panel data clustering and image processing[7-8].
Although multivariate relational analysis model research has made some progress,existing models are the direct extensions of classic models.These models use all data to analyze relationship between system factors.However,multivariate time series contains more complex information of factor than time sequence.For example, trend feature, periodic feature and detail feature are contained in time series simultaneously. If all data are used, some important feature of system factor can be easily drowned in the large amount of detail information and noisy,resulting in the deviation of analysis results. Such as that the quantitative analysis with model in Ref.[7]is inconsistent with qualitative analysis when multivariate time series fluctuates.In order to improve the accuracy of multivariate grey incidence analysis,the main feature of time series should be acquired.
Therefore, this paper combines feature extraction method of multivariate time series with grey incidence analysis theory to propose a new multivariate absolute incidence degree based on distribution characteristics of points.Firstly,the local extremum method is introduced to extract feature of multivariate time series, and an important point set is constructed. Then,a characteristic point sequence is acquainted according to the distribution characteristic of the important point set.The sequence includes the main feature of the important point set,and reflects the geometry property of multivariate time series. A new grey incidence model is constructed which transforms incidence analysis between multivariate time series into relational analysis between their characteristic point sequences.
1 ABSOLUTE DEGREE OF GREY INCIDENCE
Def inition 1[1]Assume that Xp=(aij)m×n,X q=(bij)m×n are the same type matrixes.Then

is called multivariate absolute degree of grey incidence of X p and X q,where
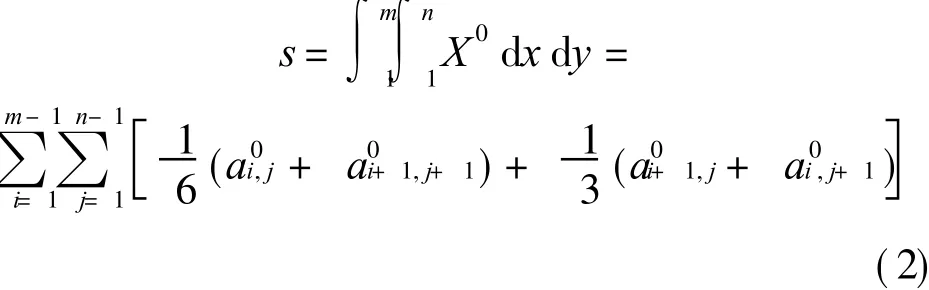
Multivariate absolute degree of grey incidence determines the similarity between system factors according to volume among surfaces corresponding to multivariate time series.Its essence is th e same as the principle of classic grey incidence analysis. The model performs well in panel data clustering,image processing and other fields. However, the calculation result of the model easily contradicts the qualitative analysis for the lack of feature extraction method. For example: two multivariate time series are X p and X q,shown as
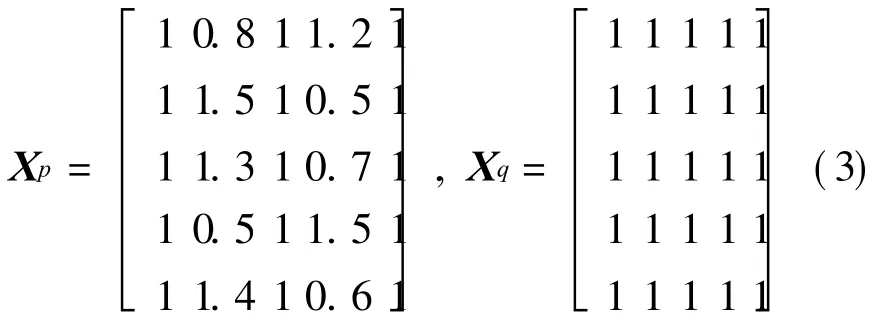
Their surfaces and zeroing images are shown in Fig.1.The multivariate absolute degree of grey incidence between two series is X pq=1.
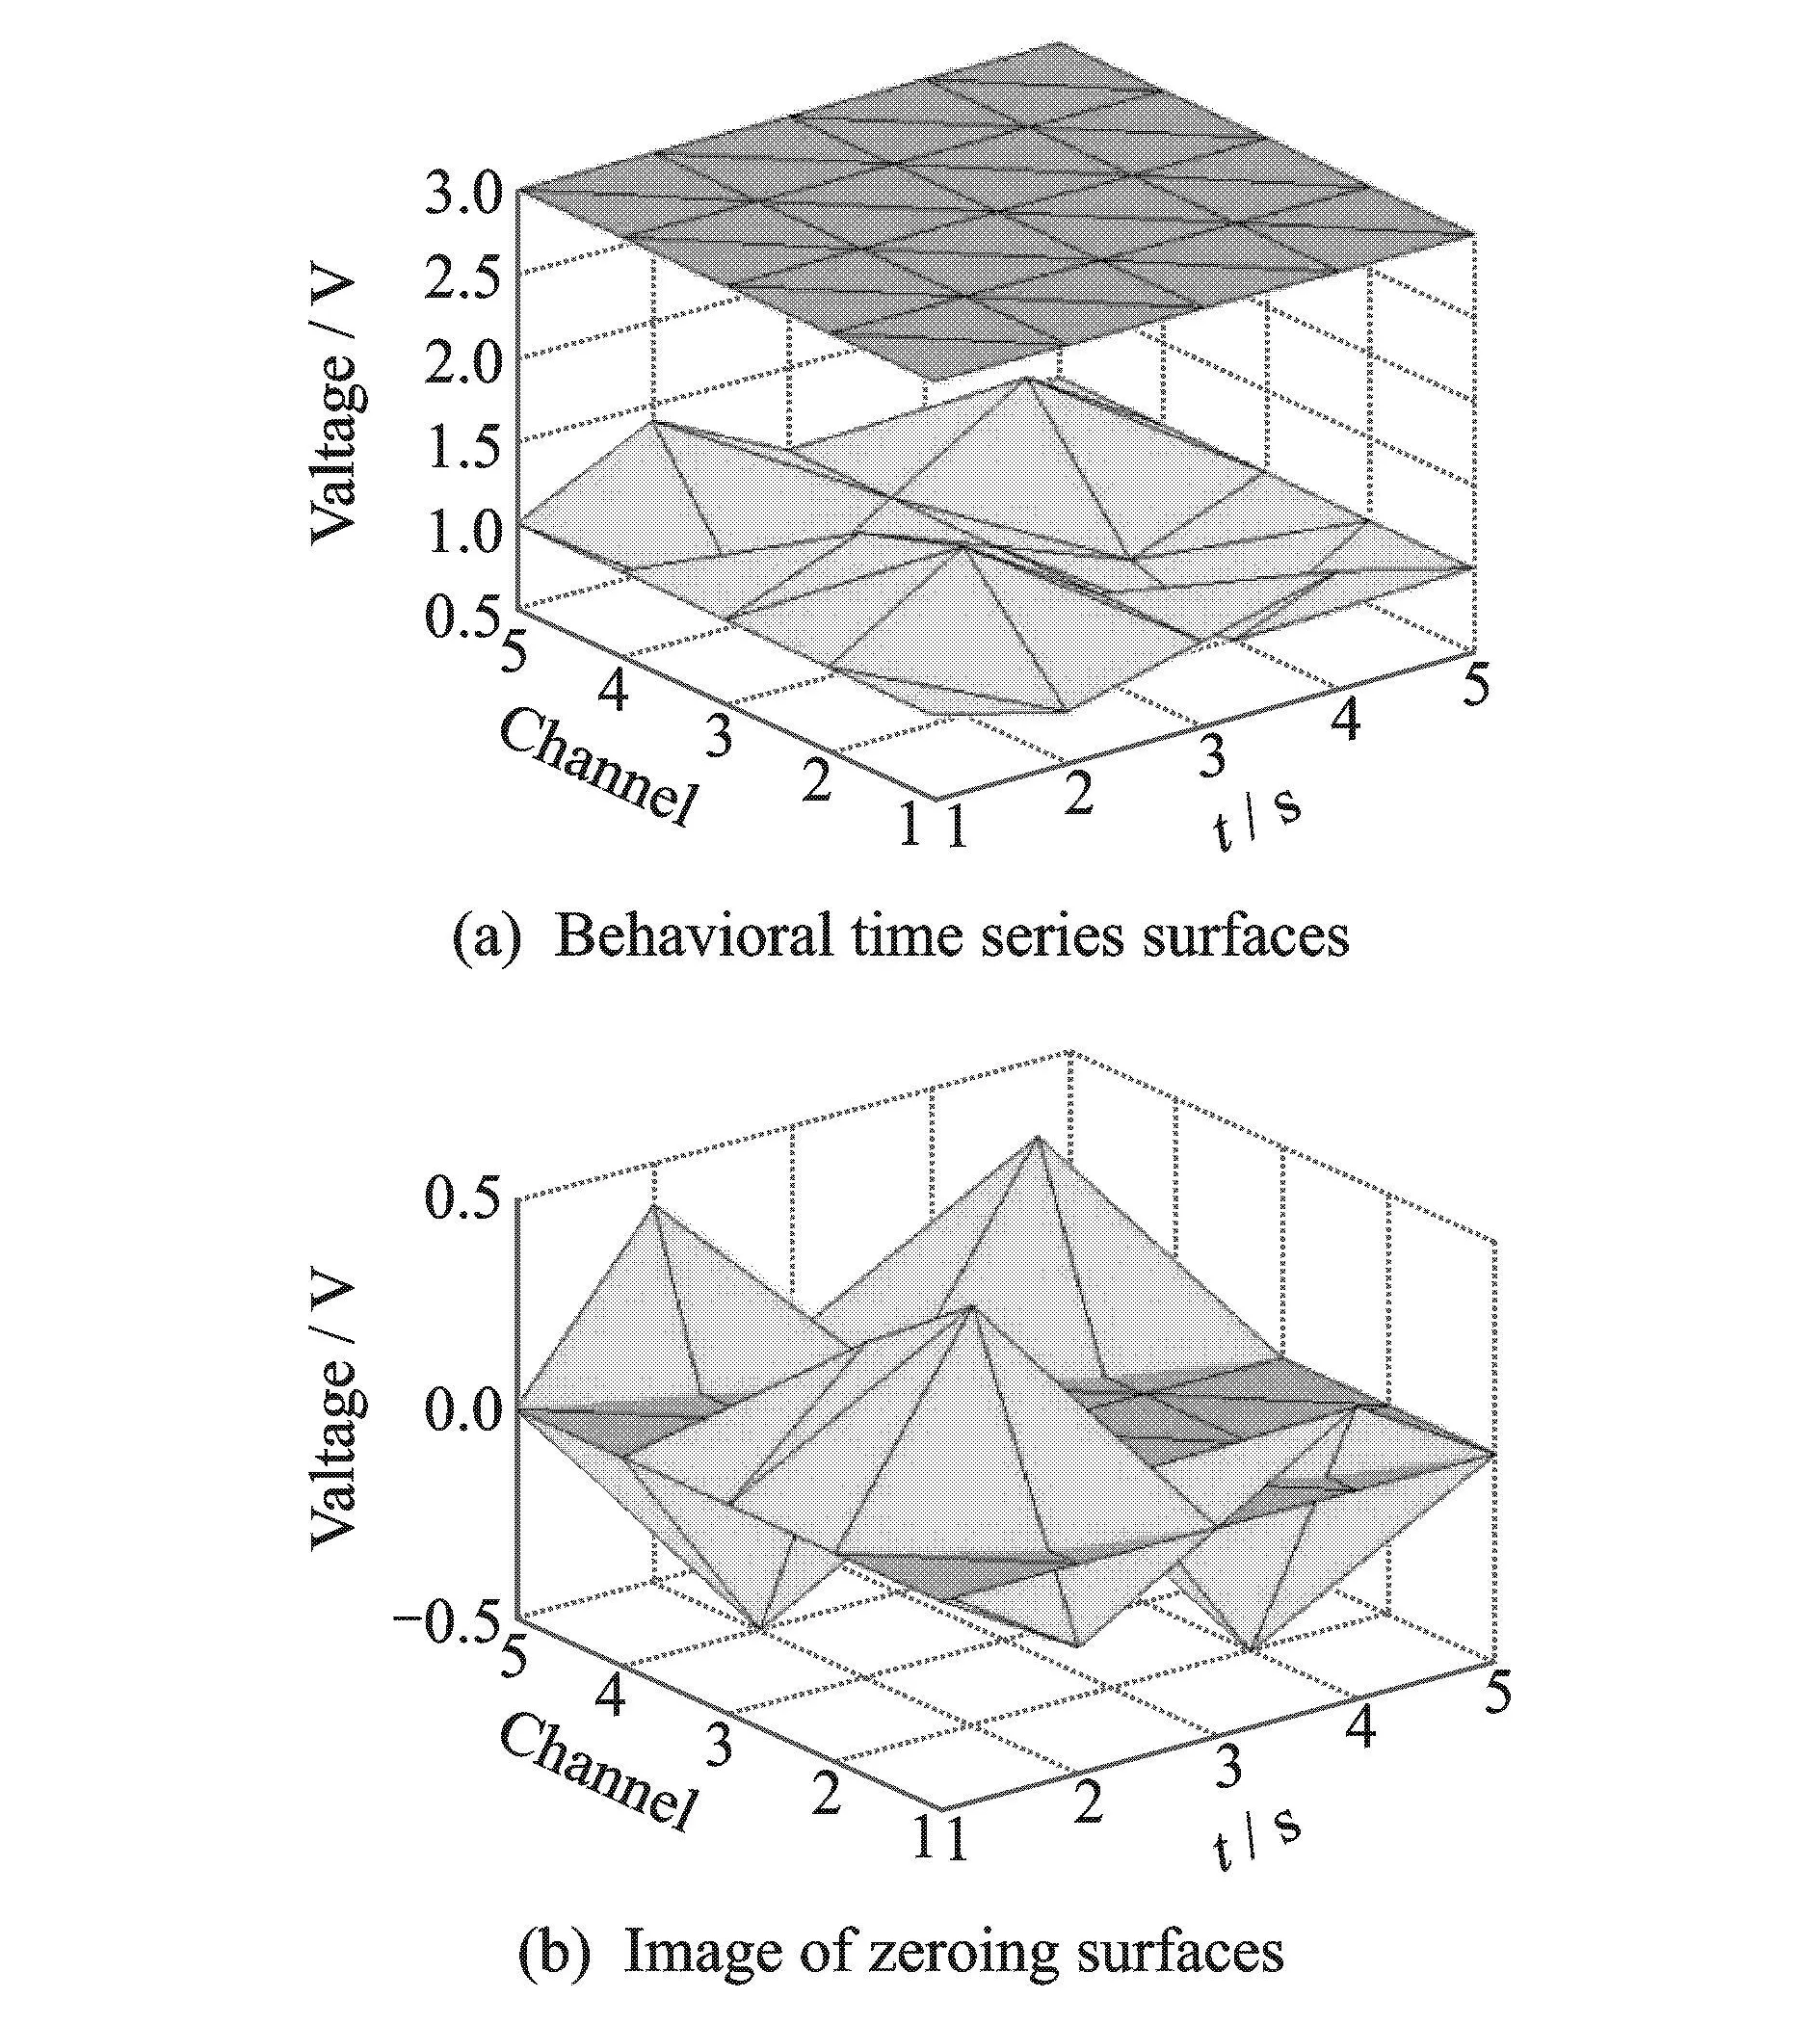
Fig.1 Multivariate absolute degree of grey incidences
It can be seen from Fig.1 that the distances between points of two multivariate time series are far,and tendencies of two zeroing surfaces are also different.However,theincidence degreeis 1 by Eq.(1).The result means that the geometric development of two series is identical.Obviously,the calculation results are inconsistent with the facts.The reason of this problemis that modeling data are not representative and major characteristics are submerged in a mass of information.
In order to overcome the deficiency of multivariate absolute degree of grey incidence,the feature extraction method is introduced to construct a new incidenceanalysis model.First of all,the characteristic point sequence is extracted in order to reduce data dimension and highlight the main feature.Then,a new grey incidence analysis model is proposed according to the characteristic point sequence. The model considers incidence degree between multivariate time series as similarity between characteristic point sequences.
1.1 Extraction method f or distribution characteristics of points
There are many methods to represent features of multivariate time series. Usually,original data are used. This method can accurately describe features of multivariate time series,and completely preserve information of system factors.However,sometimes geometric outlines of multivariate time series need more attention,without details features[9].Therefore,feature extraction method in Ref.[10]was introduced. The main geometric feature is extracted based on distribution characteristics of multivariate time series.
Def inition 2 Given a segmentation method,x[i,j]is the neighborhood G of x,where i is the number of rows and the mean of i1 and i2,j the number of columns and the mean of j1and j2.If x[i,j]is the maximum point in neighborhood G,it is called the local maximum important point.If x[i,j]is the minimum point in neighborhood G,it is called the local minimum important point.
Definition 2 gives an important point extraction method for multivariate time series.It considers maxima and minima in a certain neighborhood as important points,because the two points are representative.Neighborhood size G in the method should be selected according to actual problems.When the multivariate time series is larger,G can be larger,otherwise,G should be a small value,even 1.Because the numbers of the important points in the different neighborhoods are not the same,they are not entirely consistent for different multivariate time series.Some percentiles can be used to describe the distribution of important point set.In this paper,seven percentiles are used.They are the maximum value(Max),75,50,25 percentiles,the minimum value(Min),95 and 5 percentiles.
Definition 3 Assume I={I1,I2,…,IN}is an important point set of multivariate time series X,so SI={SI1,SI2,…,SIN}is ascending order of I.Then
is called the discrete probability distribution function of I.
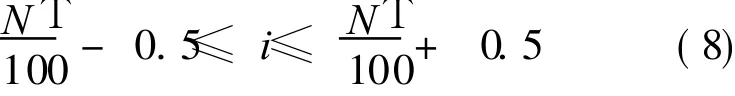
Theorem 1 Assume probability distribution function of the point set I is P(Ii),so the linear interpolation function of T(0<T<100)percentile is
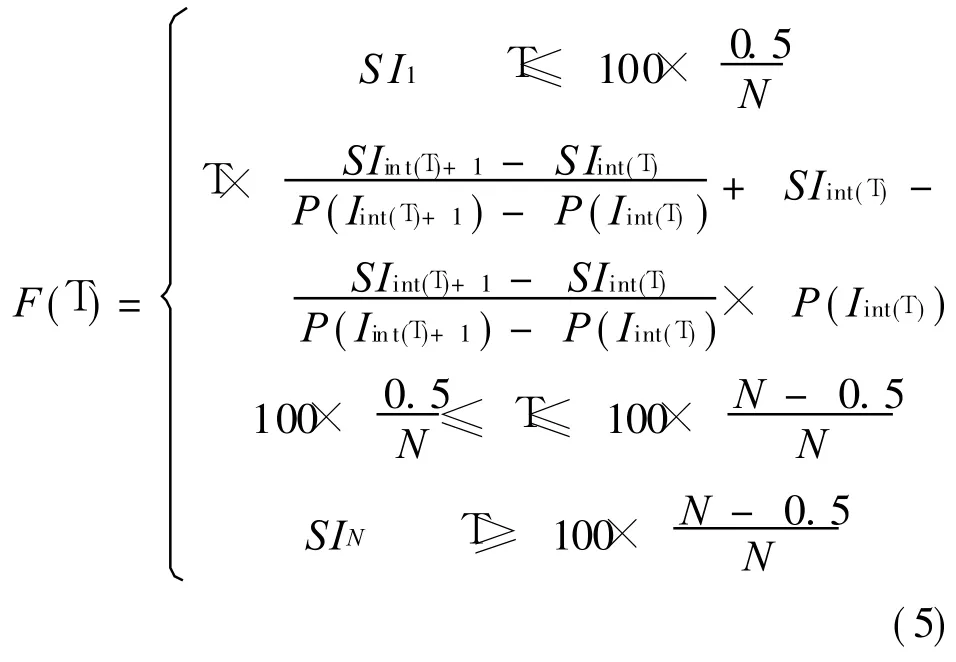
where int(T)is theintegral function of N T/100-0.5.
Proof According to Definition 3,any element in important point set I={I 1,I2,…,IN}is a percentile.Therefore,a discrete distribution is defined.Arbitrary percentiles in distribution can be obtained through interpolation function.

Therefore

And
Let int(T)be integer part of N T/100-0.5.It is certainty that T percentile is in(SI int(T),SI int(T)+1).Probabilities of two percentiles can be determined by Definition 3.Therefore,a linear interpolation function is established according to(P(I int(T)),SI int(T))and(P(I int(T)+1),SI int(T)+1),as shown in Fig.2. Results in Theorem 1 are obtained.The other proof process is omitted.
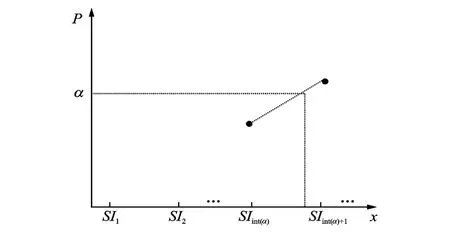
Fig.2 Interpolation function of T
1.2 New model of absolute degree of grey incidence
A feature extraction method is proposed according to Definitions 2 and 3.Furthermore,a mean to construct characteristic point sequence is provided in Theorem 1. On the basis, the similarity of multivariate time series can be analyzed,according to the geometric feature of characteristic point sequences.
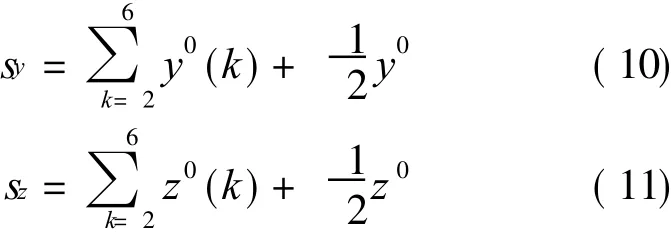
Def inition 4 Assume characteristic point sequences of multivariate time series X1,X2 are Y=(Y1,Y2,… ,Y7)and Z=(Z1,Z2,… ,Z7),then
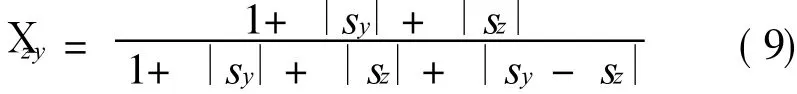
is called the absolute degree of grey incidence for two multivariate time series Y and Z based on distribution characteristics of points,where
To sum up,the multivariate grey incidence analysis method consists of following four steps:
(1)Draw surface of multivariate time series with the method in Ref.[7],and select the appropriate neighborhood G.
(2) According to Definition 2, extract important point set of multivariate time series.
(3)Construct characteristic point sequence from important point set by Theorem 1.
(4)According to Definition 4,calculate the absolute degree of grey incidence of characteristic point sequence,and measure the similarity of multivariate time series.
2 MODEL PROPERTIES
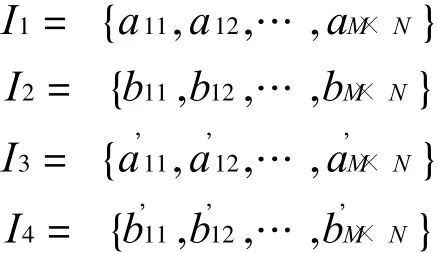
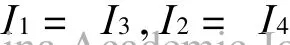
Property 1 Assume the absolute degree of grey incidence for two multivariate time series X 1=(aij)M×N and X 2=(bij)M×N based on distribution characteristics of points is X12,and c is a constant.The grey incidence degree between X3=(aij+c)M×Nand X4=(bij+c)M×Nis also X12.
Proof Assume the important point sets of multivariate time series X1 and X2 are I={I1,I2,… ,IN}and J={J1,J2,… ,JM},respectively.SI={SI1,SI2,… ,SIN}and SJ={SJ 1,SJ 2,… ,SJ
N}are ascending order of I and J.Y=(Y1,Y2,…,Y7),Z=(Z1,Z2,…,Z7)are characteristic point sequences of X1 and X2.
According to the function extremum properties,the important point sets of X 3 and X4 are={I1+c,I2+c,… ,IN+c}and={J 1+c,J 2+ c,…,JM+c}.Therefore,the ascending order of them are
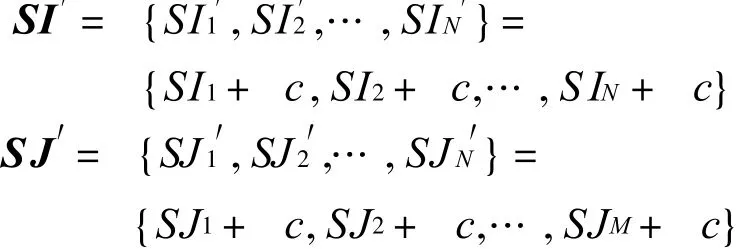
Because the frequency of SIi in SI is the same as that of S+c in S,wehave
According to Theorem 1,the characteristic point sequences of X 3 and X 4 are=(Y1+c,Y2+c,… ,Y7+c)and=(Z1+c,Z2+ c,… ,Z7+ c).Therefore,their zeroing images are
According to Definition 4,the grey incidence degree between X3 and X 4 is the same as that between X1 and X2.
Property 2 Absolute degree of grey incidences based on distribution characteristics of points satisfies normative,even symmetry and proximity of grey incidence axioms.
Proof
(1)Normative property.It is obvious that X zy in Eq.(9)is nonnegative.Because|sy-sz|≤1,X zy> 0. That means the incidence degree satisfies the normative property.
(2)Even symmetry property.Because|sysz|=|sz-sy|,it can be proved that X z y=X yz.That means the incidence degree satisfies the even symmetry property.
(3)Proximity property. The closer the distance between sy and sz is,the smaller|sy-sz|is,and vice versa.That means the incidence degree satisfies the proximity property.
Property 3 When and only when neighborhood G is X[1∶ 1,1∶ 1],absolute degree of grey incidence is invariable when two multivariate time series are transposed or their rows(columns)are swapped.
Proof Assume transformed series of X 1=(aij)M×N and X 2=(bij)M×N are X3=()M×N and X 4=()M×N respectively.When G is X[1∶1,1∶1],all elements in X1 and X2 are important points.Therefore
Though element positions are changed,their values are invariable when series is transposed or rows(columns)of series are swapped.Therefore
Because there are not differences between the important point sets of original series and transformed series, the incidence degree is invariable.
When G is not X[1∶ 1,1∶ 1],important point sets of original series and transformed series are different.Therefore,theincidence degrees of transformed series are inconsistent with original series.
Property 1 shows that the translation transformation does not influence the proposed incidence degree.When the magnitude of the original data is bigger, the translation transformation can be used for preprocessing.
Property 2illustrates that the model satisfies the axioms of grey incidence analysis.Because the proposed model transforms multivariate time series into sequences and analyzes their relationship with classic absolute degree of grey incidence, its properties are consistent with classic model.
Property 3 ensures the consistency of grey incidence analysis between multivariable time series and their transformed series. Model in Refs. [6-7]does not satisfy Property 3.Therefore, when data are transposed, these incidence degrees are changed.
3 CASE STUDIES
3.1 Example 1
The proposed model is used to analyze the similarity of two multivariable time series as shown in Fig.1(a).
The two series are small scale matrixes,because their numbers of rows and columns are less than 30.Therefore X[1∶ 1,1∶ 1]is chosen to extract important points.Then characteristic point sequences are constructed(Fig.3).
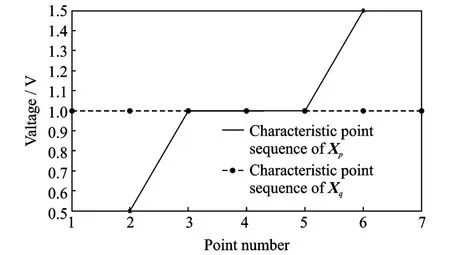
Fig.3 Characteristic point sequences
It can be seen from Fig.3 that characteristic point sequences reflect the major geometric features of Xpand Xq.The geometric feature is that X p fluctuates around X q. According to Definition 4,the grey incidence degree between Xpand Xqis Xpq=0.57.The result shows that the similarity between the two series is weak.It is identical with subjective judgment.
3.2 Example 2
Robot execution failure(REF)set is the common test data set of small scale multivariable time series minigng.The data set is sampled from a robot in different states and time. Six multivariable time series are selected randomly from subset LP1 of REF.Series name,series number in REF,and state are shown in Table 1.Six series are shown in Fig.4.
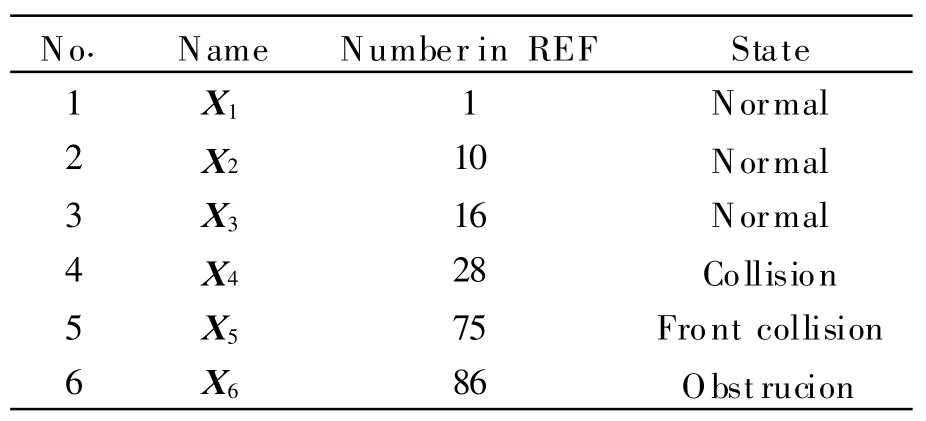
Table 1 Multivariable time series and their states
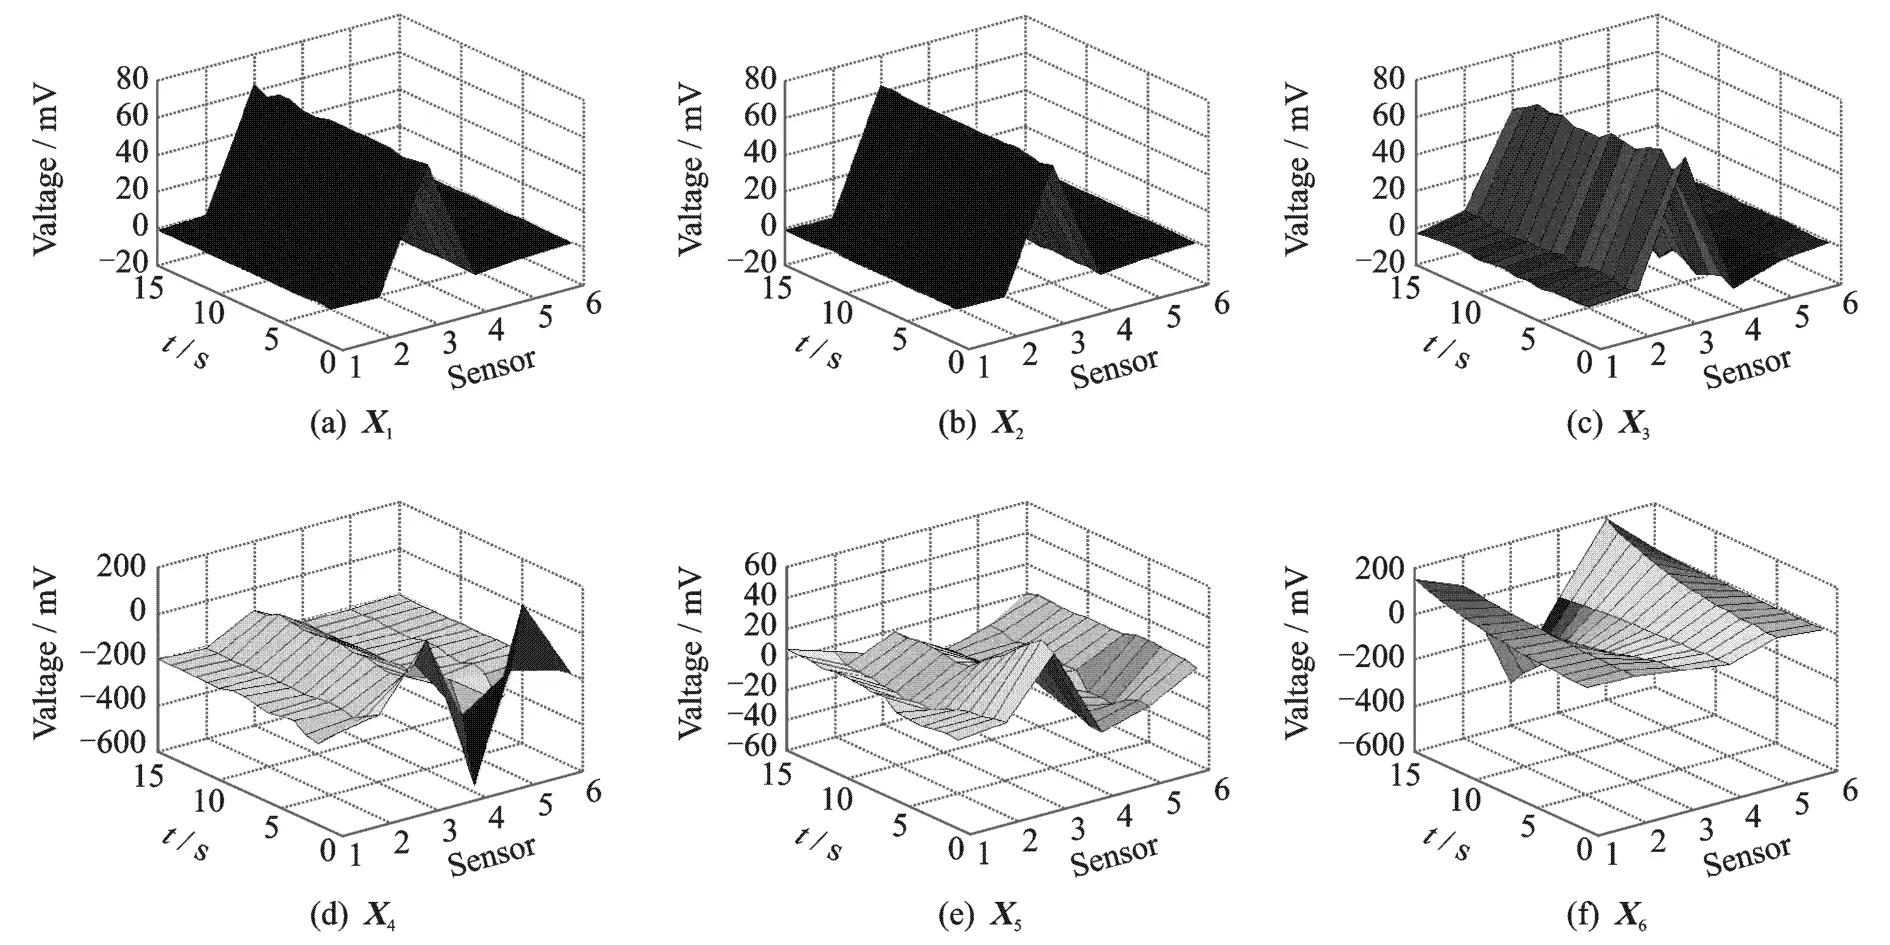
Fig.4 REFexperimental data
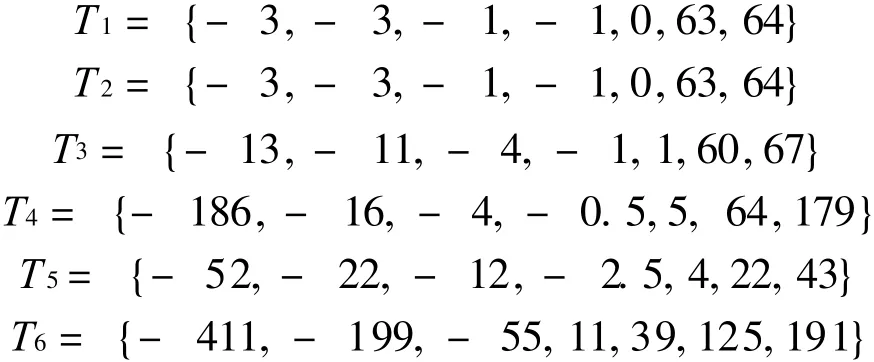
Neighborhood G is chosen as the sameas that in the example 1.Characteristic point sequences of six series are
X1 is considered as reference sequence.Incidence degrees between others series and X1 are calculated respectively by the proposed model and models in Refs.[5,7].Results are shown in Table 2.
It can be seen from Table 2 that X 1concluded by the proposed model and the model in Ref.[5]is most similar with X2,while X1concluded by the model in Ref.[7]is most similar with X4.According to the state in Table 1,conclusions of the proposed model and the model in Ref.[5]are valid,and the model in Ref.[7]is incorrect.Meanwhile,though geometry features of X3 and X4 are less similar,X13 is equal to X14 with the model in Ref.[5].Therefore,results of the proposed model are more reasonable than the model in Ref.[7].

Table 2 REF experimental results
4 CONCLUSIONS
In this paper,a new grey incidence analysis model is constructed.Its properties are studied,and two cases are conducted.Some conclusions can be drawn:
(1)Multivariate absolute degree of grey incidence based on distribution characteristics of points fully accords with the essence of grey relational analysis. It not only extends the application of grey system, but also en richs similarity measure method of multivariable time series.
(2)The shortage of model in Ref.[7]is overcame.Case studies show that the proposed model performs more effectively.
(3)The statistic method is introduced to extract geometry feature of multivariable time series,which avoids information losing.Also,the proposed model is easy to program on computer.Therefore,its application will be wide in future.
[1] Liu Sifeng.Grey information: Theory and practical applications[M].London:Springer Verlag,2006.
[2] Liu Sifeng,Xie Naiming,Jeffery F.On new models of grey incidence analysis based on visual angle of similarity and nearness[J]. Systems Engineering Theory& Practice,2010,30(5):881-888.(in Chinese)
[3] Xie Naiming,Liu Sifeng.A novel grey relational model based on grey number sequences[J].Grey Systems:Theory and Application,2011,1(3):117-128.
[4] Liu Sifeng,Xie Naiming,Jeffery F.Novel models of grey relational analysis based on visual angle of similarity and nearness[J].Grey Systems: Theory and Application,2011,1(2):8-18.
[5] Tan Xuerui,Deng Julong.Grey relational analysis:A new multivariable statistic method[J].Statistic Research,1995,6(3):46-49.(in Chinese)
[6] Wang Zhengxin,Dang Yaoguo.Three dimensional grey relational model and its application[J].Statistic and Decision,2011(15):174-176.(in Chinese)
[7] Zhang Ke,Liu Sifeng.Extended grey relational clustering and its application [J]. Systems Engineering Theory& Practice,2010,30(7):365-373.(in Chinese)
[8] Zhang Ke,Liu Sifeng.A novel algorithm of image edge detection based on matrix degree of grey incidences[J].The Journal of Grey System,2009,19(3):265-276.
[9] Guan Heshan.Pattern matching method based on point distribution for multivariate time series[J].Journal of Software,2009, 20(1):67-79. (in Chinese)
[10]Guan Heshan.Research and application of financial multivariate time series mining methods[D].Xiamen:Xiamen University,2008.(in Chinese)
 Transactions of Nanjing University of Aeronautics and Astronautics2012年2期
- Transactions of Nanjing University of Aeronautics and Astronautics的其它文章
- APPLICATION OF IMPROVED EMD IN VIBRATION SIGNAL FEATURE EXTRACTION OF VEHICLE
- NEW REMOTE USER AUTHENTICATION SCHEME USING SMART CARD
- NOVEL IMMERSED BOUNDARY-LATTICE BOLTZMANN METHOD BASED ON FEEDBACK LAW
- GRADE-LIFE PROGNOSTIC MODEL OF AIRCRAFT ENGINE BEARING
- TASK EFFECTIVENESS EVALUATION ON ANTI-SHIP ATTACK OF FIGHTER AIRCRAFT
- DELAY-TIME MODEL BASED ON IMPERFECT INSPECTION OF AIRCRAFT STRUCTURE WITHIN FINITE TIME SPAN