Organization and storage model of marine information and its application in the“China Digital Ocean”
LIU Jin,LI Hao-qian, ZHU Ji-cai,JIANG Xiao-yi,ZHANG feng
1. National Marine Data and Information Service, Tianjin 300171, China;
2. China Nuclear Geology, Beijing 100013, China
Organization and storage model of marine information and its application in the“China Digital Ocean”
LIU Jin1,LI Hao-qian1, ZHU Ji-cai2,JIANG Xiao-yi1,ZHANG feng1
1. National Marine Data and Information Service, Tianjin300171, China;
2. China Nuclear Geology, Beijing100013, China
Based on the experience and achievement of the“China Digital Ocean”, the classification plan for Marine data elements is made, which can be classified into five,including marine point elements, marine line elements, marine polygon elements,marine grid elements and marine dynamic elements. In this paper, the technology of features and object-oriented method, a spatial-temporal data model is proposed, which can be applied in the large information system engineering like the “Digital Ocean”, and this paper discusses the application of spatial data model, marine three-dimensional raster data model and relation data model in the building of Data Warehouse in “China Digital Ocean”, and concludes the merits of these models.
digital ocean, sphere model, data warehouse, ocean elements, data organization and storage
Introduction
“Digital Ocean” is a massive and complex system supported by the newest information technology, which relies on the national information facilities and marine spatial data establishment to research the marine phenomenon[1]. It is a virtual ocean world formed by massive marine observation data with multi-resolution, multi-phase and multi-space type, and also by its analysis algorithm and model. Data model and data structure are the foundation for constructing the digital ocean information system. Most of the ocean phenomenon has a dynamic spatio-temporal feature, which is the essential difference comparing to the land information, so the traditional GIS data model is facing many embarrassments in organizing or displaying the ocean information.
Many researchers propose various types of spatio-temporal data models to organize and display the time-space phenomenon. In the Time Lab technology report, Achilleas Pand Babis T detailedly discussed 9 frequently used spatio-temporal data models and analyzed their merits and drawbacks and the relative application domain[2]. Yet, these models can not organize or display the time-space process of ocean phenomenon well,particularly when both the property and position are changeable, such as the ocean front,the vortex and the coastline, et al. LI Shan et al. proposed an “ocean line data model basing on features” and designed an ocean line storage structure with a time-space feature[3].XUE Cun-jin et al. discussed the process objects and their logical relation according to the inner characteristics of continuous gradual changing geography substantiality. They implicitly recorded the dynamic changing mechanism of the geography substantiality by the abstract process object, and defined the function interface mode whose changing mechanism is supplied by the process object storage list. Also, they realized the process organization, storage and dynamic analysis of continuous gradual changing geography substantiality[4]. The researches of LI and XUE solved the organization and storage of the marine data with line feature and continuous gradual change feature respectively. Their work can partly fulfill the demand of ocean information system. However, the digital ocean is an integrated information system containing various types of marine data, which requires an integrated and general solution.
Aiming at project application, this paper researches the classification of marine data elements in the “Digital Ocean” system, designs a spatio-temporal data model that suits for large information system project like “Digital Ocean”. Its practical application performs well.
1 Background
“China Digital Ocean” is a macro system, which recurs and predicts the real ocean based on the integrated digital platform and the virtual environment supported by the techniques of database, geographic information system, network and so on. The data this system contains are obtained from marine investigation, ocean observation (including the satellite, plane, ship, buoy, and station data) and society statistic investigation. “Digital Ocean” directly displays the real ocean phenomenon and process, predicts and simulates the future ocean scene, improves ocean development and application reliably and effectively to keep the continuable development of ocean[5].
The data sources of “Digital Ocean” information system involve: the whole data of 908 investigation project, investigation data of history projects of National Ocean Bureau,the massive marine science data and relative information conserved by subordinate ocean bureaus, marine business centers and research institutes. The data cover wide domains like ocean hydrology, meteorology (near sea surface), marine biology, marine chemistry,marine environment quality, marine geology, marine geophysics, marine basic geography,ocean aviation and remote sensing, marine economy, ocean resource, etc. The total global ocean data volume is greater than 10 billion kb.
Compared to the other data, ocean information owns the characteristics of multi-source, multiform and multi-type. Various observation methods determine the multi-source of data, subsequently lead to accuracy differences and various formats, which cause the complex data structure. The multiform of data, namely, the ocean information are presented by various formats, like graph, image, text, etc, which induces a further complication of data processing methods. The multi-type of data means that the ocean data cover various disciplines, which brings complexity to the data management. One of the important tasks of “Digital Ocean” is to establish the data warehouse and integrate the complex various ocean data together for the further information service, what’s the key point is the proper data organization & storage that can fulfill the requirements of data application.
2 Classification of the ocean data elements
Considering the multi-source and multiform of ocean data, this paper chooses a feature-based method, to categorize the complex various data and pick up their special properties for establishing the element category and the data model. A clear catalog can be formed by classifying the ocean data, which is beneficial to the construction of the database and dataset. The feature-based method is adopted to extract the common spatial character and property information, abstract them into element categories. Meanwhile,establish the relationship among the data and design the data model according to the needs of the data application, and supply the data interface, method and operation for it.
Features highly generalize and abstract the phenomenon and its display of the realistic world, which are the basic units of entity. All the objects in the realistic world are displayed by the features, which are composed of feature property and feature operation.The instantiation of the features turns out to be the object entity of the realistic world. Thus,this paper categorizes the marine data into five elements, which are marine point elements,marine line elements, marine polygon elements, marine grid elements and marine dynamic elements. The definitions and the contents of each element are as follow.
2.1 Marine point elements
The marine points can be classified into two kinds, which are feature points and measurement points. The measurement points can be similarly classified into time series points and instantaneous points, while the latter are formed by four subcategories.
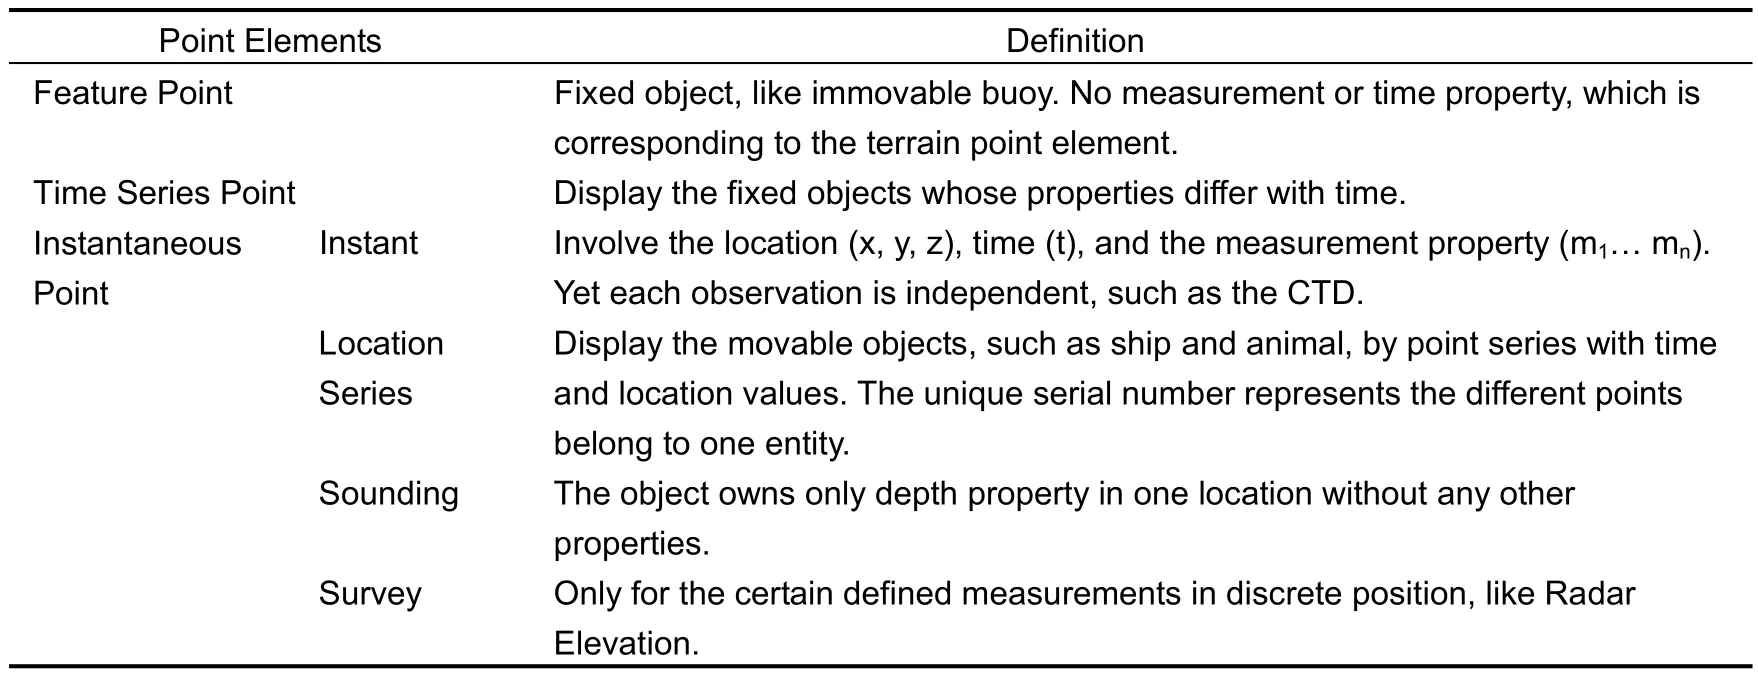
Tab. 1 Classification of marine point elements
2.1.1 Time series points
The fixed buoy, coast base and station et al. can be displayed by the Time Series Point Model due to their long time series’ data collection, while the Instantaneous Point relates with a certain time. In the Time Series Point property table, X-location and Y-location define the location of the point. As the foreign key equipment list, Device ID defines the equipment information of that point. The time series parameter table keeps the parameter information. TS Type is the host key and responsible for connecting the Time Series table.Z-location can display the different profiles of the same parameter variable. The values of each variable are stored in the time series table.

Tab. 2 Parameters of time series points
There’s no definition for the time series with irregular interval. The main time intervals are 1 min, 2 mins, 30 mins, 1h, 2h, 1d and 1mon. As its name, the DataType indicates the data type, including the instantaneous data, the accumulative data, the increment, the mean, the maximum and the minimum. The Origin indicates whether the time series data are produced by a model or the real measurement data.

Tab. 3 Parameters of Time Series Point
2.1.2 Location series
Location Series is the subcategory of Instantaneous Point. It fits for storing the information of each point of the trace and can be used to display the information of ocean plankton. The single plankton information is stored in the Series. The Series ID represents animal, are every point of animal is described by Location Series. Property Time Value and XY coordinates represent a single point element. Property Z Value is responsible for storing the depth. As a foreign key, Survey ID connects the object class Survey Info through the relation class SurveyInfoHasPoints. Series ID is used to connect the object class Series.
2.2 Marine line elements
The profile contour, duration line, and the element line are three components of the marine line elements.
2.2.1 Profile contour
This subcategory supplies a public data type for describing the element property of the nodes along the profile contour. In ocean GIS, the profile lines frequently used are vertical profile line, section line and transport line.
2.2.2 Duration line
The initial and the end time, and the lasting time are 3 core properties of time continuous line. It can record the sample data measured on the ship, the lasting time of the trawl and the partial trace of the automatic ship. One of its subcategories is the trace line,which is used in the ship-base data model. Differing from the profile contour, the trace line is only the trace of one ship. The data along the trace may be collected, or may not. Yet the profile contour always contains data.
2.2.3 Element line
Many ocean elements, like the seafloor pipeline, the administerial boundary and the sea route, can be displayed by standard line feature. A unique symbol, the x y coordinate pair and a free style measurement property aiming for application are required.Coastline is an extended subcategory of the element line. When confirming a coastline, the vertical profile data need to be recorded. Thus, a vertical datum plane property is added to store the vertical data of the coastline.
2.3 Marine polygon elements
The two kinds of the polygon elements in marine environment are: the time-independent static element polygon and the time-continuous polygon with initial and end time and also variables.
All the marine polygon elements of the static polygon can be displayed into element polygons, such as the ocean protection district and the exclusive economic zone. The element polygon need one and the only symbol, the x y coordinate pair that form the boundary, the depth and the measurement property defined by customer. A period of changing feature of the dynamic marine polygon elements can be described by time-continuous section.
2.4 Marine grid elements
There are some sea surface features, such as SST, SSH, chlorophyll a, and waterpower measurement. Three kinds of data types can display those features, which are the regular interpolation surface, the irregular interpolation surface and the grid volume component.
2.4.1 Regular interpolation surface
This model is normally used for the remote sensing data and pictures. So far the formats that support the raster data involve ArcGIS, GRID data, GeoTiff, Band Sequential(BSQ), and Band Interleaved (BIL) data. Besides, there are many oceanography and meteorology data products organized by network Common Data Form (netCDF) or hierarchical data format (HDF).
2.4.2 Irregular interpol surface
The irregular triangle grid and many finite element models are the typical types of this kind of data, which recognize the minimum triangle piece through the pivotal node and border. TIN is a precise and effective model for displaying the continuous surface.
2.4.3 Grid volume component
Meshes are defined to fulfill the requirements of the ocean grid model and the analytical application. It displays the data into several layer Mesh data stacks with lines and columns. The structure of the elements flexibly defines the grid elements with regular interval, and these grid points can be the discrete node data.
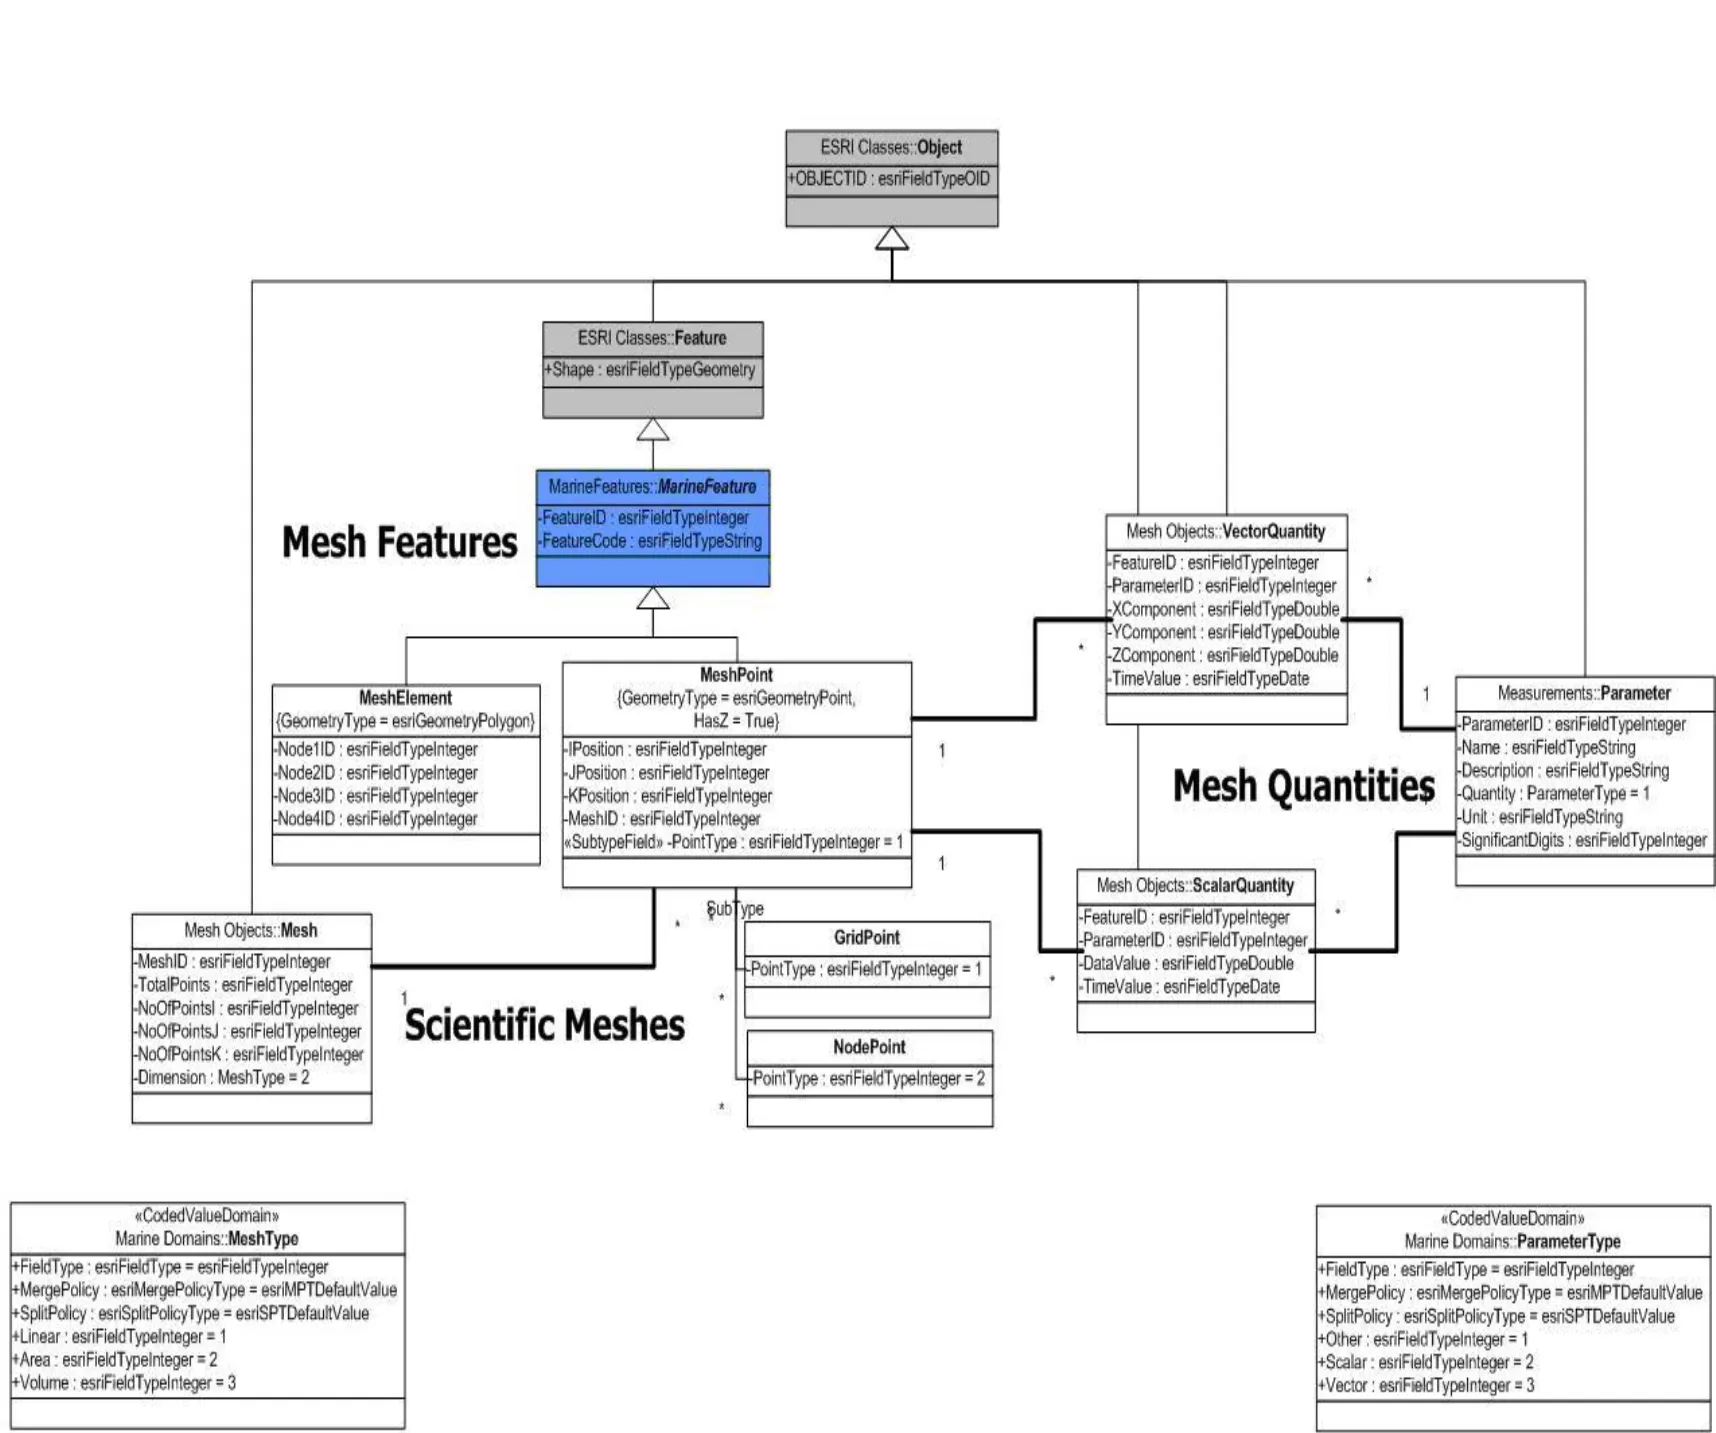
Fig. 1 Model of ocean grid elements
2.5 Ocean dynamic element
The nontraditional spatial data including, cartoon, kinescope, video and so on, aim at displaying the dynamic feature of the ocean data. The video observation data can be obtained by automatic underwater measurement equipment, aerial survey, or the video camera fixed in port, which are used to display the dynamic ocean elements and phenomenon like storm tide and current field.
3 Data model construction and application
Classify the ocean data into 5 categories according to their features, and the“object-oriented” technique is adopted in data management and storage. The object mentioned above is a concept base on the class, and the relations between feature and the object are as follows: 1) Feature is the most basic unit of data model and data structure;2) One feature is corresponding to one object, and has one only ID. 3) Class describes the common property and type of the features, and realizes the instantiation of it. 4) The arithmetic operator of the inner class is adopted to connect the different features, so as to construct the interrelated geographical entities[3]. The foundational idea based on the feature data model is to take the feature as the basic unit and adopt the object-oriented technique to design the space, time, and time-space function, relation and operation between the features.
Most point, line and polygon data are spatial vector data, which all own spatial feature and property features, and the only difference is their spatial display style, and they can be organized and stored by the “Ocean Spatial Data Model”. Although the ocean remote sensing data are raster data, its main feature is spatial feature, thus the model mentioned above can be adopted here, too. The ocean grid element, with great data volume and single property information, fits the “Ocean Grid Data Model”, while the ocean dynamic elements fit the “Relation Data Model” due to the property feature information which the elements mainly contained.
3.1 Ocean spatial data model
The “Feature Dataset-Feature Class-Element” relationship is adopted for the organization of vector element data. Multi feature datasets are allowed, which are established by certain data class respectively, and multi-feature class and object class can be contained in each dataset. Each feature class involves multi geography elements, while each geography element is composed of property information, geometry information,symbol information and label information.
After setting certain grid dataset, the remote sensing image data element can be stored by Raster Mosaic method or Raster Catalog method or both. The grid datasets or grid catalogs are formed according to the name of the subjects, and can be accessed and queried through the related spatial database sheet of the ArcSDE Geodatabase.
The physical storage of the vector spatial data elements is realized by the ArcSDE Geodatabase software. Its relation sheet structure of the storage model in the Geodatanbase is presented below:
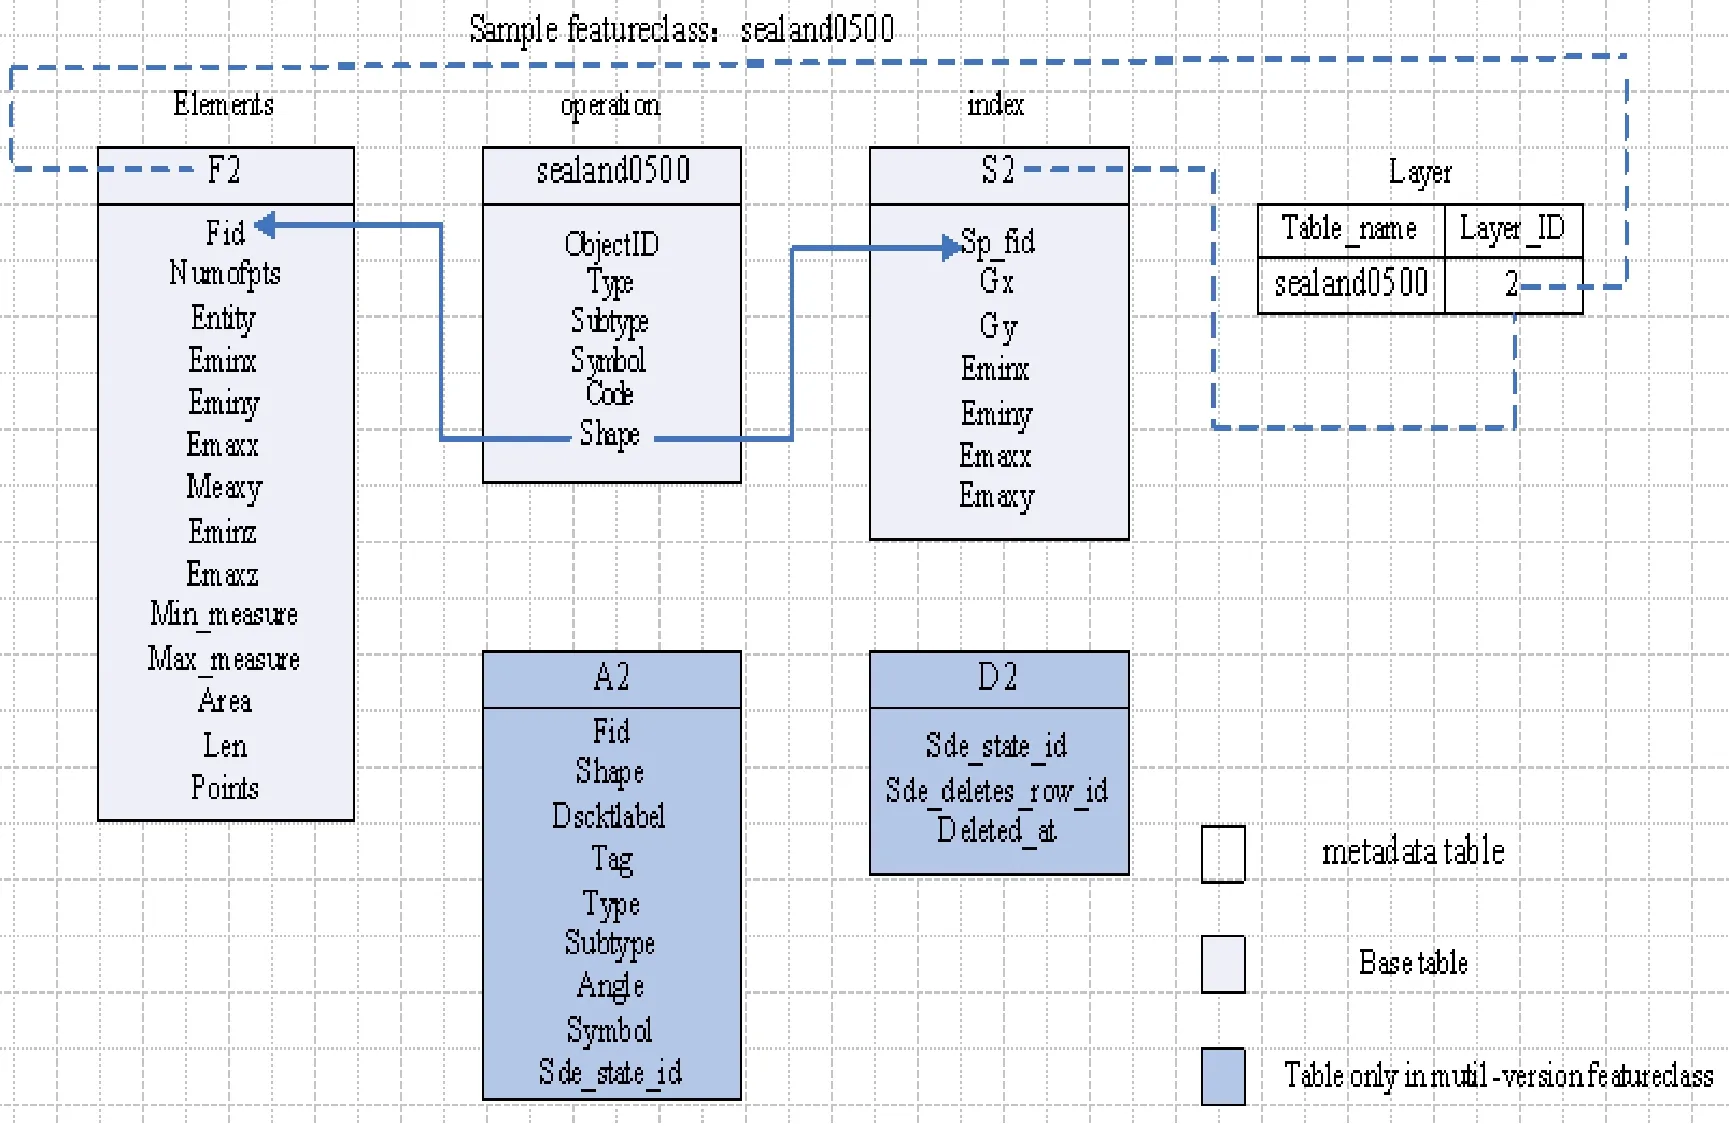
Fig. 2 ArcSDE model of vector data
Every data element vector layer has corresponding Tab. F and Tab. S. There are a series of metadata tables in the ArcSDE Geodatabase responsible for the organization of the spatial metadata and index metadata of the element layer stored in it.
The organization of the spatio-temporal dynamic data relies on the history achieving function of the Geodatabase, and below is the related storage structure.
Tab. B only stores the initial state of the object without the time information, and keeps conservation when editing and updating the data. Table H stores the changing achieving information of the object, mainly the records of property information. For the convenience of object query and historical remount, the time information is directly marked onto the property of the object, and saved in Table H. The time information in Table H includes the object’s valid time (the start of the valid time Vt_start, and the end of the valid time Vt_end) and affair time (the start of the affair time GDB_from_date, and the end of the business time GDB_to_date), also supports double time operation. Table F is responsible for the storage of the spatial feature, while Table S is for the spatial index information. Table R records the changing relation among the objects, while Object ID records the element code of the new object. The label code of the father object is recorded in Father ID. The Event ID is the serial number of the event that affects the changing of the object, which presents the combination and abruption among the objects, makes the changing process of the object clear. The changing events mainly involve the naissance, perdition, abruption and combination of the objects. Only the object formed through abruption or combination has the father object, the object that directly appears or vanishes has no father object.
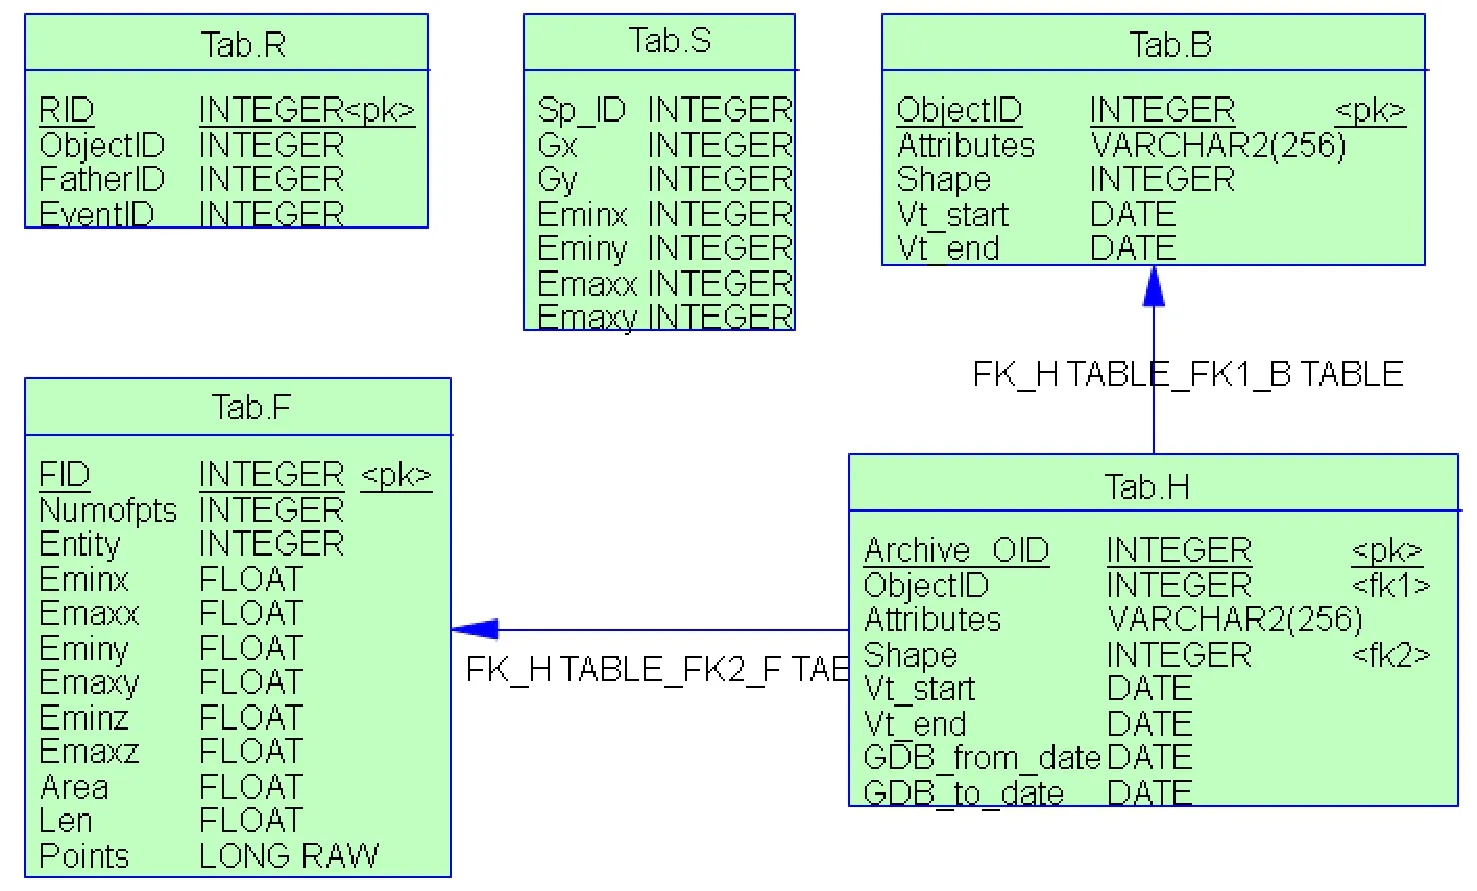
Fig. 3 Spatio-temporal data schema of Geodatabase
3.2 Ocean Solid Grid Data Model
The multi-layer grid data are the foundation of the ocean solid grid data model. It combines multi-layers into a whole object by feature class association to realize the organization and storage of the ocean solid data. Both the regular and irregular interpolation sea surfaces are single layer grid data, which can be treated as the grid volume data with only one layer, while the grid volume element can be treat as the grid volume data with multi-relating layers. Thus, this model is suitable for both the 2-D grid data and the 3-D grid volume data.
The organization and storage of the grid data are realized by designing certain feature element class and object class in the model. This paper adopts the Mesh feature element class to store the one layer or multi-layer data, which involve the vector data and the scalar data like temperature, salinity, density, sound speed, current, storm tide, single layer tide and tidal current and so on. The storage of these data needs the proper Mesh element type chosen according to the characters of the Mesh elements. For temperature,salinity, density and sound speed, we can take vertical multi-layer data at a same time as one Mesh element, or take one layer of it as one Mesh element; while for the storm tide and tide, the field data during a time period are considered as one Mesh element. For the grid field data like current and tidal current, the data of all layers at the same time can be regarded as one Mesh element, or a single layer data at the same time as one Mesh element. Other types of element field data can be analyzed similarly.
Several relation tables need to be defined, such as grid table, grid point table, vector table, scalar table and parameters.

Tab. 4 Construction of grid table

Tab. 5 Construction of parameters table
The relationship of the tables are as follows: the grid points relate to the Mesh table by grid label, while the vector and scalar tables relate to the grid point table by element label, and relate to the parameter table by parameter label. Besides, a metadatabase is needed to illustrate the information of various elements, including the range, name, type,grid resolution, layer depth and updating frequency, etc. The alterable grid element data require specially to be illustrated in the metadata.
In the “digital ocean” system, the environment data like seawater temperature,salinity and current, are divided into several layers by depth and stored by the solid grid data model. Consequently the information of different cross sections and vertical profiles at the same time can be visualized by depth, longitude, latitude or arbitrary direction.
3.3 Relation Data Model
Relation data model sets a certain spatial entity as the object, transforms its data information into different property features, and combines the entity object and property feature together by relating the host keys. It establishes complex data relations and organizes the various multi-source ocean data into a whole. There are two storage methods of this model. One is to store the elements directly into the relation database,which is suitable for binary or text data due to their small data volume and high demand of single-layer accessing. The organization and storage method is to form a document by layering the element data and store this document directly into the database table, namely,to dispart the multi-layer grid elements into several layers and form several documents from one. This storage method is convenient for obtaining, querying and displaying the one-layer element data with little records. Yet for multi-layer profile element data, it’s not efficient. This storage method is mainly suitable for multi-layer regular binary grid data,such as temperature, salinity, density, sound speed, current, and the one-layer binary field data, like storm tide, tide, tidal current, and the modeling analysis and forecast data.

Fig. 3 Temperature information in different depths

Fig. 4 Temperature information in different profiles
Another method is to integrate the database sheet and the document system together, namely, store the metadata and the corresponding storage path in the database sheet, while store the relevant data entity under the directory defined by the document system. It is most efficient for data accessing and reading, which is propitious to the fast obtaining and visualization of the ocean data.
4 Conclusion
This paper classifies the features of ocean data into 5 major categories, and designs 3 data models according to an idea of “object-oriented”. The 3 data models solve the organization and storage problem of the ocean spatial data, solid grid data and great volume text data, respectively. The ocean vector spatial data model integrates the common 2-D ArcGIS software to make the data storage and management easily, which can be viewed, edited and controlled (for popedom and version) by many desktop graphic software. The shortcoming of it is the low efficiency when directly accessing the vector data layer in the 3-D information system, especially the polygon layers, which need to issue the vector layers by web feature service or web map service before using in the 3-D system.The ocean grid data model is designed specially for the storage of solid grid data, which is effective in storing the great volume grid data (in TB). Thanks to the pyramid structure it adopted, the reading speed is fast enough to satisfy the demand of the 3-D information system. However, its disadvantage is the failure of directly data editing. The grid data need processing in advance before storing into the database. The relation data model is good at storing various types of property data, such as the picture, text, model and sound, etc. It’s a sharp instrument for storing the “sundries” data, which plays an important role in constructing the digital ocean information system.
In conclusion, so far there is no universal model suitable for the organization and storage of all kinds of ocean element data. Each model has its own merits and drawbacks,and also the limitation in application. Thus, the choice of the organization & storage method need to base on the demand of realistic application. Some are suitable for the manner of document system, while some fit for the common relation database, also there are considerable part of them suitable for the spatial database model. New data model should be introduced to display the spatial dynamic behavior of ocean and visualize its elements. Our ocean solid grid data model is such an example. Although it still can not be realized without the Geodatabase spatial data model, the ocean data types mentioned in its model design and organization are suitable for the concrete ocean applications.
Reference
[1] HOU Wenfeng. Tentative Ideas on the Development of Digital Ocean in China [J]. Marine Science Bulletin, 1999, 12(6):1 - 10.
[2] Pavlopoulos A, Theodoul I D. Review of spatio temporal data models [R]. Time Lab Technical Report TR-98-3, 1998, 2 629 - 2 640.
[3] LI Shan, XUE Cunjin, HE Huizhong. Feature-Based Marine Line Data Model [J]. Sun Yatsen University Forum, 2006, 26(9):193 - 198.
[4] XUE Cunjin, ZHOU Chenghu, SU Fenzhen, et al. Research on Process-Oriented Temporal-Spatio Data Model [J]. Acta Geodaetica et Cartographica Sinica, 2010, 39(1):95 - 101.
[5] ZHANG Feng, SHI Suixiang, YIN Ruguang, et al. Research of Data Architecture in Digital Ocean[J], Marine Science Bulletin, 2009, 28(9):1 - 8.
[6] SU Fenzhen, DU Yunyan, PEI Xiangbin, et al., Constructing Digital Sea of China with the Datum of Coastal Line [J]. Geo-information Science, 2006, 3, 8(1):12 - 15.
[7] JIA Jun-tao, ZHAI Jing-sheng, WU Zhong-ding, et al. Constructing Digital Sea of China with the Datum of Coastal Line [J], Geo-information Science, 2007, 25(1):111 - 116.
[8] BAO Yu-bin, LU Qun, CAI Jin-ming, et al. Domain Ontology-based Multidimensional Modeling of Marine Environmental Data Warehouse [J], Marine Science Bulletin, 2009, 28(4):132 - 140.
[9] QIN Rufu, YE Na, XU Huiping, et al. Visualization of Multi-dimension Oceanographic Data in Geography Information System [J]. Journal of Tongji University (natural science), 2009, 37(2):272 -276.
[10] HE Guangshun, LI Sihai. Constructing Spatial Information Database for Digital Ocean [J]. Marine Information, 2004, (1): 1 - 4.
海洋信息组织与存储模型研究及其在“数字海洋”中的应用
刘 金1,李昊倩1,朱吉才2,姜晓轶1,张 峰1
(1. 国家海洋信息中心 天津 300171;2. 中国核工业地质局 北京 100013)
基于中国数字海洋建设的经验和成果,制定了海洋数据要素的分类方案,将海洋信息分为5大类:海洋点要素、海洋线要素、海洋面要素、海洋网格要素、海洋动态要素。采用基于特征的方法和面向对象的技术设计了适合数字海洋大型信息系统工程建设的时空数据模型,探讨了海洋空间数据模型、海洋立体格网数据模型、关系数据模型在数字海洋数据仓库建设中的应用,并总结了其优缺点。
数字海洋;球体模型;数据仓库;海洋要素;数据组织与存储
on May 5, 2011
liujin@mail.nmdis.gov.cn

